Please wait as we load hundreds of rigorously documented facts for you.
Please wait as we load hundreds of rigorously documented facts for you.

For example:

In accord with the standard practice of economists and government agencies, many of the debt, spending, and revenue figures in this research are expressed as a portion of annual U.S. economic output, or gross domestic product (GDP). This is because debates about the size of government and the effects of its debt are frequently centered upon how much of a nation’s economy is consumed by government. This measure also accounts for population growth, moderate inflation, and the relative capacity of governments to service their debts.[1] [2] [3] [4] [5] [6] [7] [8]
However, the federal government cannot appropriate the entire U.S. economy to pay its debts. This is because private citizens—who produce the goods and services that comprise the bulk of the economy—use most of these resources to live. Also, state and local governments consume some of the nation’s GDP. Hence, this research sometimes expresses federal debt as a portion of annual federal revenues. This is a more direct measure of the federal government’s capacity to service its debts.
In keeping with Just Facts’ Standards of Credibility, all charts in this research show the full range of available data, and all facts are cited based upon availability and relevance, not to slant results by singling out specific years that are different from others.
* As of April 1, 2024, the U.S. Treasury’s official figure for the debt of the federal government is $34.6 trillion, or more precisely, $34,627,201,333,064.[9] This equates to:
* During 2022, while the national debt was 123% to 127% of GDP,[15] [16] some organizations and individuals claimed it was 98% to 100%.[17] [18] [19] These lower figures don’t account for the full national debt but omit a portion of it called “debt held by government accounts.”[20] [21] [22] [23] For more facts about this issue, see the section below on government accounting.
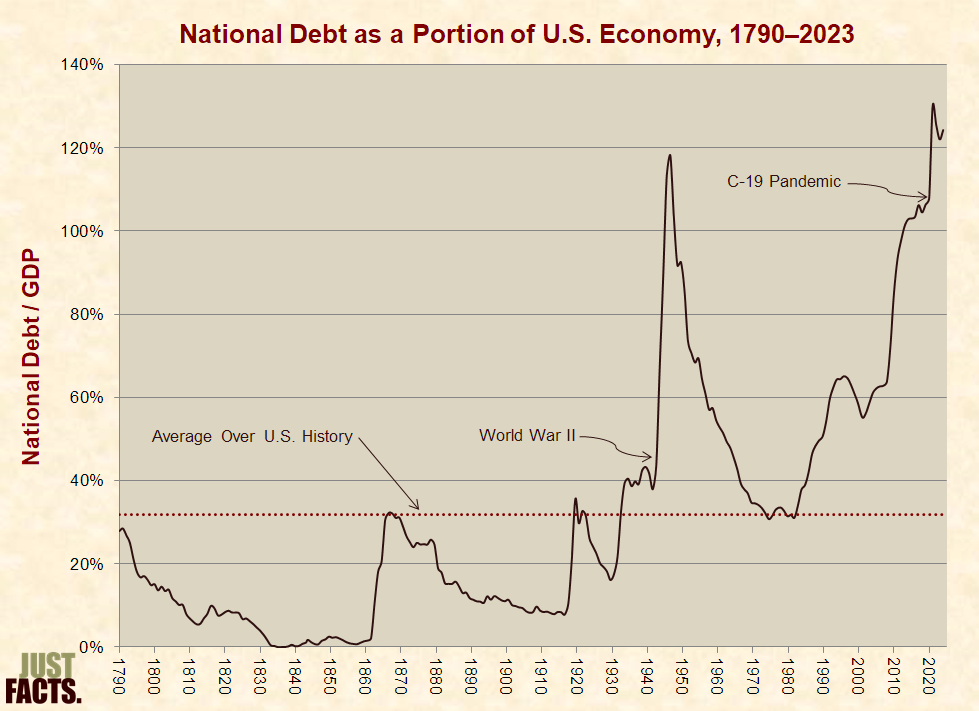
* Over the course of U.S. history, the national debt has averaged 32% of the nation’s GDP.[24]
* In May 2020 (two months after the outset of the Covid-19 pandemic[25]), the national debt reached 120% of GDP, breaking a record set in 1946 for the highest level in the history of the United States. The previous record of 118% stemmed from World War II, the deadliest and most widespread conflict in world history.[26] [27]
* At the end of 2023, the national debt was 124% of GDP, or 3.9 times its average over U.S. history:
* For additional facts and a video about the magnitude, causes, and consequences of the surge in government debt over recent decades, visit Just Facts’ article “National Debt Breaks All-Time Record for Highest Portion of U.S. Economy.”
* Per the U.S. Government Accountability Office, which is the official watchdog of Congress:[29]
* Federal law requires publicly traded corporations to account for their “explicit” and “implicit” liabilities and obligations. These include employee pensions and other financial burdens that companies have accrued but not paid for yet. This type of bookkeeping is called “accrual accounting.”[32] [33] [34] [35]
* At the close of its 2022 fiscal year, the federal government had accrued roughly:
* The figures above are determined with federal data in a manner that approximates how publicly traded corporations are required by law to report their liabilities and obligations.[42] [43] [44] [45] [46] The unfunded obligations of Social Security and Medicare reflect how much money must be immediately placed in interest-bearing investments to cover the projected shortfalls for all of the programs’ current participants (both taxpayers and beneficiaries). These shortfalls are equal to:
* Balanced against the value of its commercial assets,[50] the federal government had a combined total of $135.5 trillion ($135,487,000,000,000) in debts, liabilities, and unfunded obligations at the close of its 2022 fiscal year.[51] This shortfall equates to:
* The figures above don’t account for the unfunded obligations of any federal policies or programs other than Social Security and Medicare.[58] [59]
* The unfunded obligations of Social Security and Medicare are based on current federal laws, federal data, and federal economic and demographic projections.[60] [61] [62] With regard to these factors:
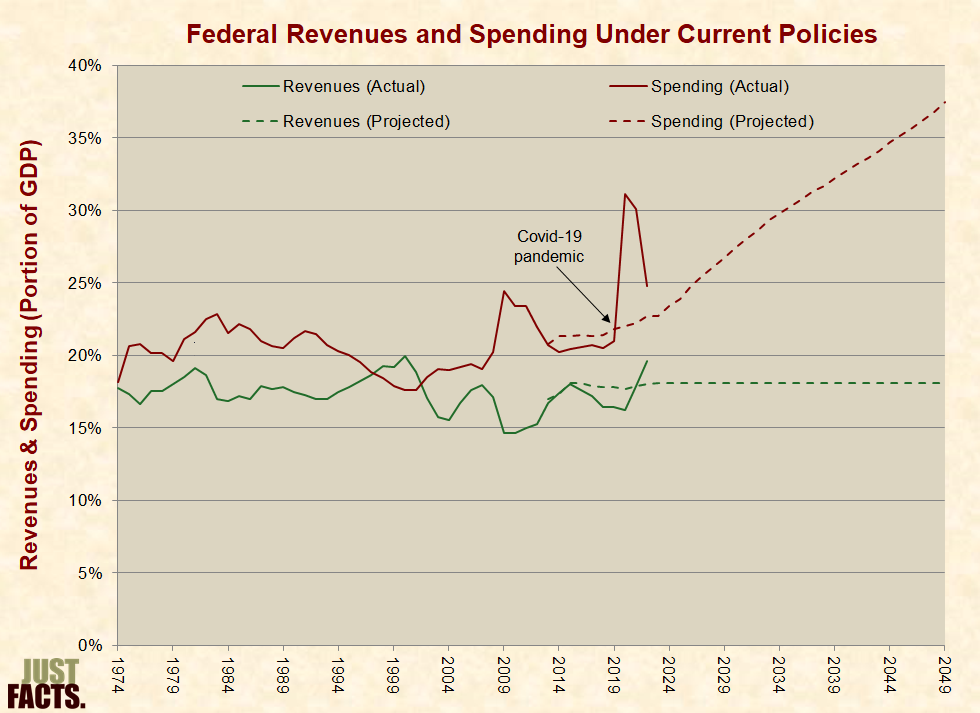
* From 1929 to 2022, federal government current expenditures and receipts—as a portion of gross domestic product—have varied as follows:
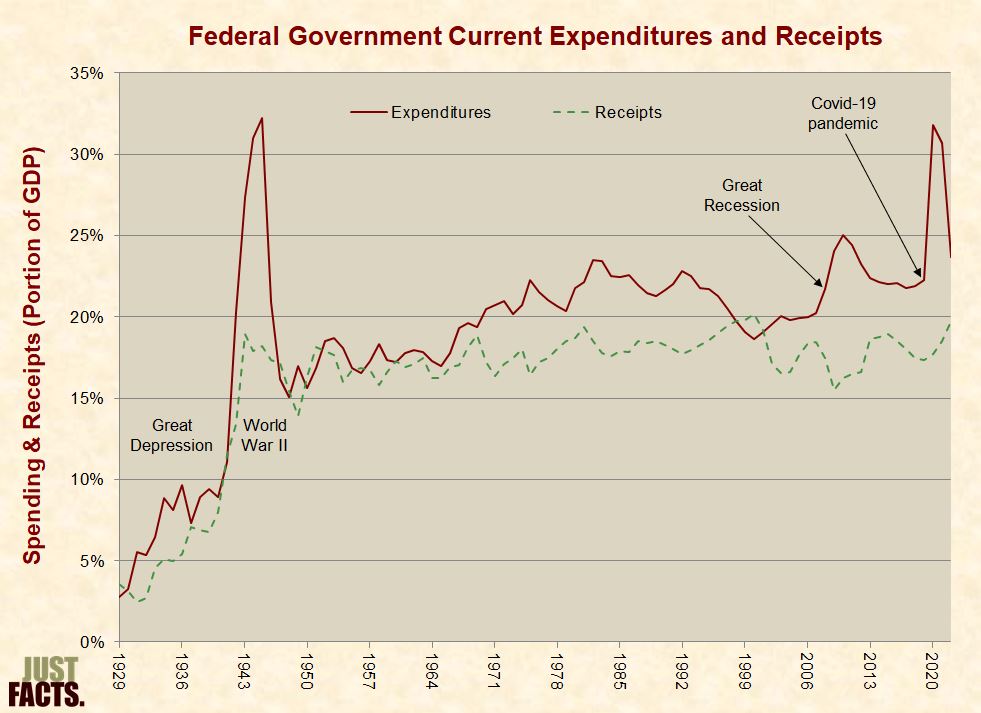
* Data from the chart above:
|
Year |
Receipts |
Expenditures |
|
1930 |
3% |
3% |
|
1940 |
8% |
9% |
|
1950 |
16% |
16% |
|
1960 |
17% |
17% |
|
1970 |
17% |
20% |
|
1980 |
19% |
22% |
|
1990 |
18% |
22% |
|
2000 |
20% |
19% |
|
2010 |
16% |
25% |
|
2020 |
18% |
33% |
|
2022 |
20% |
24% |
* From 1959 to 2022, the portion of federal government outlays that were spent on:
* Data from the chart above:
|
Category |
Portion of Federal Current Spending |
|||||||
|
1960 |
1970 |
1980 |
1990 |
2000 |
2010 |
2020 |
2022 |
|
|
Social Programs |
21% |
32% |
44% |
44% |
54% |
61% |
73% |
64% |
|
National Defense & Veterans’ Benefits |
53% |
42% |
27% |
25% |
19% |
20% |
14% |
17% |
|
General Government & Debt Service |
19% |
18% |
21% |
25% |
20% |
13% |
10% |
15% |
|
Economic Affairs |
6% |
7% |
7% |
5% |
5% |
4% |
3% |
4% |
|
Public Order & Safety |
0% |
0% |
1% |
1% |
1% |
2% |
1% |
1% |
* A scientific, nationally representative survey commissioned in 2020 by Just Facts found that 50% of voters believe social spending is not the main cause of rising national debt.[72] [73] [74]
* From 1979 to 2020, the effective federal tax rates paid by households of different incomes have varied as follows:
* Data from the chart above for 2019, prior to the Covid-19 pandemic:[78]
|
Average Effective Federal Tax Burdens (2019) |
|||
|
Income Group |
Income |
Tax Rate |
Taxes Paid |
|
Lowest 20% |
$39,100 |
0.3% |
$100 |
|
Second 20% |
$59,600 |
7.7% |
$4,600 |
|
Middle 20% |
$85,500 |
12.4% |
$10,600 |
|
Fourth 20% |
$124,900 |
16.5% |
$20,600 |
|
Highest 20% |
$333,100 |
24.3% |
$81,100 |
* Breakdown of the highest 20%:
|
Income Group |
Income |
Tax Rate |
Taxes Paid |
|
81st–90th |
$181,300 |
19.9% |
$36,000 |
|
91st–95th |
$250,400 |
22.0% |
$55,000 |
|
96th–99th |
$417,400 |
24.4% |
$101,800 |
|
Top 1% |
$1,998,700 |
30.0% |
$600,300 |
* Data from the chart above for 2020—amid Covid-19 government lockdowns and intensified social spending:[79] [80] [81]
|
Average Effective Federal Tax Burdens (2020) |
|||
|
Income Group |
Income |
Tax Rate |
Taxes Paid |
|
Lowest 20% |
$42,200 |
–8.8% |
–$3,700 |
|
Second 20% |
$63,600 |
0.6% |
$400 |
|
Middle 20% |
$90,500 |
7.0% |
$6,300 |
|
Fourth 20% |
$131,800 |
12.7% |
$16,800 |
|
Highest 20% |
$360,900 |
23.6% |
$85,200 |
* Breakdown of the highest 20%:
|
Income Group |
Income |
Tax Rate |
Taxes Paid |
|
81st–90th |
$191,500 |
17.6% |
$33,700 |
|
91st–95th |
$265,100 |
21.1% |
$55,900 |
|
96th–99th |
$440,000 |
24.1% |
$106,200 |
|
Top 1% |
$2,291,800 |
29.9% |
$686,300 |
* A scientific, nationally representative survey commissioned in 2019 by Just Facts found that 79% of voters believe middle-income households pay a greater portion of their income in federal taxes than the top 1%.[82] [83] [84]
* Per the U.S. Government Accountability Office, when the federal government spends more than it collects in revenues, the resulting debt is “borne by tomorrow’s workers and taxpayers.”[85]
* As detailed in publications of the Government Accountability Office, the Congressional Budget Office, the Brookings Institution, and Princeton University Press, excessive government debt can cause:
* Because association does not prove causation, and because numerous factors can affect economic outcomes, there is frequently no objective way to isolate the effects of a single factor (like government debt) on a single outcome (like wages or inflation).[101] [102] [103] [104]
* The consequences of government debt can manifest slowly over the course of decades or suddenly in a few years or less.[105] [106] [107]
* The most accurate measure of nations’ living standards is their household consumption of goods and services.[108] [109] This is “preferred welfare indicator” of the World Bank.[110] [111]
* Some people claim that nations with their own currencies suffer minimal consequences from high national debts. They say this is because these nations can always print more money to finance their debts. People who make this argument commonly compare the high-debt nations of Japan and Greece while alleging that Japan (which has its own currency) has not economically suffered like Greece (which does not have its own currency).[112] [113] [114] [115] [116]
* As Japan’s national debt surged in the 1990s and 2000s,[117] the nation had much slower growth in its living standards than Greece. Near the end of this period, Greece’s government debt bubble burst, and it experienced a sudden collapse in living standards.[118] Ultimately, the debt-burdened nations of Japan and Greece ended up in about the same place:

* Gross domestic product (GDP) is the standard measure of nations’ economic output. It is equal to the value of all goods and services that a country produces in a year minus the resources used to produce them.[120] [121]
* GDP divided by population is often used to measure a country’s standard of living. Per the textbook Macroeconomics for Today:
* In 2012, the Journal of Economic Perspectives published a study about the economic consequences of government debt based on 2,000+ data points on debt and economic growth across two centuries and 20 advanced economies (like the United States, France, and Japan). The authors of this paper, Carmen M. Reinhart of the University of Maryland, Vincent R. Reinhart of Morgan Stanley, and Kenneth S. Rogoff of Harvard University:
* In April of 2013, the Political Economy Research Institute at the University of Massachusetts, Amherst, published a working paper that was widely cited by media outlets as evidence that large national debts don’t harm economies.[128] [129] The authors of this paper, Thomas Herndon, Michael Ash, and Robert Pollin:
* In 2022, the interest on the national debt was $775 billion, or more precisely, $774,679,343,619.[139] This amounts to:
* In federal fiscal years 1962 to 2022, interest on the national debt ranged from 9% to 27% of federal revenues, with a median of 16% and an average of 17%. In 2022, the interest on the national debt was 15% of federal revenues:

* The primary factors that affect interest costs are the amount of debt owed and the interest rates charged on that debt.[148] [149] [150]
* Even though the national debt is currently a larger portion of the U.S. economy than any era of the nation’s history, interest on the debt is currently about the same as historical norms. This is because the average interest rate on the debt has been much lower than in the past. However, the Congressional Budget Office “anticipates” that interest “payments will increase considerably as interest rates return to more typical levels.”[151] [152]
* In federal fiscal years 1962 to 2022, the average annual interest rate on the national debt ranged from 1.9% to 10.3%, with a median of 5.3% and an average of 5.4%. In 2022, the rate was 2.3%:
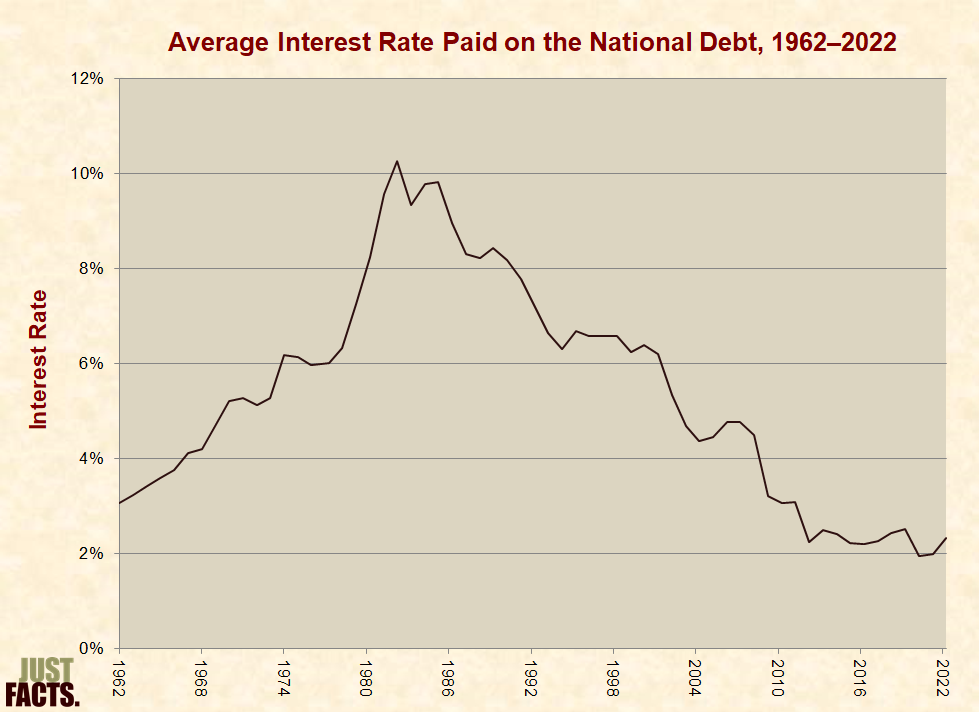
* In 2022, the average interest rate on debt held by the public was 2.2%, and the average interest rate on intergovernmental debt was 3.4%.[154]
* Per the Congressional Research Service, the Federal Reserve, the Congressional Budget Office, and the White House Office of Management and Budget, the following factors affect interest rates on the debt held by the public:
* When deciding the term length (maturity) of the debt it issues, the Treasury tries to balance the benefit of lower costs from short-term interest rates with the benefit of having predictable payments on long-term debt.[180] At the end of 2022, the average maturity of outstanding debt was 74 months—approximately 14 months longer than the historical average of 60 months.[181] [182]
* Interest rates on intergovernmental debt are affected by the same drivers as debt held by the public.[183] [184]
* The interest rates on most intergovernmental debt are based on the average interest rate of long-term debt held by the public. This applies regardless of whether the intergovernmental debt is short-term or long-term.[185] [186] [187] [188] [189] [190]
* Since long-term debts generally have higher interest rates than short-term debts, interest rates on intergovernmental debt tend to be higher than interest rates on debt held by the public.[191] [192] [193] [194] In 2022, the average interest rate on debt held by the public was 2.2%, and the average interest rate on intergovernmental debt was 3.4%.[195]
* The Social Security Trust Fund—which makes up roughly 41% of all intergovernmental debt—starts all new investments as short-term debt scheduled to mature on the upcoming June 30th. On June 30th, the matured debt and its interest are rolled into new debts of different maturities ranging from 1 to 15 years.[196] [197] [198]
* Regardless of the maturity of a debt, federal trust funds can demand repayment with interest at any time if they need the money to cover their expenses. This feature makes these investments similar to cash from a liquidity perspective.[199] [200] [201]
* The U.S. Constitution vests Congress with the powers to tax, spend, and pay the debts of the federal government. Legislation to carry out these functions must be enacted in one of the following ways:
* Other factors impacting the national debt include but are not limited to inflation, legislation passed by previous Congresses and presidents,[203] economic cycles, terrorist attacks, pandemics, natural disasters, demographics, and the actions of U.S. citizens and foreign governments.[204] [205] [206]
* In 2013, the Congressional Budget Office projected the publicly held debt that the U.S. government would accumulate under current federal policies and their economic effects.[207] [208] Combining these projections with historical data and actual outcomes since then yields the following results:
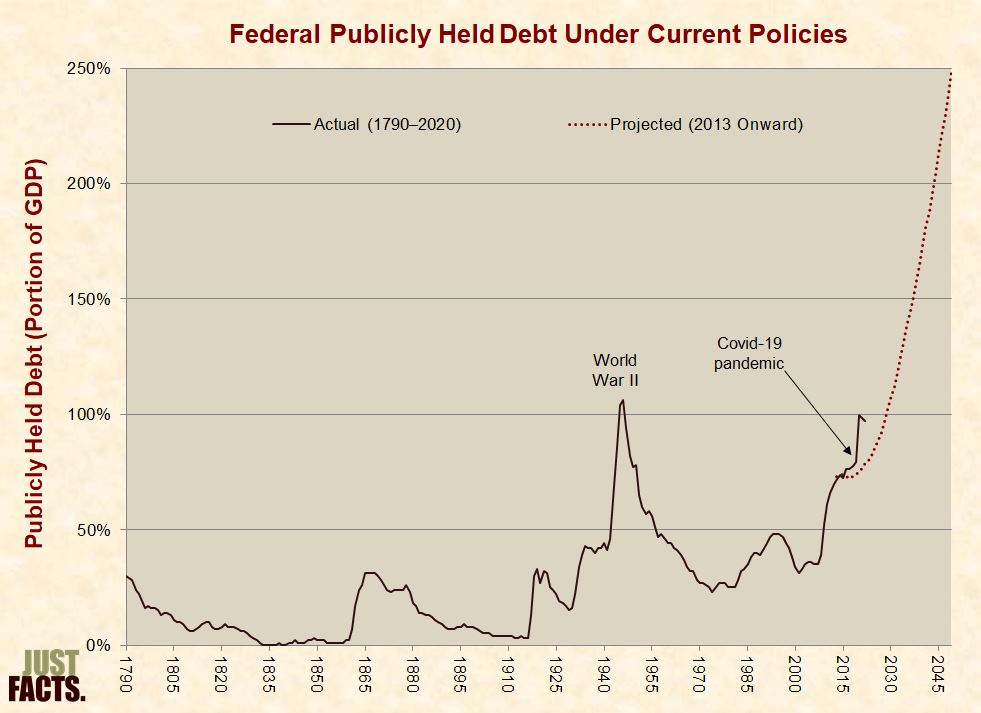
* Other than interest on the national debt, most of the long-term projected growth in federal spending is from Medicare, Medicaid, Social Security, the Children’s Health Insurance Program, and the Affordable Care Act (a.k.a. Obamacare).[214] [215]
* Per the Congressional Budget Office, postponing action to stabilize the debt will:
* World War II began in 1939, the U.S. joined it in 1941, and it ended in 1945.[219] It was the deadliest and most widespread conflict in world history, claiming 40–50 million lives.[220] In 1946, the U.S. national debt reached 118.4% of the U.S. economy (GDP), the highest it had ever been in the history of the United States until this record was broken in May of 2020.[221]
* The following Ph.D. economists and political scientists have claimed that high levels of national debt during World War II prove that the modern national debt is not a serious threat:
* None of the publications above mentioned that in the 40 years that followed the end of World War II (1946–1985):
* In 2010, around the time when the scholars made the claims above, the Congressional Budget Office projected that under current policies and a sustained economic recovery over the next 40 years:
* By the end of 2022, the total national debt had risen to 123% of GDP, or 4% above the peak of World War II.[233]
* As alternatives to the current policy projections above, the Congressional Budget Office has also run projections for scenarios such as these:
1) Current law:[234]
2) Republican Congressman Paul Ryan’s 2014 budget resolution, called the “The Path to Prosperity”:[242]
* Combining historical data on the national debt with the Congressional Budget Office’s 2014 projections for current policy, current law, and the Ryan plan yields the following results:

* Other than interest on the national debt, most of the long-term projected growth in federal spending under the Congressional Budget Office’s current policy and current law scenarios stems from Social Security, Medicare, Medicaid, the Children’s Health Insurance Program, and Affordable Care Act (a.k.a. Obamacare) subsidies.[258] [259]
* A series of Pew surveys conducted since 2002 have shown that public concern about the federal deficit has varied with the national debt as follows:
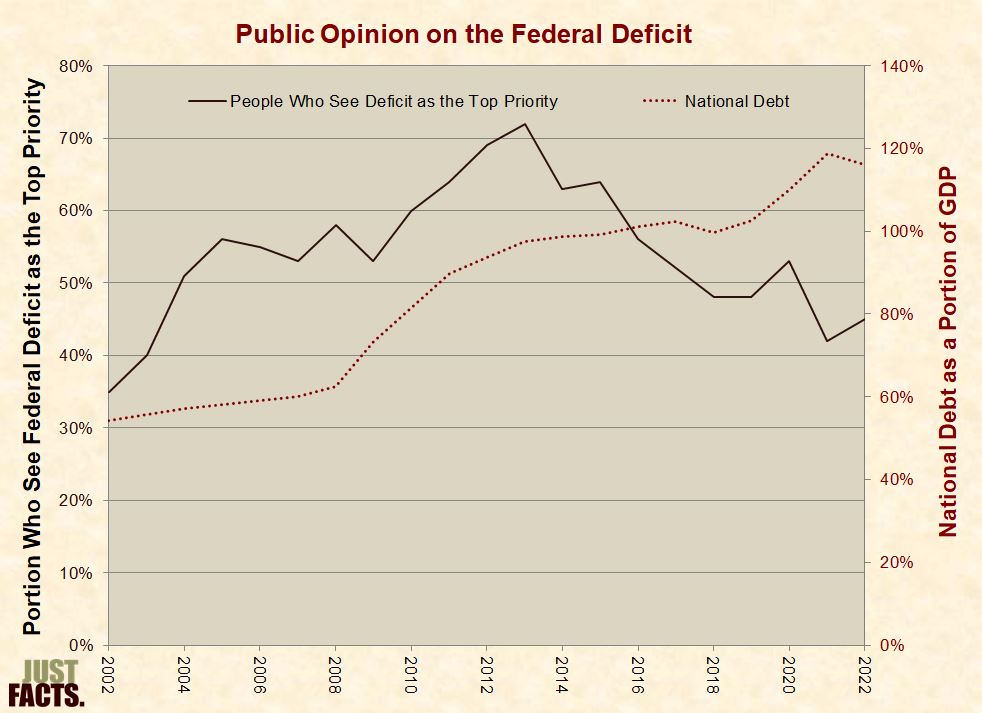
[260] [261] [262] [263] [264] [265]
* A poll conducted by Pew Research Center and USA Today in February 2013 found that:
* A poll conducted by NBC News and the Wall Street Journal in February 2011 found that:
* A poll conducted in November 2010 by the Associated Press and CNBC found that:
* A poll conducted in July 2005 by the Associated Press and Ipsos found that:
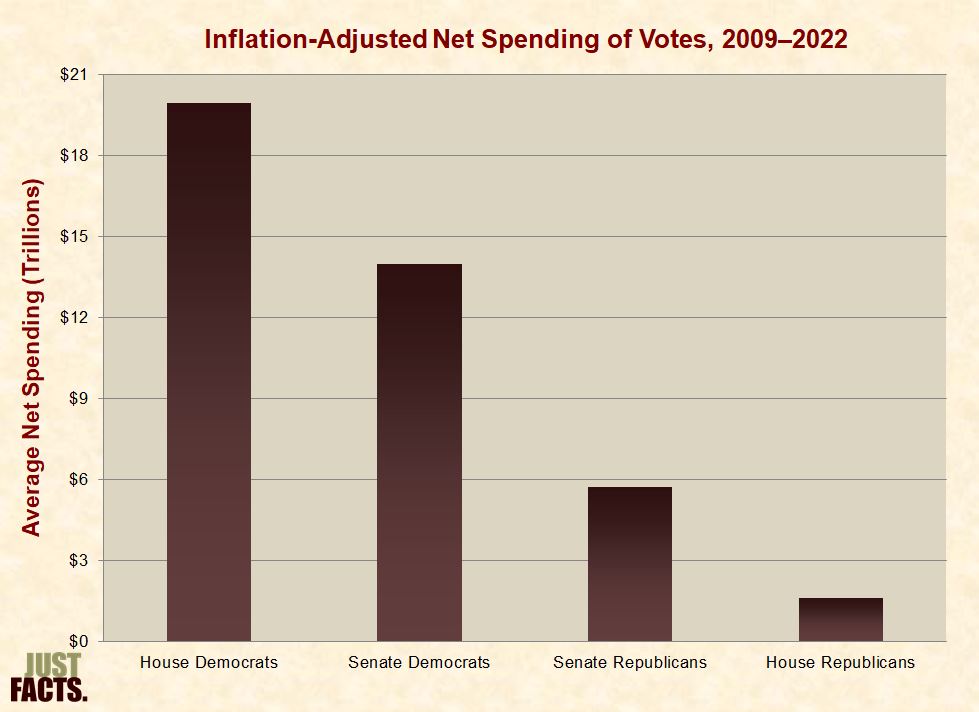
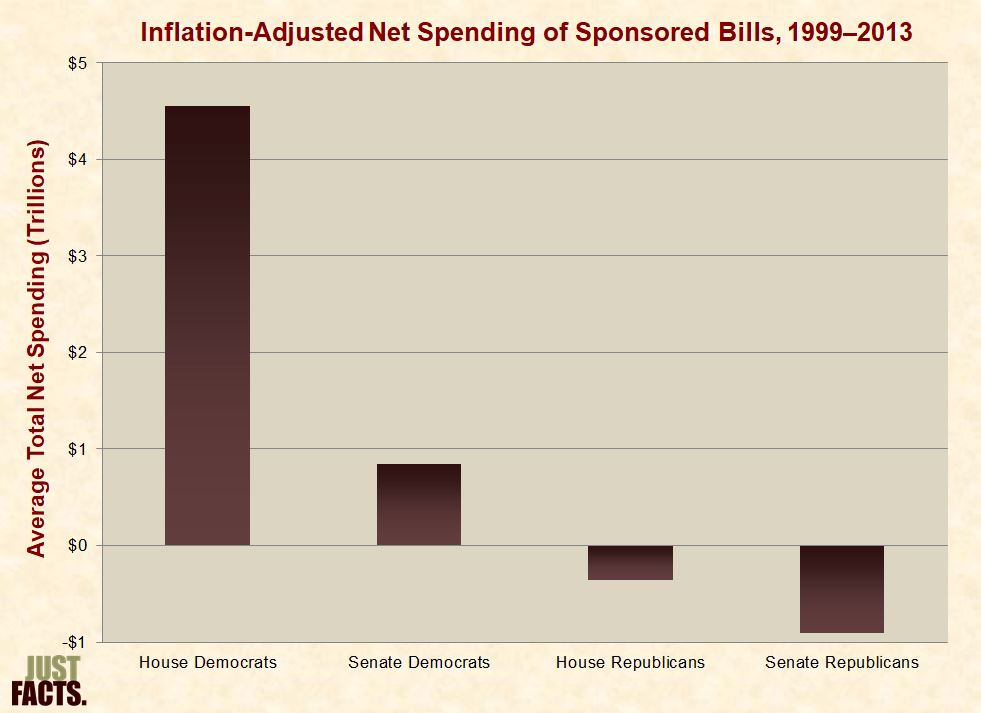
* During the first session of the 113th Congress (January–December 2013), U.S. Representatives and Senators introduced 168 bills that would have reduced spending and 828 bills that would have raised spending.[275]
* During the first session of each Congress from 1999 to 2013, the inflation-adjusted increase of net spending in bills sponsored by the average Congressperson from each party totaled:
* In February 2001, Republican President George W. Bush stated:
* From the time that Congress enacted Bush’s first major economic proposal (June 7, 2001[278]) until the time that he left office (January 20, 2009[279]), the national debt rose:
* During eight years in office, Bush vetoed 12 bills, four of which were overridden by Congress and thus enacted without his approval.[284] The Congressional Budget Office projected that these bills would increase the deficit by $26 billion during 2008–2022.[285]
* In February 2009, Democratic President Barack Obama stated:
* From the time that Congress enacted Obama’s first major economic proposal (February 17, 2009[287]) until the time he left office (January 20, 2017[288]), the national debt rose:
* During eight years in office, Obama vetoed 12 bills, one of which was overridden by Congress and thus enacted without his approval.[293] The Congressional Budget Office projected that this bill would “have no significant effect on the federal budget.”[294]
* In March 2016, Republican presidential candidate Donald Trump had the following exchange in an interview with Bob Woodward of the Washington Post:
* From the time that Congress enacted Trump’s first major economic proposal (December 20, 2017[296]) until the outset of the Covid-19 pandemic (March 11, 2020[297]), the national debt rose:
* Before the Covid-19 pandemic, Trump vetoed six bills, none of which were overridden by Congress.[302]
* From the outset of the Covid-19 pandemic (March 11, 2020[303]) until the time Trump left office (January 20, 2021[304]), the national debt rose:
* During the Covid-19 pandemic, Trump vetoed four bills, one of which was overridden by Congress and thus enacted without his approval.[309] The Congressional Budget Office estimated that this bill would increase the deficit by $21 million during 2021–2030.[310]
* State government-imposed lockdowns and other reactions to the Covid-19 pandemic decreased GDP at the end of Trump’s term, thereby increasing the debt/GDP ratio.[311] [312] [313] [314]
* In May 2022, President Biden claimed:
* From the time that Congress enacted Biden’s first major economic proposal (March 10, 2021[316]) until December 31, 2022, the national debt:
* From the beginning of his presidency until December 31, 2022, Biden vetoed one bill, and it was not overridden by Congress.[321]
* The lifting of Covid-19 lockdowns allowed GDP to recover in the first year of Biden’s term, thereby decreasing the debt/GDP ratio.[322] [323] [324] [325]
* As documented in an article published by the Federal Reserve Bank of St. Louis, inflation:
* The finances of some federal programs (like Social Security) are legally separated from the rest of the federal government.[329] When such programs spend less money than they receive, they are legally required to loan any surplus money to the federal government. This adds to the national debt, and the federal government is legally required to pay back these programs with interest.[330] [331] [332] [333] [334] [335]
* The federal government divides the national debt into two main categories:[336] [337]
* Politicians, journalists, and activists often use terms that refer to the total national debt, when in fact they are only referring to a portion of it.[341] To clear up the confusion this has created, below are common terms for the national debt categorized by their correct meanings:
* At the outset of 2023, the $31.4 trillion national debt was comprised of:
* The federal law that governs the repayment of the national debt draws no distinction between publicly held debt and intergovernmental debt. Both must be repaid with interest.[352] [353]
* The White House Office of Management and Budget, the Congressional Budget Office, and other federal agencies sometimes exclude intergovernmental debt in their reckonings of the national debt because this portion of the debt “represents internal transactions of the government and thus has no effect on credit markets.”[354] [355] [356] [357] [358]
* In contrast, federal programs to which this money is owed, such as Social Security and Medicare, include intergovernmental debt and the interest that it generates in their assets and financial projections.[359] [360] [361]
* In the 2000 presidential race, the Gore–Liebermann campaign released a 192-page economic plan that contains over 150 uses of the word “debt.” In none of these instances does the plan mention or account for any intergovernmental debt.[362] The same plan includes intergovernmental debt in the assets of the Social Security and Medicare programs.[363]
* During the federal government’s 2010 fiscal year, the national debt rose from $12.0 trillion to $13.6 trillion, thus increasing by $1.6 trillion.[364] [365]
* The White House, USA Today, Reuters, and other government agencies and media outlets reported that the 2010 federal “deficit” was $1.3 trillion.[366] [367] [368]
* The difference between the national debt increase of $1.6 trillion and the reported deficit of $1.3 trillion is attributable to the following accounting practices:
* PolitiFact, a Pulitzer Prize-winning organization that claims to “help you find the truth in politics,”[372] reported in 2009 that there were “several years of budget surpluses” during Bill Clinton’s presidency. This same article cited the nominal increase in “national debt” during George W. Bush’s presidency.[373] Using the same criterion that PolitiFact applied to Bush’s presidency (the nominal change in national debt since he took office), the national debt rose every year of Clinton’s presidency:
|
Year |
National Debt (Billions) |
|
1993 |
$4,188 |
|
1994 |
$4,501 |
|
1995 |
$4,797 |
|
1996 |
$4,988 |
|
1997 |
$5,310 |
|
1998 |
$5,496 |
|
1999 |
$5,624 |
|
2000 |
$5,706 |
|
2001 |
$5,728 |
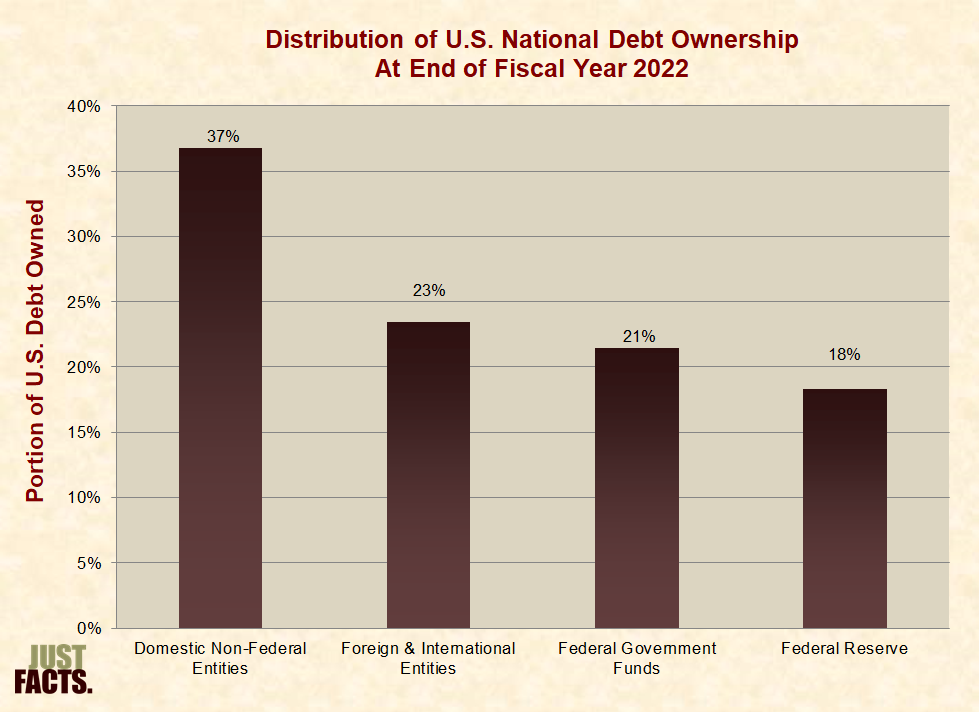
* At the close of the federal government’s 2022 fiscal year on September 30, 2022,[376] the total national debt was $30.9 trillion, and the owners of this debt were:
|
Owner |
Amount (Billions) |
Portion of Total |
|
Domestic Non-Federal Entities |
$11,362 |
37% |
|
Mutual Funds |
$2,606 |
8% |
|
Banks & Savings Institutions |
$1,740 |
6% |
|
State & Local Governments |
$1,537 |
5% |
|
Private Pension Funds |
$750 |
2% |
|
Insurance Companies |
$372 |
1% |
|
State & Local Government Pension Funds |
$366 |
1% |
|
U.S. Savings Bond Holders |
$166 |
1% |
|
Other Investors |
$3,825 |
12% |
|
Foreign & International Entities |
$7,252 |
23% |
|
Japan |
$1,116 |
4% |
|
China |
$902 |
3% |
|
United Kingdom |
$665 |
2% |
|
Belgium |
$325 |
1% |
|
Cayman Islands |
$302 |
1% |
|
Luxembourg |
$300 |
1% |
|
Switzerland |
$273 |
1% |
|
Ireland |
$265 |
1% |
|
Brazil |
$222 |
1% |
|
Taiwan |
$215 |
1% |
|
Other Nations |
$2,666 |
9% |
|
Federal Government Funds |
$6,630 |
21% |
|
Social Security |
$2,838 |
9% |
|
Military Retirement |
$1,195 |
4% |
|
Civil Service Retirement and Disability |
$1,007 |
3% |
|
Medicare |
$345 |
1% |
|
Department of Defense Retiree Healthcare |
$322 |
1% |
|
Deposit Insurance |
$125 |
0.4% |
|
Nuclear Waste Disposal Fund |
$57 |
0.2% |
|
Unemployment Insurance |
$74 |
0.2% |
|
Other Funds |
$667 |
2% |
|
Federal Reserve |
$5,672 |
18% |
|
Total |
$30,915 |
100% |
* Since 1933, the portion of the national debt borrowed from the Federal Reserve has varied as follows.
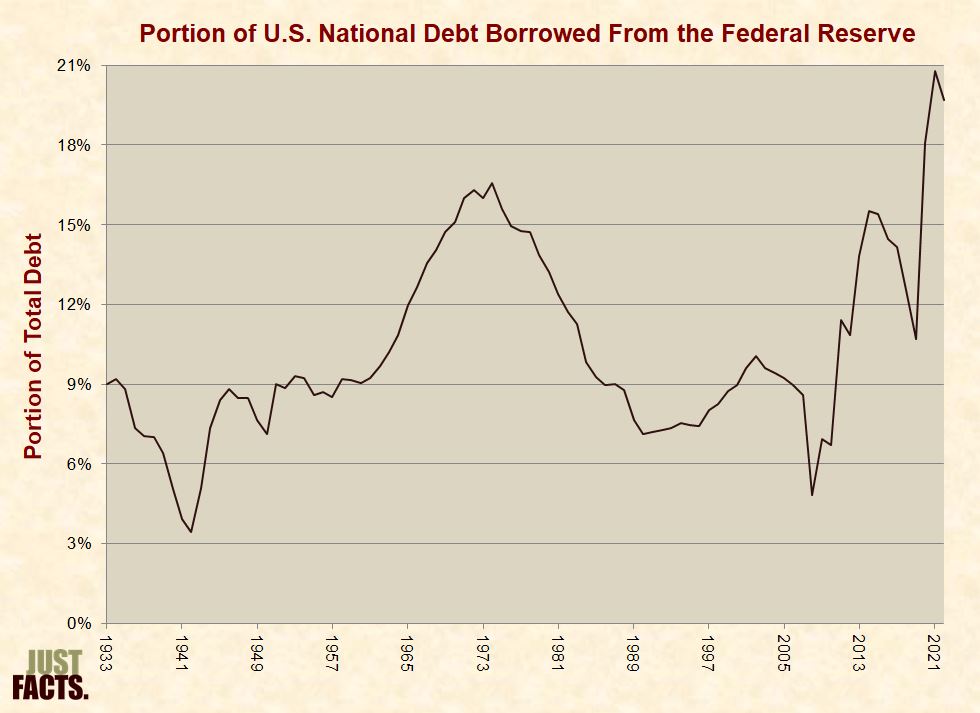
* Recent increases in the amount of debt borrowed from the Federal Reserve are largely due to a policy called quantitative easing.
* At the close of the federal government’s 2022 fiscal year, the $30.9 trillion national debt was comprised of:
|
Amount (Trillions) |
Type |
Portion of Total |
|
$24.3 |
79% |
|
|
$6.6 |
21% |
* At the close of the federal government’s 2022 fiscal year, the publicly held portion of the national debt was $24.3 trillion, and the owners of this debt were:
|
Owner |
Amount (Billions) |
Portion of Publicly Held |
|
Domestic Non-Federal Entities |
$11,362 |
47% |
|
Mutual Funds |
$2,606 |
11% |
|
Banks & Savings Institutions |
$1,740 |
7% |
|
State & Local Governments |
$1,537 |
6% |
|
Private Pension Funds |
$750 |
3% |
|
Insurance Companies |
$372 |
2% |
|
State & Local Government Pension Funds |
$366 |
2% |
|
U.S. Savings Bond Holders |
$166 |
1% |
|
Other Investors |
$3,825 |
16% |
|
Foreign & International Entities |
$7,252 |
30% |
|
Japan |
$1,116 |
5% |
|
China |
$902 |
4% |
|
United Kingdom |
$665 |
3% |
|
Belgium |
$325 |
1% |
|
Cayman Islands |
$302 |
1% |
|
Luxembourg |
$300 |
1% |
|
Switzerland |
$273 |
1% |
|
Ireland |
$265 |
1% |
|
Brazil |
$222 |
1% |
|
Taiwan |
$215 |
1% |
|
Other Nations |
$2,666 |
11% |
|
Federal Reserve[381] |
$5,672 |
23% |
|
Total |
$24,299 |
100% |
* Per the White House Office of Management and Budget, “During most of American history, the Federal debt was held almost entirely by individuals and institutions within the United States,” but foreign and international ownership began to “grow significantly in the early 1970s,” “accelerated” in 1995 to 97, and grew thereafter.[383]
* At the close of the federal government’s 2022 fiscal year, foreign and international entities owned $7.3 trillion of the U.S. national debt, and the owners of this debt were:
|
Owner |
Amount (Billions) |
Portion of Foreign |
|
Japan |
$1,116 |
15% |
|
China |
$902 |
12% |
|
United Kingdom |
$665 |
9% |
|
Belgium |
$325 |
4% |
|
Cayman Islands |
$302 |
4% |
|
Luxembourg |
$300 |
4% |
|
Switzerland |
$273 |
4% |
|
Ireland |
$265 |
4% |
|
Brazil |
$222 |
3% |
|
Taiwan |
$215 |
3% |
|
Other Nations |
$2,666 |
37% |
|
Total |
$7,252 |
100% |
* Foreign purchases of U.S. government debt increase the demand for this debt, thus putting downward pressure on U.S. interest rates. Conversely, foreign sales of U.S. government debt place upward pressure on U.S. interest rates.[385] [386]
* Per a 2008 Congressional Research Service report, a “potentially serious short-term problem would emerge if China decided to suddenly” sell its holding of U.S. government debt. Possible effects could include:
* The same report states:
* During a visit to China in February 2009, Secretary of State Hillary Clinton said:
* In August 2007 during a currency dispute between the U.S. and China, two leading officials of Chinese Communist Party bodies suggested that China use the threat of selling U.S. debt as a “bargaining chip.”[390]
* In February 2009 during a dispute over U.S. arms sales to Taiwan, a Chinese general made the following statements in the state-run magazine Outlook Weekly:
* One month later while appearing before China’s parliament, the head of China’s State Administration of Foreign Exchange said:
* At the close of the federal government’s 2022 fiscal year, the intragovernmental portion of the national debt was $6.6 trillion, and this debt was owned by the following federal trust funds and special funds:
|
Owner |
Amount (Billions) |
Portion of Intragovernmental |
|
Social Security |
$2,838 |
43% |
|
Military Retirement |
$1,195 |
18% |
|
Civil Service Retirement and Disability |
$1,007 |
15% |
|
Medicare |
$345 |
5% |
|
Department of Defense Retiree Healthcare |
$322 |
5% |
|
Deposit Insurance |
$125 |
2% |
|
Nuclear Waste Disposal Fund |
$57 |
1% |
|
Unemployment Insurance |
$74 |
1% |
|
Other Funds |
$667 |
10% |
|
Total |
$6,630 |
100% |
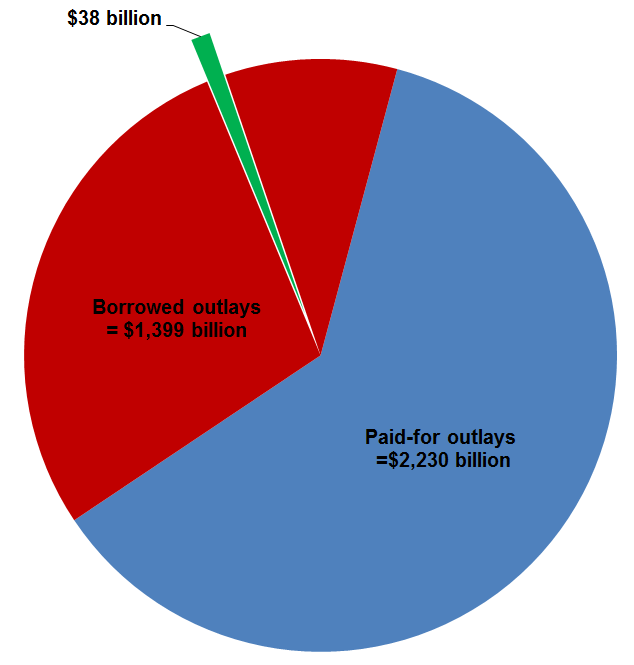
* In April 2011, journalists reported on a $38 billion federal budget cut agreement with the following headlines and verbiage:
* None of the articles above reported that this $38 billion in cuts was primarily from a portion of the budget called “discretionary non-emergency appropriations.”[397] Relative to the entire federal budget, this cut left a projected spending increase of $135 billion from 2010 to 2011. This equates to an inflation-adjusted increase of $49 billion or 0.1 percentage points of the U.S. economy:

* None of the articles above contained a budget-wide frame of reference for the cuts. A spending reduction of $38 billion was 1.0% of the estimated 2011 budget or 2.7% of the deficit:
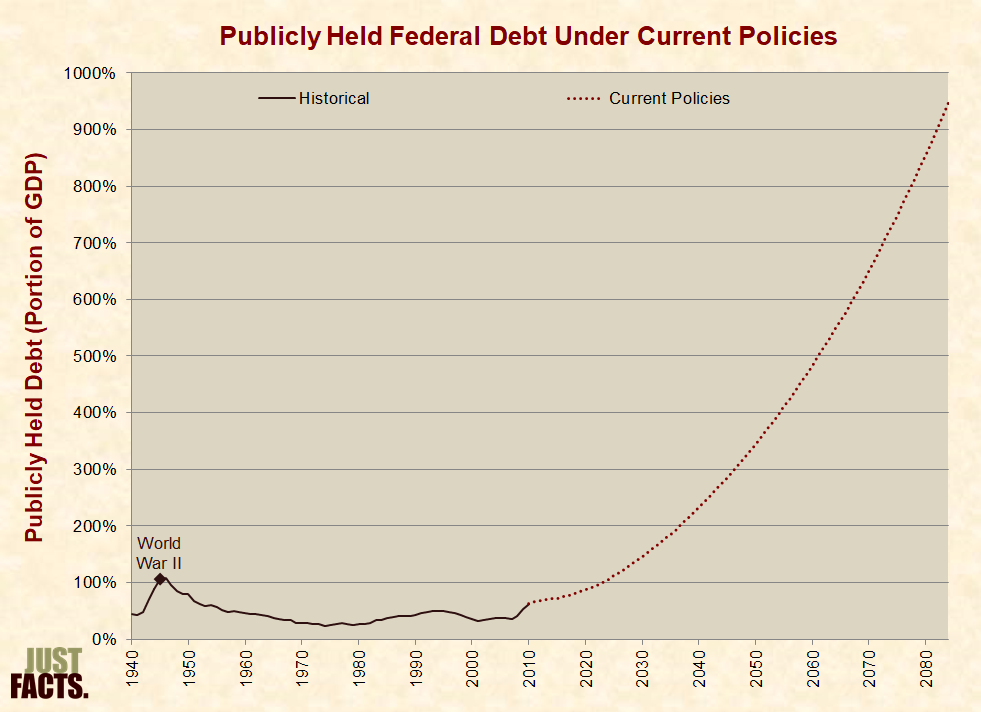
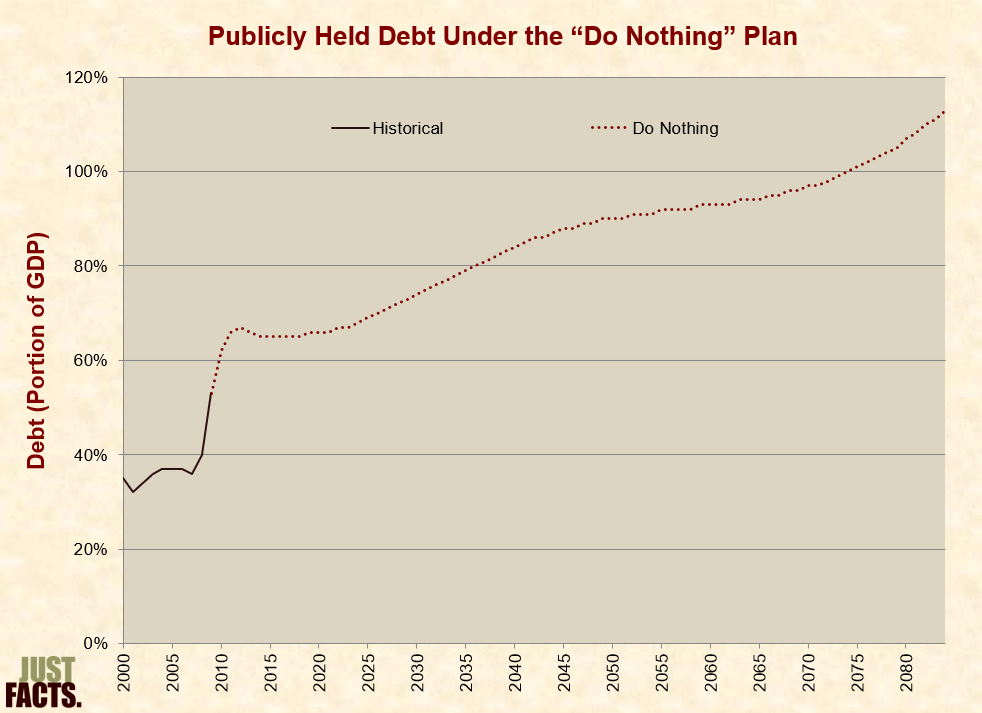
* In a 2011 budget analysis published by the Washington Post, Ezra Klein posted a chart of federal spending and revenue projections based on the Congressional Budget Office’s “current law” scenario and wrote that it:
* Klein called this is a “pretty good plan” without revealing that it does not account for interest on the national debt.[402] Under this plan and accounting for this interest, the Congressional Budget Office projected that the publicly held national debt would increase from 62% of the U.S. economy in 2010 to 113% in 2084:
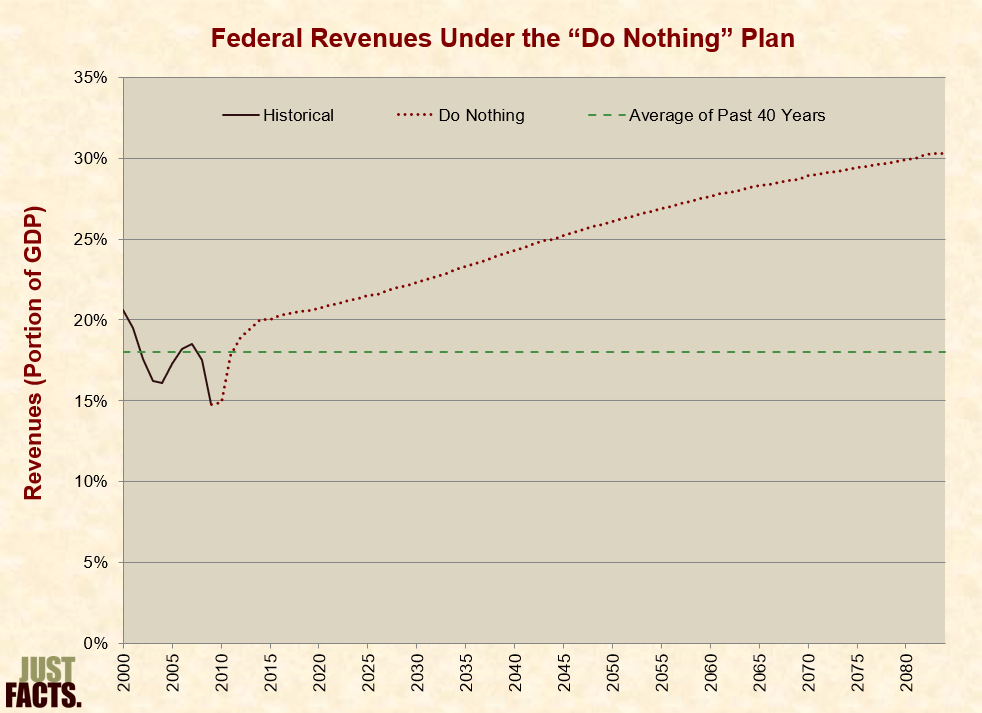
* In the same analysis, Klein claimed that this “do nothing” plan contains “a balanced mix of revenues” and “program cuts” without revealing that under it:[405]
* In February 2010, Fareed Zakaria of CNN stated:
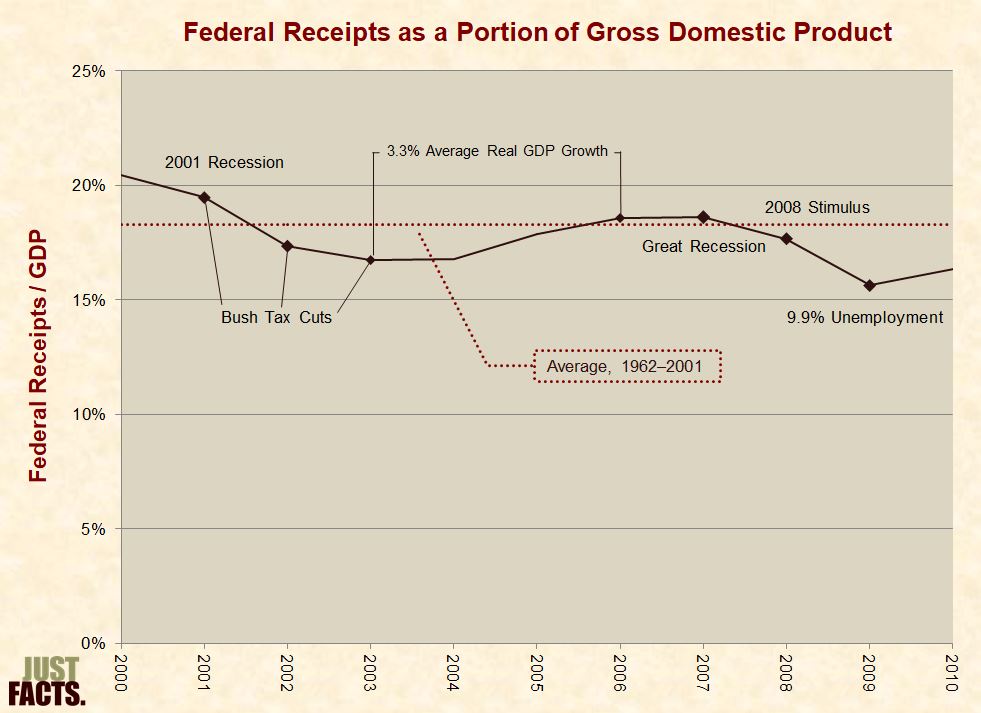
* In 2010, the Bush tax cuts lowered federal revenues by about $283 billion, according to the Congressional Budget Office. This figure of $283 billion:
* President George W. Bush entered office in January of 2001,[415] and he signed tax cuts into law in 2001, 2002, and 2003.[416] [417] In addition to these tax cuts, federal revenues were impacted by factors such as:
* From 2000 to 2010, federal revenues (as a portion of the U.S. economy or gross domestic product) varied as follows:
* Without mentioning the role of Congress in taxes, spending, or the national debt,[428] [429] PolitiFact reported in 2009 that the national debt increased by $5 trillion “under” George W. Bush, while “there were several years of budget surpluses” at “the end of the Clinton administration.”[430]
* During the tenures of recent presidents and congressional majorities, the average annual changes in national debt (measured in percentage points of GDP) varied as follows:
|
Political Power |
Dates |
Average Annual Debt/GDP Change |
|
Bill Clinton with Democratic House and Senate |
1/20/93–1/4/95 |
0.8 |
|
Bill Clinton with Republican House and Senate |
1/4/95–1/19/01 |
–1.5 |
|
George W. Bush with Republican House and Senate |
1/19/01–6/6/01, 11/12/02–1/4/07 |
0.7 |
|
George W. Bush with Republican House and Democratic Senate |
6/6/01–11/12/02 |
2.2 |
|
George W. Bush with Democratic House and Senate |
1/4/07–1/20/09 |
6.2 |
|
Barack Obama with Democratic House and Senate |
1/20/09–1/5/11 |
9.0 |
|
Barack Obama with Republican House and Democratic Senate |
1/5/11–1/6/15 |
2.3 |
|
Barack Obama with Republican House and Senate |
1/6/15–1/20/17 |
1.7 |
|
Donald Trump with Republican House and Senate |
1/20/17–1/3/19 |
0.1 |
|
Donald Trump with Democratic House and Republican Senate |
1/3/19–1/20/21 |
9.8 |
|
Joseph Biden with Democratic House and Democratic Senate |
1/20/21 – 1/3/23 |
–1.3 |
* Other factors impacting the debt/GDP ratio include but are not limited to high inflation,[432] [433] legislation passed by previous Congresses and presidents,[434] economic cycles, terrorist attacks, pandemics, state government lockdowns, natural disasters, demographics, and the actions of U.S. citizens and foreign governments.[435] [436] [437]
[1] Report: “United States Federal Debt: Answers To Frequently Asked Questions, An Update.” U.S. Government Accountability Office, August 12, 2004. <www.gao.gov>
Page 7:
The amount of any borrower’s debt by itself is not a good indicator of the burden imposed by that debt. A borrower’s income and wealth are important in assessing the burden of debt. Therefore, to get a sense of the burden represented by the federal debt, that debt is often measured in relation to the nation’s income. Gross domestic product (GDP) is a commonly used measure of domestic national income. GDP is the value of all goods and services produced within the United States in a given year and is conceptually equivalent to incomes earned in production. It is a rough indicator of the economic earnings base from which the government draws its revenues. Thus, the ratio of debt held by the public as a share of GDP is a good measure of the burden on the current economy.
[2] Report: “Common Budgetary Terms Explained.” Congressional Budget Office, December 2021. <www.cbo.gov>
“To make comparisons of deficits and federal debt over time, CBO typically measures them as a percentage of gross domestic product (or GDP)—the total market value of all goods and services produced domestically in a given period.”
[3] Article: “Jargon Alert: National Debt.” By David Van Den Berg. Federal Reserve Bank of Richmond Region Focus, Winter 2009. Page 10. <www.richmondfed.org>
“The national debt figures are typically measured as a percentage of gross domestic product (GDP), the primary measure of the nation’s economic activity.”
[4] Report: “Government and Public Sector Debt Measures.” United Kingdom Office for National Statistics, September 2006. <www.ons.gov.uk>
Page 2: “Debt measures are usually presented as a percentage of GDP since comparisons over time need to allow for effects such as inflation. Dividing by GDP is the conventional way of doing this.”
[5] Article: “Government Finance Statistics.” European Union, Eurostat. Accessed May 28, 2020 at <ec.europa.eu>
Introduction
Government finance statistics contain crucial indicators for determining the health of the economies of the EU [European Union] Member States. Under the terms of the EU’s Stability and Growth Pact (SGP), Member States pledged to keep their deficits and debt below certain limits: a Member State’s government deficit may not exceed 3% of its gross domestic product (GDP), while its debt may not exceed 60% of GDP. If a Member State does not respect these limits, the so-called excessive deficit procedure (EDP) is triggered This entails several steps—including the possibility of sanctions—to encourage the Member State concerned to take appropriate measures to rectify the situation. The same deficit and debt limits are also criteria for economic and monetary union (EMU) and hence for joining the euro.
[6] Book: This Time is Different: Eight Centuries of Financial Folly. By Carmen M. Reinhart (University of Maryland) and Kenneth S. Rogoff (Harvard University). Princeton University Press, 2009.
Page 65: “Governments can also default on domestic public debt through high and unanticipated inflation, as the United States and many European countries famously did in the 1970s.”
Page 175:
[I]nflation has long been the weapon of choice in sovereign defaults on domestic debt and, where possible, on international debt. … [G]overnments engage in massive monetary expansion, in part because they can thereby gain a seigniorage tax on real money balances (by inflating down the value of citizens’ currency and issuing more to meet demand). But they also want to reduce, or even wipe out, the real value of public debts outstanding.
Page 400: “Seigniorage is simply the real income a government can realize by exercising its monopoly on printing currency. The revenue can be broken down into the quantity of currency needed to meet the growing transactions demand at constant prices and the remaining growth, which causes inflation, thereby lowering the purchasing power of existing currency.”
[7] Article: “Inflation and the Real Value of Debt: A Double-Edged Sword.” By Christopher J. Neely. Federal Reserve Bank of St. Louis, On the Economy, August 1, 2022. <www.stlouisfed.org>
An increase in the price level directly reduces the real value of government debt, as well as the ratio of debt to GDP [gross domestic product], because—holding other things constant—higher prices increase nominal GDP. Thus, surprise inflation transfers wealth from holders of U.S. government debt—who include both Americans and non-Americans—to U.S. taxpayers.3
This transfer is not an unalloyed good even for U.S. taxpayers, however, because unexpected inflation will tend to raise the cost of servicing future U.S. debt—i.e., nominal yields—by increasing the expected rate of inflation and the risk premium associated with inflation.
[8] Book: Is U.S. Government Debt Different? Edited by Franklin Allen and others. Penn Law, Wharton, FIC Press, 2012. <finance.wharton.upenn.edu>
Chapter 5: “Origins of the Fiscal Constitution.” By Michael W. McConnell (Director of the Constitutional Law Center at Stanford Law School). Pages 45–53.
Pages 49–50:
Section Four of the Amendment states: “The validity of the public debt of the United States, authorized by law, including debts incurred for payment of pensions and bounties for services in suppressing insurrection or rebellion, shall not be questioned.” This was designed to prevent a southern Democratic majority from repudiating the Civil War debt. … The Supreme Court has interpreted the provision only once, in Perry v. United States2, the so-called Gold Clause Cases. The Court allowed Congress to renege on its contractual agreement to pay the debt in gold; this is when U.S. public debt became denominated in dollars. Effectively, this means that even if Section Four forbids Congress to declare a formal default, it could accomplish much the same thing by inflating the debt away.
[9] Webpage: “Debt to the Penny.” U.S. Department of the Treasury, Bureau of the Fiscal Service. Accessed April 3, 2024 at <fiscaldata.treasury.gov>
“4/1/2024 … Total Public Debt Outstanding [=] $34,627,201,333,064”
[10] Calculated with data from the webpage: “U.S. and World Population Clock.” U.S. Census Bureau, April 3, 2024. <www.census.gov>
“The United States population on April 1, 2024 was: 336,238,570”
CALCULATION: $34,627,201,333,064 debt / 336,238,570 people = $102,984 debt/person
[11] Calculated with the dataset: “Average Number of People per Household, by Race and Hispanic Origin, Marital Status, Age, and Education of Householder: 2023.” U.S. Census Bureau, November 2023. <www2.census.gov>
“Total households [=] 131,434,000”
CALCULATION: $34,627,201,333,064 debt / 131,434,000 households = $261,677 debt/household
[12] Report: “Financial Accounts of the United States: Flow of Funds, Balance Sheets, and Integrated Macroeconomic Accounts, Fourth Quarter 2023.” Board of Governors of the Federal Reserve System, March 7, 2024. <www.federalreserve.gov>
Page 7: “D.3 Debt Outstanding by Sector … Billions of dollars; quarterly figures are seasonally adjusted … Households … Total … 2023Q4 [=] 19,955.2”
CALCULATION: ($34,627,201,333,064 national debt – $19,955,200,000,000 consumer debt) / $19,955,200,000,000 consumer debt = 74%
[13] Calculated with the dataset: “Table 3.2. Federal Government Current Receipts and Expenditures [Billions of Dollars], Seasonally Adjusted at Annual Rates.” U.S. Department of Commerce, Bureau of Economic Analysis. Last revised March 28, 2024. <apps.bea.gov>
|
Total Receipts |
|||
|
2023Q1 |
2023Q2 |
2023Q3 |
2023Q4 |
|
4,651.1 |
4,711.6 |
4,765.4 |
4,864.1 |
CALCULATION: $34,627,201,333,064 debt / (((4,651.1 + 4,711.6 + 4,765.4 + 4,864.1) / 4) × $1,000,000,000 receipts) = 7.3
[14] Calculated with the dataset: “Table 1.1.5. Gross Domestic Product [Billions of Dollars], Seasonally Adjusted at Annual Rates.” U.S. Department of Commerce, Bureau of Economic Analysis. Last revised March 28, 2024. <apps.bea.gov>
|
Gross Domestic Product |
|||
|
2023Q1 |
2023Q2 |
2023Q3 |
2023Q4 |
|
26,813.6 |
27,063.0 |
27,610.1 |
27,957.0 |
CALCULATION: $34,627,201,333,064 debt / (((26,813.6 + 27,063.0 + 27,610.1 + 27,957.0) / 4) × $1,000,000,000 GDP) = 127%
[15] Report: “Budget of the U.S. Government: Fiscal Year 2023.” White House, Office of Management and Budget, March 28, 2022. <www.whitehouse.gov>
Pages 142–143:
Table S–10. Federal Government Financing and Debt (Dollar amounts in billions) …
Debt Outstanding, End of Year …
Total, gross Federal debt … Actual 2021 [=] 28,386 …
As a percent of GDP Actual 2021 [=] 127.0%
[16] Report: “Budget of the U.S. Government: Fiscal Year 2024.” White House, Office of Management and Budget, March 9, 2023. <www.whitehouse.gov>
Pages 168–169:
Table S–10. Federal Government Financing and Debt (Dollar amounts in billions) …
Debt Outstanding, End of Year …
Total, gross Federal debt … Actual 2022 [=] 30,839 …
As a percent of GDP Actual 2022 [=] 123.4%
[17] Blog post: “CBO Releases July 2022 Long-Term Budget Outlook.” Committee for a Responsible Federal Budget, July 27, 2022. <www.crfb.org>
“After rising from 79 percent of Gross Domestic Product (GDP) at the end of Fiscal Year (FY) 2019 to 98 percent of GDP by the end of 2022, CBO projects debt will rise further to 185 percent of GDP by 2052 under current law.”
[18] Commentary: “Spendaholic Politicians Are Destroying Your Economic Future.” By Betsy McCaughey. Creators, January 25, 2023. <www.creators.com>
“The national debt is at the highest level since WWII, and is forecast to break that record soon. In 2022, it hit 98% of GDP—everything we all produce going to work every day—and is growing rapidly.”
[19] Commentary: “Trillions in Debt Reflect a Nation That Has Lost Its Way.” By Star Parker. WND, January 24, 2023. <www.wnd.com>
“How can it be that our national publicly held debt is equal to our entire $25.5 trillion economy? And where were we all when this happened? As recently as 2008, debt was 39.2%, rather than 100%, of our GDP.”
[20] As documented in the three footnotes below from the U.S. Government Accountability Office and the White House Office of Management & Budget:
[21] Report: “United States Federal Debt: Answers To Frequently Asked Questions, An Update.” U.S. Government Accountability Office, August 12, 2004. <www.gao.gov>
Page 1: “Debt held by the public plus debt held by government accounts represent total debt, or gross federal debt.”
Pages 10–11:
Debt held by the public approximates current federal demand on credit markets. It represents a burden on today’s economy, and the interest paid on this debt represents a burden on current taxpayers. …
However, debt held by government accounts reflects a future burden on taxpayers and the economy. The special federal securities held in the accounts represent legal obligations of the Treasury and are guaranteed for principal and interest by the full faith and credit of the U.S. government.
[22] Report: “Budget of the U.S. Government: Fiscal Year 2023.” White House, Office of Management and Budget, March 28, 2022. <www.whitehouse.gov>
Pages 142–143:
Table S–10. Federal Government Financing and Debt (Dollar amounts in billions) …
Debt Outstanding, End of Year …
Total, gross Federal debt … Actual 2021 [=] 28,386 …
As a percent of GDP Actual 2021 [=] 127.0% …
Debt held by Government accounts … Actual 2021 [=] 6,102 …
Debt held by the public … Actual 2021 [=] 22,284 …
As a percent of GDP Actual 2021 [=] 99.7%
[23] Report: “Budget of the U.S. Government: Fiscal Year 2024.” White House, Office of Management and Budget, March 9, 2023. <www.whitehouse.gov>
Pages 168–169:
Table S–10. Federal Government Financing and Debt (Dollar amounts in billions) …
Debt Outstanding, End of Year …
Total, gross Federal debt … Actual 2022 [=] 30,839 …
As a percent of GDP Actual 2022 [=] 123.4% …
Debt held by Government accounts … Actual 2022 [=] 6,586 …
Debt held by the public … Actual 2022 [=] 24,252 …
As a percent of GDP Actual 2022 [=] 97%
[24] Calculated with data from:
a) Dataset: “Historical Debt Outstanding—Annual, 1790–1849.” United States Department of the Treasury, Bureau of the Public Debt. Updated May 5, 2013. <www.justfacts.com>
b) Dataset: “Historical Debt Outstanding—Annual, 1850–1899.” United States Department of the Treasury, Bureau of the Public Debt. Updated May 5, 2013. <www.justfacts.com>
c) Dataset: “Historical Debt Outstanding—Annual, 1900–1949.” United States Department of the Treasury, Bureau of the Public Debt. Updated May 5, 2013. <www.justfacts.com>
d) Dataset: “Historical Debt Outstanding—Annual, 1950–1999.” United States Department of the Treasury, Bureau of the Public Debt. Updated May 5, 2013. <www.justfacts.com>
e) Webpage: “Debt to the Penny.” U.S. Department of the Treasury, Bureau of the Fiscal Service. Accessed March 3, 2023 at <fiscaldata.treasury.gov>
f) Dataset: “Historical Data on the Federal Debt.” Congressional Budget Office, August 5, 2010. <www.cbo.gov>
g) Dataset: “Table 1.1.5. Gross Domestic Product [Billions of Dollars].” United States Department of Commerce, Bureau of Economic Analysis. Last revised February 28, 2024. <apps.bea.gov>
NOTE: An Excel file containing the data and calculations is available upon request.
[25] “WHO Director-General’s Opening Remarks at the Media Briefing on Covid-19.” World Health Organization, March 11, 2020. <bit.ly>
[Dr. Tedros Adhanom Ghebreyesus:] …
WHO has been assessing this outbreak around the clock and we are deeply concerned both by the alarming levels of spread and severity, and by the alarming levels of inaction.
We have therefore made the assessment that COVID-19 can be characterized as a pandemic.
[26] Calculated with data from:
a) Dataset: “Historical Debt Outstanding—Annual, 1790–1849.” United States Department of the Treasury, Bureau of the Public Debt. Updated May 5, 2013. <www.justfacts.com>
b) Dataset: “Historical Debt Outstanding—Annual, 1850–1899.” United States Department of the Treasury, Bureau of the Public Debt. Updated May 5, 2013. <www.justfacts.com>
c) Dataset: “Historical Debt Outstanding—Annual, 1900–1949.” United States Department of the Treasury, Bureau of the Public Debt. Updated May 5, 2013. <www.justfacts.com>
d) Dataset: “Historical Debt Outstanding—Annual, 1950–1999.” United States Department of the Treasury, Bureau of the Public Debt. Updated May 5, 2013. <www.justfacts.com>
e) Webpage: “Debt to the Penny.” U.S. Department of the Treasury, Bureau of the Fiscal Service. Accessed March 2, 2023 at <fiscaldata.treasury.gov>
f) Dataset: “Historical Data on the Federal Debt.” Congressional Budget Office, August 5, 2010. <www.cbo.gov>
g) Dataset: “Table 1.1.5. Gross Domestic Product [Billions of Dollars].” United States Department of Commerce, Bureau of Economic Analysis. Last revised February 28, 2024. <apps.bea.gov>
NOTES: An Excel file containing the data and calculations is available upon request.
[27] Article: “World War II.” Encyclopædia Britannica Ultimate Reference Suite 2004.
[It was] also called Second World War, a conflict that involved virtually every part of the world during the years 1939–45. The principal belligerents were the Axis powers—Germany, Italy, and Japan—and the Allies—France, Great Britain, the United States, the Soviet Union, and, to a lesser extent, China. The war was in many respects a continuation, after an uneasy 20-year hiatus, of the disputes left unsettled by World War I. The 40,000,000–50,000,000 deaths incurred in World War II make it the bloodiest conflict as well as the largest war in history.
[28] Calculated with data from:
a) Dataset: “Historical Debt Outstanding—Annual, 1790–1849.” United States Department of the Treasury, Bureau of the Public Debt. Updated May 5, 2013. <www.justfacts.com>
b) Dataset: “Historical Debt Outstanding—Annual, 1850–1899.” United States Department of the Treasury, Bureau of the Public Debt. Updated May 5, 2013. <www.justfacts.com>
c) Dataset: “Historical Debt Outstanding—Annual, 1900–1949.” United States Department of the Treasury, Bureau of the Public Debt. Updated May 5, 2013. <www.justfacts.com>
d) Dataset: “Historical Debt Outstanding—Annual, 1950–1999.” United States Department of the Treasury, Bureau of the Public Debt. Updated May 5, 2013. <www.justfacts.com>
e) Webpage: “Debt to the Penny.” U.S. Department of the Treasury, Bureau of the Fiscal Service. Accessed March 2, 2023 at <fiscaldata.treasury.gov>
f) Dataset: “Historical Data on the Federal Debt.” Congressional Budget Office, August 5, 2010. <www.cbo.gov>
g) Dataset: “Table 1.1.5. Gross Domestic Product [Billions of Dollars].” United States Department of Commerce, Bureau of Economic Analysis. Last revised January 26, 2023. <apps.bea.gov>
NOTE: An Excel file containing the data and calculations is available upon request.
[29] Webpage: “About GAO.” U.S. Government Accountability Office. Accessed July 2, 2020 at <www.gao.gov>
The U.S. Government Accountability Office (GAO) is an independent, nonpartisan agency that works for Congress. Often called the “congressional watchdog,” GAO examines how taxpayer dollars are spent and provides Congress and federal agencies with objective, reliable information to help the government save money and work more efficiently.
[30] Report: “United States Federal Debt: Answers To Frequently Asked Questions, An Update.” U.S. Government Accountability Office, August 12, 2004. <www.gao.gov>
Pages 65–67:
Debt held by the public is the largest explicit liability of the federal government. However, the federal government undertakes a wide range of programs, responsibilities, and activities that may explicitly or implicitly expose it to future spending. These “fiscal exposures”2 vary widely as to source, extent of the government’s legal obligation, likelihood of occurrence, and magnitude. Given this variety, it is useful to think of fiscal exposures as a spectrum extending from explicit liabilities to the implicit promises embedded in current policy or public expectations. (See table 2.) For example, the current liability figures for the U.S. government do not include the difference between scheduled and funded benefits in connection with the Social Security and Medicare programs.
Fiscal exposures represent significant commitments that ultimately have to be addressed. The burden of paying for these exposures may encumber future budgets and constrain fiscal flexibility. Not capturing the long-term costs of current decisions limits policymakers’ ability to control the government’s fiscal exposures at the time decisions are made. In addition, the lack of recognition of long-term fiscal exposures may make it difficult for policymakers and the public to adequately understand the government’s overall performance and true financial condition.
[31] Report: “Federal Insurance and Other Activities that Transfer Risk or Losses to the Government.” U.S. Government Accountability Office, March 2019. <www.gao.gov>
Page 2 (of PDF):
Through analysis of sources containing government-wide information on federal activities, GAO [U.S. Government Accountability Office] identified 148 federal insurance and other activities that transfer risk or losses from adverse events to the government…. Unlike private insurance, the activities do not necessarily have a contract or charge premiums or fees in exchange for assuming risk. Even when premiums or fees exist they may not cover all costs, as federal expenditures can be driven by policy goals or agency missions rather than the aim of fiscal solvency. …
The government’s primarily cash-based budget generally does not record the full cost of commitments incurred until corresponding payments are made in the future. Therefore, the budget may not accurately reflect federal costs or the likely claim on federal resources for such activities. For some claims, such as pension and life insurance, the federal commitment occurs years before payments are reflected in the budget. Additionally, payments the government may be expected to make based on policies or past practices (but is not legally required to make) may not be evident in the budget. … GAO previously recommended … that Congress consider expanding the use of accrual-based information in the budget documents submitted to Congress. However, this recommendation has not been implemented. Accrual measurement would provide enhanced control over future spending by recognizing long-term costs when decisions are made.
Page 39:
The government undertakes a wide range of activities that create fiscal exposures by obligating the government to future spending or creating an expectation for such spending. The federal budget both allocates and controls resources, but does not provide complete information about some significant fiscal exposures. Failure to understand and address these exposures can have significant consequences. These fiscal exposures will require future federal spending and will absorb resources available for other activities. Not capturing the long-term costs of current decisions limits Congress’s ability to control federal fiscal exposures at the time decisions are made. Presenting accrual information alongside cash-based budget numbers, particularly in areas where it would enhance up-front control of budgetary resources, would be useful to policymakers when debating current activities and considering new legislation.
[32] Report: “Enron: Selected Securities, Accounting, and Pension Laws Possibly Implicated in its Collapse.” By Michael V. Seitzinger, Marie B. Morris, and Mark Jickling. Congressional Research Service, Library of Congress, January 16, 2002. <www.justfacts.com>
Page 2:
Among the disclosures of publicly traded companies are accounting statements. Since financial information is of little use to investors unless all firms use comparable accounting methods, the securities laws give the Securities and Exchange Commission broad authority to establish standards for financial reporting. The SEC [U.S. Securities and Exchange Commission] has delegated the task of writing accounting standards to private sector bodies, and since 1973 the Financial Accounting Standards Board has been charged with formulating accounting and financial reporting standards.
[33] Summary of Statement No. 106: “Employers’ Accounting for Postretirement Benefits Other Than Pensions.” Financial Accounting Standards Board, December 1990. <bit.ly>
This Statement establishes accounting standards for employers’ accounting for postretirement benefits other than pensions…. It will significantly change the prevalent current practice of accounting for postretirement benefits on a pay-as-you-go (cash) basis by requiring accrual, during the years that the employee renders the necessary service, of the expected cost of providing those benefits to an employee and the employee’s beneficiaries and covered dependents. …
… The Board believes that measurement of the obligation and accrual of the cost based on best estimates are superior to implying, by a failure to accrue, that no obligation exists prior to the payment of benefits. The Board believes that failure to recognize an obligation prior to its payment impairs the usefulness and integrity of the employer’s financial statements. …
The provisions of this Statement are similar, in many respects, to those in FASB [Financial Accounting Standards Board] Statements No. 87, Employers’ Accounting for Pensions, and No. 88, Employers’ Accounting for Settlements and Curtailments of Defined Benefit Pension Plans and for Termination Benefits. …
This Statement relies on a basic premise of generally accepted accounting principles that accrual accounting provides more relevant and useful information than does cash basis accounting. …
[L]ike accounting for other deferred compensation agreements, accounting for postretirement benefits should reflect the explicit or implicit contract between the employer and its employees.
[34] Book: Finance for Managers. By Richard Luecke and Samuel L. Hayes. Harvard Business School Press, 2002.
Page 39:
In contrast to cash-basis accounting, accrual accounting records transactions as they are made, whether or not the cash has actually changed hands. Most companies of any size use accrual accounting. This system provides a better matching between revenues and their associated cost, which helps companies understand the true causes and effect of business activities. Accordingly, revenues are recognized during the period in which the sales activities occur, whereas expenses are recognized in the same period as their associated revenues.
[35] Report: “Understanding the Primary Components of the Annual Financial Report of the United States Government.” U.S. Government Accountability Office, September, 2005. <www.gao.gov>
Page 5:
Accrual accounting, which is also used by private business enterprises, is the basis for U.S. generally accepted accounting principles for federal government entities. It is intended to provide a complete picture of the federal government’s financial operations and financial position. The federal government primarily uses the cash basis of accounting for its budget, which is the federal government’s primary financial planning and control tool.
Page 6:
The accrual basis of accounting recognizes revenue when it is earned and recognizes expenses in the period incurred, without regard to when cash is received or disbursed. The federal government, which receives most of its revenue from taxes, nevertheless recognizes tax revenue when it is collected, under an accepted modified cash basis of accounting.
[36] Calculated with data from: “Fiscal Year 2022 Financial Report of the United States Government.” U.S. Department of the Treasury, February 16, 2023. <fiscal.treasury.gov>
Page 65:
United States Government Balance Sheets as of September 30, 2022, and 2021
|
Liabilities |
2022 (billions $) |
|
Accounts payable |
114.6 |
|
Federal employee and veteran benefits payable |
12,811.9 |
|
Environmental and disposal liabilities |
626.3 |
|
Benefits due and payable |
288.3 |
|
Loan guarantee liabilities |
6.4 |
|
Insurance and guarantee program liabilities |
104.5 |
|
Advances from others and deferred revenues |
247.2 |
|
Other liabilities |
495.1 |
|
Total of above (excludes publicly held federal debt) |
14,694 |
[37] The following points provide important context for understanding the data and calculation in the next footnote:
[38] Calculated with data from the “2022 Annual Report of the Board of Trustees of the Federal Old-Age and Survivors Insurance and Disability Insurance Trust Funds.” United States Social Security Administration, June 7, 2022. <www.ssa.gov>
Page 7: “Table II.B1.—Summary of 2021 Trust Fund Financial Operations [In billions]. … OASDI [Social Security] … Asset reserves at the end of 2021 … $2,852.0”
Page 209:
Table VI.F2.—Present Values Through the Infinite Horizon for Various Categories of Program Participants, Based on Intermediate Assumptions [Present values as of January 1, 2022; dollar amounts in trillions] …
present value of future cost for current participants [=] $91.0 …
present value of future dedicated tax income for current participants [=] $42.4 …
present value of future General Fund reimbursements through the infinite horizon a [=] d …
a Distribution of General Fund reimbursements among past, current, and future participants cannot be determined.
d Less than $50 billion
CALCULATION:
$91.0 trillion present value of future cost for current participants
– $42.4 trillion present value of future dedicated tax income for current participants
– $0.05 trillion present value of future general fund reimbursements over the infinite horizon
– $2.852 trillion current value of the trust fund
= $45.698 trillion closed group unfunded obligation
[39] A very common but false belief is that the Social Security program has been looted. For facts about this myth, visit Just Facts’ research on Social Security.
[40] The following points provide important context for understanding the data and calculation in the next footnote:
[41] Calculated with data from the “2022 Annual Report of the Board of Trustees of the Federal Hospital Insurance and Federal Supplementary Medical Insurance Trust Funds.” United States Department of Health and Human Services, Centers for Medicare and Medicaid Services, June 2, 2022. <www.cms.gov>
Page 12: “Table II.B1.—Medicare Data for Calendar Year 2021 … Assets at end of 2020 (billions) … Total [=] $277.4”
Page 212:
The first line of table V.G2 [which displays unfunded Part A obligations] shows the present value of future expenditures less future taxes for current participants, including both beneficiaries and covered workers [i.e., taxpayers]. Subtracting the current value of the HI [Hospital Insurance or Part A] trust fund (the accumulated value of past HI taxes less outlays) results in a closed-group unfunded obligation of $14.5 trillion.
Page 215: “Table V.G4.—Unfunded Part B Obligations for Current and Future Program Participants through the Infinite Horizon [Present values as of January 1, 2022; dollar amounts in trillions] … Equals unfunded obligations for past and current participants1 … General revenue contributions [=] $32.2”
Page 217: “Table V.G6.—Unfunded Part D Obligations for Current and Future Program Participants through the Infinite Horizon [Present values as of January 1, 2022; dollar amounts in trillions] … Equals unfunded obligations for past and current participants1 … General revenue contributions [=] $5.9”
CALCULATION: $14.5 trillion in closed-group unfunded obligations for Medicare Part A + $32.2 trillion in closed-group unfunded obligations for Part B + $5.9 trillion in closed-group unfunded obligations for Part D = $52.6 trillion in closed-group unfunded obligations for the Medicare program
[42] See here, here, and here for documentation that publicly traded companies are required by law to calculate their debt and obligations using accrual accounting. The next three footnotes document that:
The Treasury’s annual Financial Report of the United States Government was originally the source for all of the above-cited federal liabilities and obligations. However, in 2009, the Treasury stopped publishing individual closed-group obligations for Social Security and Medicare. Since then, the report has only shown the combined total of closed-group obligations for all social insurance programs. For the 2009 and 2010 reports, Just Facts requested and received the components of this total from the Treasury. For the 2011 report, the Treasury did not provide these figures despite repeated requests. Thus, Just Facts now calculates these figures using data from the Social Security and Medicare Trustees Reports. This methodology is detailed in the four footnotes above and produces results that are consistent with the individual data released by the Treasury in earlier reports.
[43] Pages 16–17:
Each year, the Administration issues two reports that detail the government’s financial results: the [federal] Budget and this Financial Report. The exhibit on the following page provides the key characteristics and differences between the two documents.
Treasury generally prepares the financial statements in this Financial Report on an accrual basis of accounting as prescribed by GAAP [Generally Accepted Accounting Principles] for federal entities. …
Budget of the U.S. Government: Prepared primarily on a “cash basis” …
Financial Report of the U.S. Government: Prepared on an “accrual basis” and “modified cash basis”
[44] Report: “Federal Insurance and Other Activities that Transfer Risk or Losses to the Government.” U.S. Government Accountability Office, March 2019. <www.gao.gov>
Page 2 (of PDF):
The government’s primarily cash-based budget generally does not record the full cost of commitments incurred until corresponding payments are made in the future. Therefore, the budget may not accurately reflect federal costs or the likely claim on federal resources for such activities. For some claims, such as pension and life insurance, the federal commitment occurs years before payments are reflected in the budget. Additionally, payments the government may be expected to make based on policies or past practices (but is not legally required to make) may not be evident in the budget. … GAO [U.S. Government Accountability Office] previously recommended … that Congress consider expanding the use of accrual-based information in the budget documents submitted to Congress. However, this recommendation has not been implemented. Accrual measurement would provide enhanced control over future spending by recognizing long-term costs when decisions are made.
Page 39:
The government undertakes a wide range of activities that create fiscal exposures by obligating the government to future spending or creating an expectation for such spending. The federal budget both allocates and controls resources, but does not provide complete information about some significant fiscal exposures. Failure to understand and address these exposures can have significant consequences. These fiscal exposures will require future federal spending and will absorb resources available for other activities. Not capturing the long-term costs of current decisions limits Congress’s ability to control federal fiscal exposures at the time decisions are made. Presenting accrual information alongside cash-based budget numbers, particularly in areas where it would enhance up-front control of budgetary resources, would be useful to policymakers when debating current activities and considering new legislation.
[45] Report: “Understanding the Primary Components of the Annual Financial Report of the United States Government.” U.S. Government Accountability Office, September, 2005. <www.gao.gov>
Page 5:
Accrual accounting, which is also used by private business enterprises, is the basis for U.S. generally accepted accounting principles for federal government entities. It is intended to provide a complete picture of the federal government’s financial operations and financial position. The federal government primarily uses the cash basis of accounting for its budget, which is the federal government’s primary financial planning and control tool.
Page 6:
The accrual basis of accounting recognizes revenue when it is earned and recognizes expenses in the period incurred, without regard to when cash is received or disbursed. The federal government, which receives most of its revenue from taxes, nevertheless recognizes tax revenue when it is collected, under an accepted modified cash basis of accounting.
[46] Textbook: Fiscal Challenges: An Interdisciplinary Approach to Budget Policy. Edited by Elizabeth Garrett, Elizabeth A. Graddy, and Howell E. Jackson. Cambridge University Press, 2009.
Chapter 6: “Counting the Ways: The Structure of Federal Spending.” By Howell E. Jackson.
Page 207: “The measure featured here is the ‘closed-group liability’ for each program. This measure reflects the financial burden or liability being passed on to future generations.”
[47] “2010 Annual Report of the Board of Trustees of The Federal Old-Age and Survivors Insurance and Disability Insurance Trust Funds.” Board of Trustees of the Federal OASDI Trust Funds, August 9, 2010. <www.ssa.gov>
Page 65: “[The] closed group unfunded obligation … represents the shortfall of lifetime contributions for all past† and current participants relative to the cost of benefits for them.”
Page 209 [appendix]: “Closed group unfunded obligation. This measure is computed like the open group unfunded obligation except that individuals under the age of 15 (or not yet born) are excluded. In other words, only persons who attain age 15 or older during the first year of the projection period are included in the calculations.”
NOTES:
[48] “2009 Financial Report of the United States Government.” U.S. Department of the Treasury, 2009. <www.fiscal.treasury.gov>
Page 43:
The [social insurance] estimates are actuarial present values2 of the projections and are based on the economic and demographic assumptions representing the trustees’ best estimates as set forth in the relevant Social Security and Medicare trustees’ reports and in the relevant agency performance and accountability reports for the RRB [Railroad Retirement Board] and the DOL [Department of Labor] (Black Lung). …
2 Present values recognize that a dollar paid or collected in the future is worth less than a dollar today, because a dollar today could be invested and earn interest. To calculate a present value, future amounts are thus reduced using an assumed interest rate, and those reduced amounts are summed.
Page 52:
Participants for the Social Security and Medicare programs are assumed to be the “closed group” of individuals who are at least age 15 at the start of the projection period, and are participating as either taxpayers, beneficiaries, or both, except for the 2007 Medicare programs for which current participants are assumed to be at least 18 instead of 15 years of age.
Page 125:
Current participants in the Social Security and Medicare programs form the “closed group” of taxpayers and/or beneficiaries who are at least age 15 at the start of the projection period. For the 2007 Medicare projections, current participants are at least 18 years of age at the beginning of the projection period. Since the projection period for the Social Security, Medicare, and Railroad Retirement social insurance programs consists of 75 years, the period covers virtually all of the current participants’ working and retirement years, a period that could be greater than 75 years in a relatively small number of instances.
[49] Report: “Social Security and Medicare Trust Funds and the Federal Budget.” U.S. Department of Treasury, Office of Economic Policy, May 2009. <www.treasury.gov>
Page 16: “The resulting present value is the amount that would have to be put in the bank today at the assumed interest rate to fund the future cash flows.”
[50] “Fiscal Year 2022 Financial Report of the United States Government.” U.S. Department of the Treasury, February 16, 2023. <fiscal.treasury.gov>
Pages 5–6:
More than three-fourths of the federal government’s total assets ($5.0 trillion) consist of: 1) $877.8 billion in cash and monetary assets; 2) $406.9 billion in inventory and related property; 3) $1.4 trillion in net loans receivable (primarily student loans); and 4) $1.2 trillion in net PP&E. …
Other significant government resources not reported on the Balance Sheet include the government’s power to tax and set monetary policy, natural resources, and stewardship assets.
Page 162:
Stewardship PP&E [property, plant, and equipment] consists of items whose physical properties resemble those of general PP&E traditionally capitalized in financial statements. However, stewardship PP&E differs from general PP&E in that their values may be indeterminable or may have little meaning (e.g., museum collections, monuments, assets acquired in the formation of the nation) or that allocating the cost of such assets to accounting periods that benefit from the ownership of such assets is meaningless. Stewardship PP&E includes stewardship land (land not acquired for or in connection with general PP&E) and heritage assets (e.g., federal monuments and memorials and historically or culturally significant property).
Stewardship land is land and land rights owned by the federal government intended to be held indefinitely. The majority of stewardship land was acquired by the government during the first century of the nation’s existence. Examples of stewardship land include land reserved, managed, planned, used, or acquired for forests and parks, recreation and conservation, wildlife and grazing, historical landmarks, multiple purpose ancillary revenue generating activities, and/or buffer zones. “Land” is defined as the solid part of the surface of the earth. Excluded from the definition are the natural resources (that is, depletable resources, such as mineral deposits and petroleum; renewable resources, such as timber; and the outer-continental shelf resources) related to land. …
Heritage assets are government-owned assets that have one or more of the following characteristics: historical or natural significance; cultural, educational, or artistic importance; or significant architectural characteristics. Entities provide protection and preservation services to maintain all heritage assets in the best possible condition as part of America’s history. Examples of heritage assets include the Declaration of Independence, the U.S. Constitution, and the Bill of Rights preserved by the National Archives. Heritage assets are classified into two categories: collection and non-collection. Collection type heritage assets include objects gathered and maintained for exhibition, for example, museum collections, art collections, and library collections. Non-collection type heritage assets include parks, memorials, monuments, and buildings. In some cases, heritage assets may serve two purposes: a heritage function and general government operations. In those cases, the heritage asset should be considered a multi-use heritage asset if the predominant use of the asset is in general government operations (e.g., the main Treasury building used as an office building). The cost of acquisition, improvement, reconstruction, or renovation of multi-use heritage assets should be capitalized as general PP&E and depreciated over its estimated useful life.
[51] Federal Debt, Liabilities, Obligations, and Assets at Close of the 2022 Fiscal Year:
|
Category |
(Billions $) |
|
Publicly Held Debta b |
24,328 |
|
Liabilitiesc |
14,694 |
|
Social Security Future Expenditures in Excess of Future Dedicated Revenuesd b |
48,550 |
|
Medicare Future Expenditures in Excess of Future Dedicated Revenuese b |
52,877 |
|
Assetsf |
–4,962 |
|
Total [Calculated by Just Facts] |
135,487 |
NOTES:
Page 65: “United States Government Balance Sheets as of September 30, 2022, and 2021 … (In billions of dollars) … Federal debt and interest payable … 2022 [=] $24,328.0”
Page 65: “United States Government Balance Sheets as of September 30, 2022, and 2021 … (In billions of dollars) …
|
Assets |
2022 (Billions $) |
|
Cash and other monetary assets |
877.8 |
|
Accounts receivable, net |
356.3 |
|
Loans receivable, net |
1,434.1 |
|
Inventory and related property, net |
406.9 |
|
General property, plant and equipment, net |
1,197.5 |
|
Investments |
130.3 |
|
Investments in government-sponsored enterprises |
223.7 |
|
Advances and prepayments |
298.1 |
|
Other assets |
37.7 |
|
Total |
4,962 |
[52] Calculated with data from the webpage: “U.S. and World Population Clock.” U.S. Census Bureau, March 7, 2023. <www.census.gov>
“The United States population on September 30, 2022 was: 333,808,633”
CALCULATION: $135,487,000,000,000 / 333,808,633 people = $405,882/person
[53] Calculated with the dataset: “Average Number of People per Household, by Race and Hispanic Origin, Marital Status, Age, and Education of Householder: 2022.” U.S. Census Bureau, November 2022. <www2.census.gov>
“Total households [=] 131,202,000”
CALCULATION: $135,487,000,000,000 / 131,202,000 households = $1,032,660/household
[54] Calculated with the dataset: “Table 1.1.5. Gross Domestic Product [Billions of Dollars].” U.S. Department of Commerce, Bureau of Economic Analysis. Last revised February 23, 2023. <apps.bea.gov>
“Seasonally adjusted at annual rates … Gross Domestic Product … 2022Q3 [=] 25,723.9”
CALCULATION: $135,487,000,000,000 / $25,723,900,000,000 GDP = 5.3
[55] Calculated with the dataset: “Table 3.2. Federal Government Current Receipts and Expenditures [Billions of Dollars].” U.S. Department of Commerce, Bureau of Economic Analysis. Revised February 23, 2023. <apps.bea.gov>
“Seasonally adjusted at annual rates … Total receipts … 2022Q3 [=] 5,080.2”
CALCULATION: $135,487,000,000,000 / $5,080,200,000,000 receipts = 27
[56] Calculated with data from the report: Report: “Financial Accounts of the United States: Flow of Funds, Balance Sheets, and Integrated Macroeconomic Accounts, Third Quarter 2022.” Board of Governors of the Federal Reserve System, December 9, 2022. <www.federalreserve.gov>
Page 138: “B.101 Balance Sheet of Households and Nonprofit Organizations … Billions of dollars; amounts outstanding end of period, not seasonally adjusted … [Line] 40 Net worth … 2022 Q2 [=] 143,763.1”
CALCULATION: $135,487 billion in federal debts, liabilities, and Social Security/Medicare obligations / $143,763.1 billion net worth of households and nonprofit organizations = 94%
NOTE: The household assets included in this table include items such as real estate, corporate equities, mutual funds, equity in noncorporate businesses, life insurance, pension fund reserves, and consumer durable goods. Liabilities include items such as home mortgages and consumer credit. Nonprofit organizations are explicitly named in the title of this table because their assets are not considered household property, whereas the assets of for-profit entities are considered household property.
[57] Webpage: “Updated PPI [Producer Price Indexes] Commodity Weight Allocations to Stage-of-Processing Indexes.” Bureau of Labor Statistics. Last modified July 12, 2018. <www.bls.gov>
“SOP [stage-of-processing] 3130 – Consumer Durable Goods: contains nonfood products, ready for final consumption, with a life expectancy of more than three years. Examples of durable goods include furniture, passenger cars, and appliances.”
[58] See above for the components of these figures.
[59] “2008 Financial Report of the United States Government.” U.S. Department of the Treasury, 2008. <www.fiscal.treasury.gov>
Page 28 (of PDF): “The SOSI [Statement of Social Insurance] provides additional perspective on the Government’s long term estimated exposures and costs. However, it should be noted that the Government’s financial statements do not reflect future costs implied by any current policy, such as national defense, the global war on terrorism, and disaster relief and recovery.”
[60] “2010 Financial Report of the United States Government.” U.S. Department of the Treasury, December 21, 2010. <www.fiscal.treasury.gov>
Page 131:
Social Security and Medicare–Demographic and Economic Assumptions …
The Boards of Trustees1 of the OASDI [Social Security] and Medicare Trust Funds provide in their annual reports to Congress short-range (10-year) and long-range (75-year) actuarial estimates of each trust fund. … Assumptions are made about many economic and demographic factors, including gross domestic product (GDP), earnings, the CPI [consumer price index], the unemployment rate, the fertility rate, immigration, mortality, disability incidence and terminations and, for the Medicare projections, health care cost growth.
1 There are six trustees: the Secretaries of the Treasury (managing trustee), Health and Human Services, and Labor; the Commissioner of the Social Security Administration; and two public trustees who are generally appointed by the President and confirmed by the Senate for a 4-year term. By law, the public trustees are members of two different political parties.
[61] “2022 Annual Report of the Board of Trustees of the Federal Old-Age and Survivors Insurance and Disability Insurance Trust Funds.” United States Social Security Administration, June 7, 2022. <www.ssa.gov>
Page 54: “The Trustees use three types of financial measures to assess the actuarial status of the Social Security trust funds under the financing approach specified in current law: (1) annual cash-flow measures, including income rates, cost rates, and balances; (2) trust fund ratios; and (3) summary measures such as actuarial balances and unfunded obligations.”
[62] “2022 Annual Report of the Board of Trustees of the Federal Hospital Insurance and Federal Supplementary Medical Insurance Trust Funds.” United States Department of Health and Human Services, Centers for Medicare and Medicaid Services, June 2, 2022. <www.cms.gov>
Pages 1–2:
With one exception, the projections are based on the current-law provisions of the Social Security Act. The one exception is that the Part A projections disregard payment reductions that would result from the projected depletion of the Medicare HI [Hospital Insurance] trust fund. Under current law, payments would be reduced to levels that could be covered by incoming tax and premium revenues when the HI trust fund was depleted. If the projections reflected such payment reductions, then any imbalances between payments and revenues would be automatically eliminated, and the report would not fulfill one of its critical functions, which is to inform policymakers and the public about the size of any trust fund deficits that would need to be resolved to avert program insolvency. To date, lawmakers have never allowed the assets of the Medicare HI trust fund to become depleted.
[63] “2022 Annual Report of the Board of Trustees of the Federal Old-Age and Survivors Insurance and Disability Insurance Trust Funds.” United States Social Security Administration, June 7, 2022. <www.ssa.gov>
Page 9: “The intermediate assumptions reflect the Trustees’ best estimates of future experience. Therefore, most of the results presented in this overview indicate outcomes under the intermediate assumptions only. Any projection of the future is, of course, uncertain. For this reason, the Trustees also present results under low-cost and high-cost alternatives to provide a range of possible future experience.”
Page 19: “Uncertainty of the Projections … Significant uncertainty surrounds the intermediate assumptions.”
NOTES:
[64] “2022 Annual Report of the Board of Trustees of the Federal Hospital Insurance and Federal Supplementary Medical Insurance Trust Funds.” United States Department of Health and Human Services, Centers for Medicare and Medicaid Services, June 2, 2022. <www.cms.gov>
Page 188:
The Social Security Act requires the Trustees to evaluate the financial status of the Medicare trust funds. To comply with this mandate, the Trustees must assess whether the financing provided under current law is adequate to cover the benefit payments and other expenditures required under current law. Accordingly, the estimates shown in this report are based on all of the current statutory requirements, including (i) the reductions in payment updates by the increase in economy-wide productivity for most non-physician provider categories; (ii) the physician payment updates specified by the Medicare Access and CHIP [Children’s Health Insurance Program] Reauthorization Act of 2015 (MACRA) for all future years; and (iii) the expiration in 2025 of the 5-percent bonuses for qualified physicians in advanced alternative payment models (advanced APMs) and of the $500-million payments for physicians in the merit-based incentive payment system (MIPS).
Pages 189–190:
Over time, unless providers could alter their use of inputs to reduce their cost per service correspondingly, Medicare’s payments for health services would fall increasingly below providers’ costs. Providers could not sustain continuing negative margins and would have to withdraw from serving Medicare beneficiaries or (if total facility margins remained positive) shift substantial portions of Medicare costs to their non-Medicare, non-Medicaid payers. Under such circumstances, lawmakers might feel substantial pressure to override the productivity adjustments, much as they did to prevent reductions in physician payment rates while the sustainable growth rate (SGR) system was in effect.
While the physician payment system put in place by MACRA avoided the significant short-range physician payment issues resulting from the SGR system approach, it nevertheless raises important long-range concerns that will almost certainly need to be addressed by future legislation. In particular, additional updates totaling $500 million per year and 5-percent annual bonuses are scheduled to expire in 2025, resulting in a payment reduction for most physicians. In addition, the law specifies the physician payment updates for all years in the future, and these updates do not vary based on underlying economic conditions, nor are they expected to keep pace with the average rate of physician cost increases. The specified rate updates could be an issue in years when levels of inflation are high and would be problematic when the cumulative gap between the price updates and physician costs becomes large. The Trustees previously estimated that physician payment rates under current law will be lower than they would have been under the SGR formula by 2048 and will be about 30 percent lower by the end of the projection period. Absent a change in the delivery system or level of update by subsequent legislation, the Trustees expect access to Medicare-participating physicians to become a significant issue in the long term.
In view of these issues, it is important to note that the actual future costs for Medicare may exceed the projections shown in this report, possibly by substantial amounts.
Page 256:
Statement of Actuarial Opinion …
The annual reports of the Board of Trustees and the accompanying Actuarial Opinions have cautioned for a number of years about the challenges of adhering to current-law Medicare payment updates especially in the long range. For physician services, not only are updates below the rate of inflation in all future years, but there are more immediate concerns because updates for these services are projected to be −2.9 percent in 2023 and 0.0 percent for 2024 and 2025 and certain bonuses paid to physicians are scheduled to expire in 2025. Should payment rates prove to be inadequate for any service, beneficiaries’ access to and the quality of Medicare benefits would deteriorate over time, or future legislation would need to be enacted that would likely increase program costs beyond those projected under current law in this report.
[65] “2014 Annual Report of the Boards of Trustees of the Federal Hospital Insurance and Federal Supplementary Medical Insurance Trust Funds.” Centers for Medicare and Medicaid Services, July 28, 2014. <www.cms.gov>
Pages 276–277:
Statement of Actuarial Opinion …
The Affordable Care Act [ACA] is making important changes to the Medicare program that are designed, in part, to substantially improve its financial outlook. While the ACA has been successful in reducing many Medicare expenditures to date, there is a strong possibility that certain of these changes will not be viable in the long range. Specifically, the annual price updates for most categories of non-physician health services will be adjusted downward each year by the growth in economy-wide productivity. The ability of health care providers to sustain these price reductions will be challenging, as the best available evidence indicates that most providers cannot improve their productivity to this degree for a prolonged period given the labor-intensive nature of these services.†
Absent an unprecedented change in health care delivery systems and payment mechanisms, the prices paid by Medicare for health services will fall increasingly short of the costs of providing these services. By the end of the long-range projection period, Medicare prices for many services would be less than half of their level without consideration of the productivity price reductions. Before such an outcome would occur, lawmakers would likely intervene to prevent the withdrawal of providers from the Medicare market and the severe problems with beneficiary access to care that would result. Overriding the productivity adjustments, as lawmakers have done repeatedly in the case of physician payment rates, would lead to substantially higher costs for Medicare in the long range than those projected in this report.
NOTES:
[66] Calculated with data from:
a) Dataset: “Table 3.2. Federal Government Current Receipts and Expenditures.” U.S. Department of Commerce, Bureau of Economic Analysis. Last revised March 30, 2023. <apps.bea.gov>
b) Dataset: “Table 1.1.5. Gross Domestic Product.” United States Department of Commerce, Bureau of Economic Analysis. Last revised March 30, 2023. <apps.bea.gov>
NOTES:
[67] Article: “Great Depression.” By Richard H. Pells and Christina D. Romer. Encyclopedia Britannica, 1998. <www.britannica.com>
“Great Depression, worldwide economic downturn that began in 1929 and lasted until about 1939. It was the longest and most severe depression ever experienced by the industrialized Western world, sparking fundamental changes in economic institutions, macroeconomic policy, and economic theory.”
[68] Article: “Federal Reserve’s Role During WWII.” By Gary Richardson. Federal Reserve Bank of Richmond, Federal Reserve History, November 22, 2013. <www.federalreservehistory.org>
In September 1939, Germany’s invasion of Poland triggered war among the principal European powers. In December 1941, Japan attacked Pearl Harbor. Germany and Italy declared war on the United States. The American “arsenal of democracy” joined the Allied nations, including Britain, France, China, the Soviet Union, and numerous others, in the fight against the Axis alliance. The Allied counteroffensive began in 1942. The Axis surrendered in 1945.
[69] Webpage: “US Business Cycle Expansions and Contractions.” National Bureau of Economic Research. Last updated March 14, 2023. <www.nber.org>
“Contractions (recessions) start at the peak of a business cycle and end at the trough. … Peak Month (Peak Quarter) [=] December 2007 (2007Q4) … Trough Month (Trough Quarter) [=] June 2009 (2009Q2)”
[70] “WHO Director-General’s Opening Remarks at the Media Briefing on Covid-19.” World Health Organization, March 11, 2020. <www.who.int>
[Dr. Tedros Adhanom Ghebreyesus:] …
WHO [World Health Organization] has been assessing this outbreak around the clock and we are deeply concerned both by the alarming levels of spread and severity, and by the alarming levels of inaction.
We have therefore made the assessment that COVID-19 can be characterized as a pandemic.
[71] Calculated with data from:
a) Dataset: “Table 3.16. Government Current Expenditures by Function [Billions of Dollars].” U.S. Department of Commerce, Bureau of Economic Analysis. Last revised November 17, 2023. <apps.bea.gov>
b) Report: “Fiscal Year 2024 Historical Tables: Budget Of The U.S. Government.” White House Office of Management and Budget, March 2023. <www.whitehouse.gov>
“Table 3.1—Outlays by Superfunction and Function: 1940–2028.” <www.whitehouse.gov>
NOTES:
[72] Article: “Scientific Survey Shows Voters Across the Political Spectrum Are Ideologically Deluded.” By James D. Agresti. Just Facts, April 16, 2021. <www.justfacts.com>
The survey was conducted by Triton Polling & Research, an academic research firm that serves scholars, corporations, and political campaigns. The responses were obtained through live telephone surveys of 1,000 likely voters across the U.S. during November 4–11, 2020. This sample size is large enough to accurately represent the U.S. population. Likely voters are people who say they vote “every time there is an opportunity” or in “most” elections.
The margin of sampling error for all respondents is ±3% with at least 95% confidence. The margins of error for the subsets are 5% for Biden voters, 5% for Trump voters, 4% for males, 5% for females, 9% for 18 to 34 year olds, 4% for 35 to 64 year olds, and 5% for 65+ year olds.
The survey results presented in this article are slightly weighted to match the ages and genders of likely voters. The political parties and geographic locations of the survey respondents almost precisely match the population of likely voters. Thus, there is no need for weighting based upon these variables.
NOTE: For facts about what constitutes a scientific survey and the factors that impact their accuracy, visit Just Facts’ research on Deconstructing Polls & Surveys.
[73] Calculated with data from the report: “Just Facts 2020 U.S. Nationwide Survey.” Triton Polling & Research, November 2020. <www.justfacts.com>
Page 5:
Q22. Since the 1960s, what do you think has been the main cause of rising national debt?
Military spending [=] 25.4%
Social programs [=] 39.5%
Tax cuts [=] 25.1%
CALCULATION: 25.4% + 25.1% = 50.5%
[74] For facts about how surveys work and why some are accurate while others are not, click here.
[75] Calculated with the dataset: “The Distribution of Household Income, 2020.” Congressional Budget Office, November 2023. <www.cbo.gov>
“Table 3. Average Household Income, by Income Source and Income Group, 1979 to 2020, 2020 Dollars”
“Table 7. Components of Federal Taxes, by Income Group, 1979 to 2020, 2020 Dollars”
NOTES:
[76] Report: “The Distribution of Household Income, 2020.” Congressional Budget Office, November 2023. <www.cbo.gov>
Page 20:
Data
The core data used in CBO’s distributional analyses come from the Statistics of Income (SOI), a nationally representative sample of individual income tax returns collected by the IRS. That sample of tax returns becomes available to CBO approximately two years after the returns are filed. Data on household income are systematically and consistently reported in the SOI. The sample is therefore considered a reliable resource to use when analyzing the effects of fiscal policy on income. However, certain types of income are not reported in the SOI. In 2020, for example, the portion of payments from the Paycheck Protection Program that was not used to pay for employees’ wages was not taxable and therefore not available in the SOI data.
SOI data include information about tax filers’ family structure and age, but they do not include certain demographic information or data on people who do not file taxes. For that information, CBO uses data from the Annual Social and Economic Supplement of the Census Bureau’s Current Population Survey (CPS), which has data on the demographic characteristics and income of a large sample of households.6
CBO combines the two data sources, statistically matching each SOI record to a corresponding CPS record on the basis of demographic characteristics and income. Each pairing results in a new record that takes on some characteristics of the CPS record and some characteristics of the SOI record.7
Page 22:
Measures of Income, Federal Taxes, and Means-Tested Transfers
Most distributional analyses rely on a measure of annual income as the metric for ranking households. In CBO’s analyses of the distribution of household income, information about taxable income sources for tax-filing units that file individual income tax returns comes from the SOI, whereas information about nontaxable income sources and income for tax-filing units that do not file individual income tax returns comes from the CPS. Among households at the top of the income distribution, the majority of income data are drawn from the SOI. In contrast, among households in the lower and middle quintiles, a larger portion of income data is drawn from the CPS….
Pages 31–32:
Household income, unless otherwise indicated, refers to income before the effects of means-tested transfers and federal taxes are accounted for. Throughout this report, that income concept is called income before transfers and taxes. It consists of market income plus social insurance benefits.
Market income consists of the following five elements:
• Labor income. Wages and salaries, including those allocated by employees to 401(k) and other employment-based retirement plans; employer-paid health insurance premiums (as measured by the Census Bureau’s Current Population Survey); the employer’s share of payroll taxes for Social Security, Medicare, and federal unemployment insurance; and the share of corporate income taxes borne by workers.
• Business income. Net income from businesses and farms operated solely by their owners, partnership income, and income from S corporations.
• Capital gains. Net profits realized from the sale of assets (but not increases in the value of assets that have not been realized through sales).
• Capital income. Taxable and tax-exempt interest, dividends paid by corporations (but not dividends from S corporations, which are considered part of business income), rental income, and the share of corporate income taxes borne by capital owners.
• Other income sources. Income received in retirement for past services and other nongovernmental sources of income.
Social insurance benefits consist of benefits from Social Security (Old Age, Survivors, and Disability Insurance), Medicare (measured by the average cost to the government of providing those benefits), regular unemployment insurance (but not expanded unemployment compensation), and workers’ compensation.
Means-tested transfers are cash payments and in-kind services provided through federal, state, and local government assistance programs. Eligibility to receive such transfers is determined primarily on the basis of income, which must be below certain thresholds. Means-tested transfers are provided through the following programs: Medicaid and the Children’s Health Insurance Program (measured by the average cost to the federal government and state governments of providing those benefits); the Supplemental Nutrition Assistance Program (formerly known as the Food Stamp program); housing assistance programs; Supplemental Security Income; Temporary Assistance for Needy Families and its predecessor, Aid to Families With Dependent Children; child nutrition programs; the Low Income Home Energy Assistance Program; and state and local governments’ general assistance programs. For 2020, CBO included expanded unemployment compensation in means-tested transfers.
Average means-tested transfer rates are calculated as means-tested transfers (totaled within an income group) divided by income before transfers and taxes (totaled within an income group).
Federal taxes consist of individual income taxes, payroll (or social insurance) taxes, corporate income taxes, and excise taxes. Those four sources accounted for 94 percent of federal revenues in fiscal year 2020. Revenue sources not examined in this report include states’ deposits for unemployment insurance, estate and gift taxes, net income of the Federal Reserve System that is remitted to the Treasury, customs duties, and miscellaneous fees and fines.
In this analysis, taxes for a given year are the amount a household owes on the basis of income received in that year, regardless of when the taxes are paid. Those taxes comprise the following four categories:
• Individual income taxes. Individual income taxes are levied on income from all sources, except those excluded by law. Individual income taxes can be negative because they include the effects of refundable tax credits (including recovery rebate credits), which can result in net payments from the government. Specifically, if the amount of a refundable tax credit exceeds a filer’s tax liability before the credit is applied, the government pays that excess to the filer. Statutory marginal individual income tax rates are the rates set in law that apply to the last dollar of income.
• Payroll taxes. Payroll taxes are levied primarily on wages and salaries. They generally have a single rate and few exclusions, deductions, or credits. Payroll taxes include those that fund the Social Security trust funds, the Medicare trust fund, and unemployment insurance trust funds. The federal portion of the unemployment insurance payroll tax covers only administrative costs for the program; state-collected unemployment insurance payroll taxes are not included in the Congressional Budget Office’s measure of federal taxes (even though they are recorded as revenues in the federal budget). Households can be entitled to future social insurance benefits, including Social Security, Medicare, and unemployment insurance, as a result of paying payroll taxes. In this analysis, average payroll tax rates capture the taxes paid in a given year and do not capture the benefits that households may receive in the future.
• Corporate income taxes. Corporate income taxes are levied on the profits of U.S.–based corporations organized as C corporations. In this analysis, CBO allocated 75 percent of corporate income taxes in proportion to each household’s share of total capital income (including capital gains) and 25 percent to households in proportion to their share of labor income.
• Excise taxes. Sales of a wide variety of goods and services are subject to federal excise taxes. Most revenues from excise taxes are attributable to the sale of motor fuels (gasoline and diesel fuel), tobacco products, alcoholic beverages, and aviation-related goods and services (such as aviation fuel and airline tickets).
Average federal tax rates are calculated as federal taxes (totaled within an income group) divided by income before transfers and taxes (totaled within an income group).
Income after transfers and taxes is income before transfers and taxes plus means-tested transfers minus federal taxes.
Income groups are created by ranking households by their size-adjusted income before transfers and taxes. A household consists of people sharing a housing unit, regardless of their relationship. The income quintiles (or fifths of the distribution) contain approximately the same number of people but slightly different numbers of households…. Similarly, each full percentile (or hundredth of the distribution) contains approximately the same number of people but a different number of households. If a household has negative income (that is, if its business or investment losses exceed its other income), it is excluded from the lowest income group but included in totals.
NOTE: † See Just Facts’ research on the distribution of the federal tax burden for details about how the Congressional Budget Office determines the share of corporate income taxes borne by workers and owners of capital.
[77] Economists typically use a “comprehensive measure of income” to calculate effective tax rates because this provides a complete “measure of ability to pay” taxes.† In keeping with this, Just Facts determines effective tax rates by dividing all measurable taxes by all income. The Congressional Budget Office (CBO) previously did the same,‡ but in 2018, CBO announced that it would exclude means-tested transfers from its measures of income and effective tax rates.§ #
Given this change, Just Facts now uses CBO data to determine comprehensive income and effective tax rates by adding back the means-tested transfers that CBO publishes but takes out of these measures. To do this, Just Facts makes a simplifying assumption that households in various income quintiles do not significantly change when these transfers are added. This is mostly true, but as CBO notes:
Almost one-fifth of the households in the lowest quintile of income before transfers and taxes would have been in higher quintiles if means-tested transfers were included in the ranking measure (see Table 5). Because net movement into a higher income quintile entails a corresponding net movement out of those quintiles, more than one-fifth of the households in the second quintile of income before transfers and taxes would have been bumped down into the bottom before-tax income quintile. Because before-tax income excludes income in the form of means-tested transfers, almost one-fifth of the people in the lowest quintile of income before transfers and taxes were in higher before-tax income quintiles. There is no fundamental economic change represented by those changes in income groups—just a change in the income definition used to rank households. Because means-tested transfers predominantly go to households in the lower income quintiles, there is not much shuffling across income quintile thresholds toward the top of the distribution.§
NOTES:
[78] Webpage: “Listings of WHO’s Response to Covid-19.” World Health Organization, June 29, 2020. Last updated January 29, 2021. <bit.ly>
“11 Mar 2020: Deeply concerned both by the alarming levels of spread and severity, and by the alarming levels of inaction, WHO made the assessment that Covid-19 could be characterized as a pandemic.”
[79] Article: “How Many Workers Are Employed in Sectors Directly Affected by Covid-19 Shutdowns, Where Do They Work, and How Much Do They Earn?” By Matthew Dey and Mark A. Loewenstein. U.S. Bureau of Labor Statistics Monthly Labor Review, April 2020. <www.bls.gov>
Page 1: “To reduce the spread of coronavirus disease 2019 (Covid-19), nearly all states have issued stay-at-home orders and shut down establishments deemed nonessential.”
[80] Article: “Covid-19 Restrictions.” USA Today. Last updated July 11, 2022. <www.usatoday.com>
Throughout the pandemic, officials across the United States have rolled out a patchwork of restrictions on social distancing, masking and other aspects of public life. The orders vary by state, county and even city. At the height of restrictions in late March and early April 2020, more than 310 million Americans were under directives ranging from “shelter in place” to “stay at home.” Restrictions are now ramping down in many places, as most states have fully reopened their economies.
[81] During 2020 and early 2021, federal politicians enacted six “Covid relief” laws that will cost a total of about $5.2 trillion over the course of a decade. This amounts to an average of $40,444 in spending per U.S. household.
Calculated with data from:
a) Report: “CBO Estimate for H.R. 6074, the Coronavirus Preparedness and Response Supplemental Appropriations Act, 2020, as Posted on March 4, 2020.” Congressional Budget Office, March 4, 2020. <www.cbo.gov>
b) Report: “Cost Estimate for H.R. 6201, Families First Coronavirus Response Act, Enacted as Public Law 116-127 on March 18, 2020.” Congressional Budget Office, April 2, 2020. <www.cbo.gov>
c) Report: “Cost Estimate for H.R. 748, CARES Act, Public Law 116-136.” Congressional Budget Office, April 16, 2020. <www.cbo.gov>
d) Report: “CBO Estimate for H.R. 266, the Paycheck Protection Program and Health Care Enhancement Act as Passed by the Senate on April 21, 2020.” Congressional Budget Office, April 22, 2020. <www.cbo.gov>
e) Report: “Estimate for Division N—Additional Coronavirus Response and Relief, H.R. 133, Consolidated Appropriations Act, 2021, Public Law 116-260, Enacted on December 27, 2020.” Congressional Budget Office, January 14, 2021. <www.cbo.gov>
f) Report: “Estimated Budgetary Effects of H.R. 1319, American Rescue Plan Act of 2021 as Passed by the Senate on March 6, 2021.” Congressional Budget Office, March 10, 2021. <www.cbo.gov>
g) Dataset: “HH-1. Households by Type: 1940 to Present.” U.S. Census Bureau, Current Population Survey, November 2021. <www.census.gov>
NOTE: An Excel file containing the data and calculations is available upon request.
[82] Article: “Scientific Survey Shows Voters Widely Accept Misinformation Spread By the Media.” By James D. Agresti. Just Facts, January 2, 2020. <www.justfacts.com>
The findings are from a nationally representative annual survey commissioned by Just Facts, a non-profit research and educational institute. The survey was conducted by Triton Polling & Research, an academic research firm that used sound methodologies to assess U.S. residents who regularly vote. …
The survey was conducted by Triton Polling & Research, an academic research firm that serves scholars, corporations, and political campaigns. The responses were obtained through live telephone surveys of 700 likely voters across the U.S. during December 2–11, 2019. This sample size is large enough to accurately represent the U.S. population. Likely voters are people who say they vote “every time there is an opportunity” or in “most” elections.
The margin of sampling error for the total pool of respondents is ±4% with at least 95% confidence. The margins of error for the subsets are 6% for Democrat voters, 6% for Trump voters, 5% for males, 5% for females, 12% for 18 to 34 year olds, 5% for 35 to 64 year olds, and 6% for 65+ year olds.
The survey results presented in this article are slightly weighted to match the ages and genders of likely voters. The political parties and geographic locations of the survey respondents almost precisely match the population of likely voters. Thus, there is no need for weighting based upon these variables.
NOTE: For facts about what constitutes a scientific survey and the factors that impact their accuracy, visit Just Facts’ research on Deconstructing Polls & Surveys.
[83] Dataset: “Just Facts’ 2019 U.S. Nationwide Survey.” Just Facts, January 2020. <www.justfacts.com>
Page 2:
Q7. On average, who would you say pays a greater portion of their income in federal taxes: The middle class or the upper 1% of income earners?
Middle class … Percent [=] 78.9%
Upper 1% … Percent [=] 18.3%
Unsure … Percent [=] 2.8%
[84] For facts about how surveys work and why some are accurate while others are not, click here.
[85] Report: “United States Federal Debt: Answers To Frequently Asked Questions, An Update.” U.S. Government Accountability Office, August 12, 2004. <www.gao.gov>
Page 39:
Over the long term, the costs of federal borrowing will be borne by tomorrow’s workers and taxpayers. Higher saving and investment in the nation’s capital stock—factories, equipment, and technology—increase the nation’s capacity to produce goods and services and generate higher income in the future. Increased economic capacity and rising incomes would allow future generations to more easily bear the burden of the federal government’s debt. Persistent deficits and rising levels of debt, however, reduce funds available for private investment in the United States and abroad. Over time, lower productivity and GDP [gross domestic product] growth ultimately may reduce or slow the growth of the living standards of future generations.
Page 41:
GAO’s [U.S. Government Accountability Office] long-term simulations show that absent policy actions aimed at deficit reduction, debt burdens of such magnitudes imply a substantial decline in national saving available to finance private investment in the nation’s capital stock. The fiscal paths simulated are ultimately unsustainable and would inevitably result in declining GDP and future living standards. Even before such effects, these debt paths would likely result in rising inflation, higher interest rates, and the unwillingness of foreign investors to invest in a weakening American economy.
[86] Report: “United States Federal Debt: Answers To Frequently Asked Questions, An Update.” U.S. Government Accountability Office, August 12, 2004. <www.gao.gov>
Page 39:
Higher saving and investment in the nation’s capital stock—factories, equipment, and technology—increase the nation’s capacity to produce goods and services and generate higher income in the future. Increased economic capacity and rising incomes would allow future generations to more easily bear the burden of the federal government’s debt. Persistent deficits and rising levels of debt, however, reduce funds available for private investment in the United States and abroad. Over time, lower productivity and GDP [gross domestic product] growth ultimately may reduce or slow the growth of the living standards of future generations.
Page 41:
GAO’s [U.S. Government Accountability Office] long-term simulations show that absent policy actions aimed at deficit reduction, debt burdens of such magnitudes imply a substantial decline in national saving available to finance private investment in the nation’s capital stock. The fiscal paths simulated are ultimately unsustainable and would inevitably result in declining GDP and future living standards.
[87] Report: “Federal Debt and the Risk of a Fiscal Crisis.” Congressional Budget Office, July 27, 2010. <www.cbo.gov>
Page 1: “Some of those consequences would arise gradually: A growing portion of people’s savings would go to purchase government debt rather than toward investments in productive capital goods such as factories and computers; that ‘crowding out’ of investment would lead to lower output and incomes than would otherwise occur.”
[88] Report: “Tempting Fate: The Federal Budget Outlook.” By Alan J. Auerbach and William G. Gale. Brookings Institution, February 8, 2011. Updated 6/30/11. <www.brookings.edu>
Page 16: “[S]ustained large deficits will reduce future national income and living standards.”
[89] Report: “The Long-Term Budget Outlook.” Congressional Budget Office, June 2010. Revised August 2010. <www.cbo.gov>
Page xi: “Large budget deficits would reduce national saving, leading to higher interest rates, more borrowing from abroad, and less domestic investment—which in turn would lower income growth in the United States.”
[90] Report: “Estimated Macroeconomic Impacts of the American Recovery and Reinvestment Act of 2009.” Congressional Budget Office, March 2, 2009. <www.cbo.gov>
Page 2:
In contrast to its positive near-term macroeconomic effects, the legislation will reduce output slightly in the long run, CBO [U.S. Congressional Budget Office] estimates. The principal channel for that effect, which would also arise from other proposals to provide short-term economic stimulus by increasing government spending or reducing revenues, is that the law will result in an increase in government debt. To the extent that people hold their wealth as government bonds rather than in a form that can be used to finance private investment, the increased debt will tend to reduce the stock of productive private capital. In economic parlance, the debt will “crowd out” private investment.
[91] Report: “The Budget and Economic Outlook: Fiscal Years 2013 to 2023.” U.S. Congressional Budget Office, February 2013. <www.cbo.gov>
Page 7: “Because federal borrowing generally reduces national saving, the stock of capital assets, such as equipment and structures, will be smaller and aggregate wages will be less than if the debt were lower.”
[92] Book: This Time is Different: Eight Centuries of Financial Folly. By Carmen M. Reinhart (University of Maryland) and Kenneth S. Rogoff (Harvard University). Princeton University Press, 2009.
Page xxvii: “Our aim here is to be expansive, systematic, and quantitative: our empirical analysis covers sixty-six countries over nearly eight centuries.”
Page 65: “Governments can also default on domestic public debt through high and unanticipated inflation, as the United States and many European countries famously did in the 1970s.”
Page 77: “Inflation conditions often continue to worsen after an external default.12”
Page 175:
[I]nflation has long been the weapon of choice in sovereign defaults on domestic debt and, where possible, on international debt. … [G]overnments engage in massive monetary expansion, in part because they can thereby gain a seigniorage tax on real money balances (by inflating down the value of citizens’ currency and issuing more to meet demand). But they also want to reduce, or even wipe out, the real value of public debts outstanding.
Page 398: “12 Domestic defaults produce even worse inflation outcomes; see chapter 9.”
Page 400: “Seigniorage is simply the real income a government can realize by exercising its monopoly on printing currency. The revenue can be broken down into the quantity of currency needed to meet the growing transactions demand at constant prices and the remaining growth, which causes inflation, thereby lowering the purchasing power of existing currency.”
[93] Report: “Federal Debt and the Risk of a Fiscal Crisis.” Congressional Budget Office, July 27, 2010. <www.cbo.gov>
Page 7:
[A]s governments create money to finance their activities or pay creditors during fiscal crises, they raise inflation. Higher inflation has negative consequences for the economy, especially if inflation moves above the moderate rates seen in most developed countries in recent years.16 Higher inflation might appear to benefit the U.S. government financially because the value of the outstanding debt (which is mostly fixed in dollar terms) would be lowered relative to the size of the economy (which would increase when measured in dollar terms).17 However, higher inflation would also increase the size of future budget deficits.
[94] Report: “United States Federal Debt: Answers To Frequently Asked Questions, An Update.” U.S. Government Accountability Office, August 12, 2004. <www.gao.gov>
Page 41:
GAO’s [U.S. Government Accountability Office] long-term simulations show that absent policy actions aimed at deficit reduction, debt burdens of such magnitudes imply a substantial decline in national saving available to finance private investment in the nation’s capital stock. The fiscal paths simulated are ultimately unsustainable and would inevitably result in declining GDP [gross domestic product] and future living standards. Even before such effects, these debt paths would likely result in rising inflation, higher interest rates, and the unwillingness of foreign investors to invest in a weakening American economy.
[95] Report: “Federal Debt and the Risk of a Fiscal Crisis.” Congressional Budget Office, July 27, 2010. <www.cbo.gov>
Page 1: “Rising interest costs might also force reductions in spending on important government programs.”
[96] Report: “Federal Debt and the Risk of a Fiscal Crisis.” Congressional Budget Office, July 27, 2010. <www.cbo.gov>
Page 1: “[I]f the payment of interest on the extra debt was financed by imposing higher marginal tax rates, those rates would discourage work and saving and further reduce output.”
[97] Report: “Federal Debt and the Risk of a Fiscal Crisis.” Congressional Budget Office, July 27, 2010. <www.cbo.gov>
Page 7:
A sudden increase in interest rates would also reduce the market value of outstanding government bonds, inflicting losses on investors who hold them. That decline could precipitate a broader financial crisis by causing losses for mutual funds, pension funds, insurance companies, banks, and other holders of federal debt—losses that might be large enough to cause some financial institutions to fail.
[98] Report: “The 2022 Long-Term Budget Outlook.” Congressional Budget Office, July 2022. <www.cbo.gov>
Page 28:
Effects of Fiscal Policy in CBO’s Economic Projections
CBO’s economic projections incorporate the effects of projected federal deficits under current law. In those budget projections, deficits grow, and as a result, the federal government borrows more. That increase in federal borrowing pushes up interest rates and thus reduces private investment in capital, causing output to be lower in the long term than it would be otherwise, especially in the last two decades of the projection period. Less private investment reduces the amount of capital per worker, making workers less productive and leading to lower wages, which reduces people’s incentive to work and thus leads to a smaller supply of labor.
[99] Report: “The Long-Term Budget Outlook.” Congressional Budget Office, June 2010. Revised August 2010. <www.cbo.gov>
Page xi: “Over time, higher debt would increase the probability of a fiscal crisis in which investors would lose confidence in the government’s ability to manage its budget, and the government would be forced to pay much more to borrow money.”
Page 14: “The federal government could not issue ever-larger amounts of debt relative to the size of the economy indefinitely. If debt continued to rise rapidly relative to GDP [gross domestic product], investors at some point would begin to doubt the government’s willingness to pay interest on that debt.”
[100] Report: “Federal Debt and the Risk of a Fiscal Crisis.” Congressional Budget Office, July 27, 2010. <www.cbo.gov>
Pages 4–5:
A rising level of government debt would have another significant negative consequence. Combined with an unfavorable long-term budget outlook, it would increase the probability of a fiscal crisis for the United States. In such a crisis, investors become unwilling to finance all of a government’s borrowing needs unless they are compensated with very high interest rates; as a result, the interest rates on government debt rise suddenly and sharply relative to rates of return on other assets. Unfortunately, there is no way to predict with any confidence whether and when such a crisis might occur in the United States; in particular, there is no identifiable tipping point of debt relative to GDP [gross domestic product] indicating that a crisis is likely or imminent. But all else being equal, the higher the debt, the greater the risk of such a crisis. …
The history of fiscal crises in other countries does not necessarily indicate the conditions under which investors might lose confidence in the U.S. government’s ability to manage its budget or the consequences for the nation of such a loss of confidence. On the one hand, the United States may be able to issue more debt (relative to output) than the governments of other countries can, without triggering a crisis, because the United States has often been viewed as a “safe haven” by investors around the world, and the U.S. government’s securities have often been viewed as being among the safest investments in the world. On the other hand, the United States may not be able to issue as much debt as the governments of other countries can because the private saving rate has been lower in the United States than in most developed countries, and a significant share of U.S. debt has been sold to foreign investors.
[101] Book: Introductory Econometrics: Using Monte Carlo Simulation with Microsoft Excel. By Humberto Barreto and Frank M. Howland. Cambridge University Press, 2006.
Page 43:
Association Is Not Causation
A second problem with the correlation coefficient involves its interpretation. A high correlation coefficient means that two variables are highly associated, but association is not the same as causation.
This issue is a persistent problem in empirical analysis in the social sciences. Often the investigator will plot two variables and use the tight relationship obtained to draw absolutely ridiculous or completely erroneous conclusions. Because we so often confuse association and causation, it is extremely easy to be convinced that a tight relationship between two variables means that one is causing the other. This is simply not true.
[102] Textbook: Macroeconomics: A Contemporary Introduction (10th edition). By William A. McEachern. South-Western Cengage Learning, 2014.
Page 13:
Economic analysis, like other forms of scientific inquiry, is subject to common mistakes in reasoning that can lead to faulty conclusions. Here are three sources of confusion.
The Fallacy That Association Is Causation
In the past two decades, the number of physicians specializing in cancer treatment increased sharply. At the same time, the incidence of some cancers increased. Can we conclude that physicians cause cancer? No. To assume that event A caused event B simply because the two are associated in time is to commit the association-is-causation fallacy, a common error. The fact that one event precedes another or that the two events occur simultaneously does not necessarily mean that one causes the other. Remember: Association is not necessarily causation.
[103] Article: “Statistical Malpractice.” By Bruce G. Charlton. Journal of the Royal College of Physicians of London, March 1996. Pages 112–114. <www.researchgate.net>
Page 112: “Science is concerned with causes but statistics is concerned with correlations.”
Page 113: “The root of most instances of statistical malpractice is the breaking of mathematical neutrality and the introduction of causal assumptions into analysis without justifying them on scientific grounds.”
[104] Book: Business and Competitive Analysis: Effective Application of New and Classic Methods (2nd edition). By Craig S. Fleisher and Babette E. Bensoussan. Pearson Education, 2015.
Pages 338–339: “One of the biggest potential problems with statistical analysis is the quality of the interpretation of the results. Many people see cause-and-effect relationships ‘evidenced’ by statistics, which are in actuality simply describing data associations or correlation having little or nothing to do with casual factors.”
[105] Report: “Federal Debt and the Risk of a Fiscal Crisis.” Congressional Budget Office, July 27, 2010. <www.cbo.gov>
Page 1: “Some of those consequences would arise gradually: A growing portion of people’s savings would go to purchase government debt rather than toward investments in productive capital goods such as factories and computers; that ‘crowding out’ of investment would lead to lower output and incomes than would otherwise occur.”
[106] Report: “United States Federal Debt: Answers To Frequently Asked Questions, An Update.” U.S. Government Accountability Office, August 12, 2004. <www.gao.gov>
Page 39:
Higher saving and investment in the nation’s capital stock—factories, equipment, and technology—increase the nation’s capacity to produce goods and services and generate higher income in the future. Increased economic capacity and rising incomes would allow future generations to more easily bear the burden of the federal government’s debt. Persistent deficits and rising levels of debt, however, reduce funds available for private investment in the United States and abroad. Over time, lower productivity and GDP [gross domestic product] growth ultimately may reduce or slow the growth of the living standards of future generations.
[107] Report: “Federal Debt and the Risk of a Fiscal Crisis.” Congressional Budget Office, July 27, 2010. <www.cbo.gov>
Page 7:
A sudden increase in interest rates would also reduce the market value of outstanding government bonds, inflicting losses on investors who hold them. That decline could precipitate a broader financial crisis by causing losses for mutual funds, pension funds, insurance companies, banks, and other holders of federal debt—losses that might be large enough to cause some financial institutions to fail.
[108] Paper: “Measuring the Well-Being of the Poor Using Income and Consumption.” By Bruce D. Meyer and James X. Sullivan. Journal of Human Resources, June 2003. Pages 1180–1220. <harris.uchicago.edu>
Pages 1181–1182:
Consumption is less vulnerable to under-reporting bias, and ethnographic research on poor households in the U.S. suggests that consumption is better reported than income. There are also conceptual and economic reasons to prefer consumption to income because consumption is a more direct measure of material well-being.
We find substantial evidence that consumption is better measured than income for those with few resources. We also find that consumption performs better as an indicator of low material well-being. These findings favor the examination of consumption data when policymakers are deciding on appropriate benefit amounts for programs such as Food Stamps, just as consumption standards were behind the original setting of the poverty line. Similarly, the results favor using consumption measures to evaluate the effectiveness of transfer programs and general trends in poverty and food spending. Nevertheless, the ease of reporting income favors its use as the main eligibility criteria for transfer programs such as Food Stamps and Temporary Assistance for Needy Families (TANF).
[109] “Eurostat-OECD Methodological Manual on Purchasing Power Parities.” Eurostat and the Organization for Economic Cooperation and Development, 2012. <www.oecd.org>
Pages 20–21:
While GDP [gross domestic product] is a good indicator of the level of economic activity, it is not an accurate measure of material well-being, when material well-being is defined in terms of individual goods and services consumed by households (that is, the goods and services that households consume to satisfy their individual needs). This is because GDP covers not only individual goods and services but also collective services provided to the community by government, capital goods and net exports.
51. Individual consumption expenditure by households is defined as the final consumption expenditure incurred by households on individual goods and services. In other words, it covers only the goods and services that households purchase to satisfy their individual needs. Even so, it is not a good measure for comparing material well-being between countries because it covers only the purchase of individual services by households and does not include the provision of individual services, particularly health and education services, to households by government and Non-Profit Institutions serving Households (NPISHs).
52. In some countries, government and NPISHs provide the greater part of health and education services and these expenditures are included in the individual consumption expenditure of government and the individual consumption expenditure of NPISHs. In other countries, households purchase nearly all health and education services from market producers and these expenditures are included in the individual consumption expenditure of households. Under these circumstances, individual consumption expenditure by households is not the correct measure with which to compare the volumes of individual goods and services actually consumed by households in different countries. Households in countries where government and NPISHs are the main providers of individual services will appear to consume a smaller volume of goods and services than households in countries where the households themselves pay directly for the bulk of these services. This can be avoided by comparing the actual individual consumption of countries.
53. Actual individual consumption is defined as individual consumption expenditure by households plus individual consumption expenditure by government plus individual consumption expenditure by NPISHs. Of the three national accounting aggregates discussed, it is the best measure of material well-being. This is because it comprises only the goods and services that households actually consume to satisfy their individual needs. It covers all such goods and services irrespective of whether they are purchased by the households themselves or are provided as social transfers in kind by government and NPISHs.
[110] “World Development Report 2000/2001: Attacking Poverty.” World Bank, September 2000. <openknowledge.worldbank.org>
Page 17:
The World Bank’s Approach
The World Bank has been estimating global income poverty figures since 1990. The latest round of estimation, in October 1999, used new sample survey data and price information to obtain comparable figures for 1987, 1990, 1993, 1996, and 1998 (the figures for 1998 are preliminary estimates). The method is the same as in past estimates (World Bank 1990, 1996d).
Consumption. Poverty estimates are based on consumption or income data collected through household surveys. Data for 96 countries, from a total of 265 nationally representative surveys, corresponding to 88 percent of the developing world’s people are, now available, up from only 22 countries in 1990. Of particular note is the increase in the share of people covered in Africa from 66 to 73 percent, a result of extensive efforts to improve household data in the region.
Consumption is conventionally viewed as the preferred welfare indicator, for practical reasons of reliability and because consumption is thought to better capture long-run welfare levels than current income.
NOTE: For facts about what constitutes a scientific survey and the factors that impact their accuracy, visit Just Facts’ research on Deconstructing Polls & Surveys.
[111] Webpage: “What We Do.” World Bank. Accessed April 25, 2017 at <www.worldbank.org>
The World Bank Group has set two goals for the world to achieve by 2030:
• End extreme poverty by decreasing the percentage of people living on less than $1.90 a day to no more than 3%
• Promote shared prosperity by fostering the income growth of the bottom 40% for every country
The World Bank is a vital source of financial and technical assistance to developing countries around the world. We are not a bank in the ordinary sense but a unique partnership to reduce poverty and support development. The World Bank Group comprises five institutions managed by their member countries.
[112] Commentary: “No, The United States Will Not Go Into A Debt Crisis, Not Now, Not Ever.” By Pascal-Emmanuel Gobry. Forbes, October 19, 2012. <www.forbes.com>
If there’s one article of faith in Washington (and elsewhere), it’s the idea that the United States might get into a debt crisis if it doesn’t get its fiscal house in order.
This is not true.
The reason why it’s not true is because we live in a fiat currency system, where the United States government can create an infinite number of dollars at no cost to meet its obligations. A Treasury bill is a promise that the government will give you US dollars—something that the United States government can produce infinitely and at no cost.
That’s the reason why interest rates on United States debt have only gone down even as the debt has ballooned. That’s the reason why Great Britain has very low rates on its debt despite having very high debt-to-GDP [gross domestic product]. That’s the reason why Japan has an astounding debt-to-GDP ratio and still enjoys some of the lowest rates ever. …
Well, what about Argentina? Argentina had to default on its debt because it had pegged its currency to the US dollar. It wasn’t sovereign with regard to its currency since it had to maintain its currency’s peg. It wasn’t Argentina’s debt that caused it to default, it was its currency peg.
What about Greece? Same thing. Greece hasn’t used its own currency for ten years. Of course it’s going bankrupt. …
I’m a writer and a Fellow at the Ethics and Public Policy Center. I most recently worked as an analyst, and before that at Business Insider, where I co-created BI Intelligence, the company’s market research service.
[113] Commentary: “No, the United States Will Never, Ever Turn Into Greece.” By Matthew O’Brien. The Atlantic, March 7, 2013. <www.theatlantic.com>
The two main conclusions are: (1) For countries that can borrow in their own currency, like the U.S., higher debt doesn’t clearly lead to higher interest rates. (2) For countries that don’t control their currencies, like Greece, it’s borrowing too much from foreigners (NOT borrowing too much in general) that clearly leads to much higher borrowing costs.
Not all debt is created equal. Countries that borrow in a currency they control play under a different set of rules. They can never run out of money to pay back what they owe, since they can always print what they need as a last resort. That’s not to say they actually do or should turn to the printing-press to finance themselves. But the option to do so calms markets. After all, inflation is a lot less bad than default for creditors.
[114] Article: “Here’s a Lesson From Japan About the Threat of a U.S. Debt Crisis.” By Sunny Oh. Market Watch, May 14, 2018. <www.marketwatch.com>
A rapidly widening U.S. budget deficit is stoking fears among some economists of a potential debt crisis. Investors might want to look to Japan before pushing the panic button, say analysts at Goldman Sachs.
Daan Struyven and David Mericle, economists at Goldman Sachs, said the example of Japan could prove instructive as the world’s third largest economy had not suffered a debt crisis, even though it arguably has the most public debt as a share of its GDP [gross domestic product] in the world. Japan’s government debt to GDP ratio sits at 236% in 2017, more than double that of the U.S., which stands at 108%, according to the International Monetary Fund.
“Japan’s experience confirms that a debt crisis is difficult to imagine in a country that issues debt in its own currency, has a flexible exchange rate, and controls its central bank,” wrote Struyven and Mericle. All three features are also shared by the U.S.
[115] Commentary: “The United States Is Not Greece.” By Stephen J. Rose and William T. Dickens. Forbes, May 30, 2012. <www.forbes.com>
While large government deficits can lead to economic distress, the relationship is weak and complicated. …
Further, history shows many examples of high levels of debt not causing problems when circumstances are different (for example, in Japan today or the U.S. after World War II). A sign that debt problems are becoming economic problems occurs when the interest rates on a country’s debt rise. This indicates that investors are nervous about default and demand a premium to hold this debt. Of course, rising interest costs make the problems worse and put more pressure on the affected country.
Most countries that face rising interest costs on their debt will see the value of their currency decline. But, as a member of the European Monetary Union (EMU), Greece does not control its own currency (whose value of the euro by Germany and France). The United States has its own currency and its own monetary policy. …
Dr. Rose is a Research Professor at the Georgetown Center on Education and the Economy and an EconoSTATS Contributor. Dr. Dickens is University Distinguished Professor, Northeastern University.
[116] Commentary: “Dealing with Greek Debt Needs a Radical Rethink – Lessons From Japan.” By Andre Spicer (Professor of Organisational Behaviour, Cass Business School, City, University of London). The Conversation, August 12, 2015. <theconversation.com>
Why, I asked myself, should Greece be on its knees, while Japan appeared to be quietly performing well? As I started to dig, I discovered a few important differences. …
The next big difference from Greece is that Japan has control over its own monetary policy. If it wants to start printing money, it can. Thus, the Bank of Japan has been printing money to buy government debt, helping turn its public debt burden into an illusion. Greece, in contrast, does not have this option. Tied as it is to the eurozone, it cannot decrease the value of its currency in order to make its debt cheaper and exports more attractive. …
As Japan shows, living with high levels of debt does not have to be the Greek tragedy we have seen in recent months and it’s time to get out of the one-way street of austerity.
[117] Dataset: “Central Government Debt, Total (% of GDP) for Japan.” Federal Reserve Bank of St. Louis. Updated November 2, 2021. <fred.stlouisfed.org>
“Units: Percent of GDP [gross domestic product] … 1990 [=] 52.89407% … 2000 [=] 98.82630% … 2010 [=] 160.63447% … 2016 [=] 193.39393%”
[118] Report: “Greece’s Debt Crisis: Overview, Policy Responses, and Implications.” By Rebecca M. Nelson, Paul Belkin, and Derek E. Mix. Congressional Research Service, August 18, 2011. <fas.org>
Pages 4–5:
Starting in 2009, investor confidence in Greece’s ability to service its debt dropped significantly. The global financial crisis of 2008–2009 and the related economic downturn strained the public finances of many advanced economies, including Greece, as government spending on programs, such unemployment benefits, increased and tax revenues weakened. Greece’s reported public debt rose from 106% of GDP [gross domestic product] in 2006 to 126% of GDP in 2009.10
Additionally, in late 2009, the new government, led by Prime Minister George Papandreou, revealed that previous Greek governments had been under-reporting the budget deficit. The new government revised the estimate of 2009 budget deficit from 6.7% of GDP to 12.7% of GDP.11 This was shortly followed by rating downgrades of Greek bonds by major credit rating agencies. Allegations that Greek governments had attempted to obscure debt levels through complex financial instruments contributed further to a drop in investor confidence.12 Greece’s 2009 budget deficit was subsequently revised upwards a number of times, finally to 15.4% of GDP.
As investors became increasingly nervous that the Greek government’s debt was too high, and that it would default on its debt, they started demanding higher interest rates for buying and holding Greek bonds (see Figure 2). Higher interest rates compensated investors for the higher risk involved in holding Greek government bonds, but they also drove up Greece’s borrowing costs, exacerbated its debt levels, and caused Greece to veer towards default.
[119] Calculated with the dataset: “Household Final Consumption Expenditure Per Capita (Constant 2015 US$).” World Bank, February 15, 2022. Accessed April 4, 2022 at <data.worldbank.org>
Household final consumption expenditure is the market value of all goods and services, including durable products (such as cars, washing machines, and home computers), purchased by households. It excludes purchases of dwellings but includes imputed rent for owner-occupied dwellings. It also includes payments and fees to governments to obtain permits and licenses. Here, household consumption expenditure includes the expenditures of nonprofit institutions serving households, even when reported separately by the country. Data are in constant 2015 U.S. dollars.
NOTE: An Excel file containing the data and calculations is available upon request.
[120] News release: “Gross Domestic Product: Second Quarter 2018 (Third Estimate) Corporate Profits: Second Quarter 2018 (Revised Estimate).” Bureau of Economic Analysis, September 27, 2018. <www.bea.gov>
Page 4:
Gross domestic product (GDP) is the value of the goods and services produced by the nation’s economy less the value of the goods and services used up in production. GDP is also equal to the sum of personal consumption expenditures, gross private domestic investment, net exports of goods and services, and government consumption expenditures and gross investment.
[121] Book: Economics: Principles and Policy (12th edition). By William Baumol and Alan Blinder. South-Western Cengage Learning, 2011.
Page 491:
To sharpen the point, observe that real GDP [gross domestic product] is, by definition, the product of the total hours of work in the economy times the amount of output produced per hour—what we have just called labor productivity:
GDP = Hours of work × Output per hour = Hours worked × Labor productivity
For example, in the United States today, in round numbers, GDP is about $15 trillion and total hours of work per year are about 230 billion. Thus labor productivity is roughly $15 trillion/230 billion hours, or about $65 per hour.
[122] Textbook: Macroeconomics for Today (6th edition). By Irvin B. Tucker. South-Western Cengage Learning, 2010.
Page 530: “GDP [gross domestic product] per capita provides a general index of a country’s standard of living. Countries with low GDP per capita and slow growth in GDP per capita are less able to satisfy basic needs for food, shelter, clothing, education, and health.”
[123] Report: “International Comparisons of GDP Per Capita and Per Hour, 1960–2011.” U.S. Department of Labor, Bureau of Labor Statistics, November 7, 2012. <www.bls.gov>
Page 1: “GDP per capita, when converted to U.S. dollars using purchasing power parities, is the most widely used income measure for international comparisons of living standards.”
Page 2:
Gross Domestic Product (GDP) is defined as the value of all market and some nonmarket goods and services produced within a country’s geographic borders. As such, it is the most comprehensive measure of a country’s economic output that is estimated by statistical agencies. GDP per capita may therefore be viewed as a rough indicator of a nation’s economic well-being, while GDP per hour worked can provide a general picture of a country’s productivity.
[124] Calculated with data from:
a) Webpage: “Debt to the Penny.” U.S. Department of the Treasury, Bureau of the Fiscal Service. Accessed March 31, 2011 at <fiscaldata.treasury.gov>
b) Dataset: “Table 1.1.5. Gross Domestic Product.” U.S. Department of Commerce, Bureau of Economic Analysis. Last revised March 25, 2011. <apps.bea.gov>
CALCULATIONS:
|
Quarter |
Debt (billions) |
GDP (billions) |
Debt/GDP |
|
2009-Q4 |
$12,311.3 |
$14,277.3 |
86% |
|
2010-Q1 |
$12,773.1 |
$14,446.4 |
88% |
|
2010-Q2 |
$13,203.5 |
$14,578.7 |
91% |
|
2010-Q3 |
$13,561.6 |
$14,745.1 |
92% |
|
2010-Q4 |
$14,025.2 |
$14,871.4 |
94% |
[125] Calculated with data from the paper: “Public Debt Overhangs: Advanced-Economy Episodes Since 1800.” By Carmen M. Reinhart (University of Maryland), Vincent R. Reinhart (chief U.S. economist at Morgan Stanley), and Kenneth S. Rogoff (Harvard University). Journal of Economic Perspectives, Summer 2012. Pages 69–86. <online.wsj.com>
Page 69:
Following Reinhart and Rogoff (2010), we select stretches where gross public debt exceeds 90 percent of nominal GDP on a sustained basis. Such public debt overhang episodes are associated with lower growth than during other periods. Even more striking, among the 26 episodes we identify, 20 lasted more than a decade. The long duration belies the view that the correlation is caused mainly by debt buildups during business cycle recessions. The long duration also implies that the cumulative shortfall in output from debt overhang is potentially massive. These growth-reducing effects of high public debt are apparently not transmitted exclusively through high real interest rates, in that in eleven of the episodes, interest rates are not materially higher.
Page 70:
In this paper, we use the long-dated cross-country data on public debt developed by Reinhart and Rogoff (2009) to examine the growth and interest rates associated with prolonged periods of exceptionally high public debt, defined as episodes where public debt to GDP exceeded 90 percent for at least five years. (The basic results here are reasonably robust to choices other than 90 percent as the critical threshold, as in Reinhart and Rogoff 2010a, b).1 Over the years 1800–2011, we find 26 such episodes across the advanced economies. … While data limitations may have prevented us from including every episode of high public debt in advanced economies since 1800, we are confident that this list encompasses the preponderance of such episodes. To focus on the association between high debt and long-term growth, we only cursorily treat shorter episodes lasting under five years, of which there turn out to be only a few. The long length of typical public debt overhang episodes suggests that even if such episodes are originally caused by a traumatic event such as a war or financial crisis, they can take on a self-propelling character.
Consistent with a small but growing body of research, we find that the vast majority of high debt episodes—23 of the 26—coincide with substantially slower growth. On average across individual countries, debt/GDP [gross domestic product] levels above 90 percent are associated with an average annual growth rate 1.2 percent lower than in periods with debt below 90 percent debt; the average annual levels are 2.3 percent during the periods of exceptionally high debt versus 3.5 percent otherwise.
Pages 81–82:
We would not claim that the cause-and-effect problems involved in determining how public debt overhang affects economic growth have been definitively addressed. But the balance of the existing evidence certainly suggests that public debt above a certain threshold leads to a rate of economic growth that is perhaps 1 percentage point slower per year. In addition, the 26 episodes of public debt overhang in our sample had an average duration of 23 years, so the cumulative effect of annual growth being 1 percentage point slower would be a GDP that is roughly one-fourth lower at the end of the period. … Last but not least, those who are inclined to the belief that slow growth is more likely to be causing high debt, rather than vice versa, need to better reconcile their beliefs with the apparent nonlinearity of the relationship, in which correlation is relatively low at low levels of debt but rises markedly when debt/GDP ratios exceed the 90 percent threshold.
CALCULATION: (3.5 – 2.3) / 3.5 = 34%
[126] Paper: “Growth in a Time of Debt.” By Carmen M. Reinhart (University of Maryland) and Kenneth S. Rogoff (Harvard University). American Economic Review, May 2010. Pages 573–578. <scholar.harvard.edu>
Page 575:
Table 1 provides detail on the growth experience for individual countries, but over a much longer period, typically one to two centuries. Interestingly, introducing the longer time-series yields remarkably similar conclusions. Over the past two centuries, debt in excess of 90 percent has typically been associated with mean growth of 1.7 percent versus 3.7 percent when debt is low (under 30 percent of GDP), and compared with growth rates of over 3 percent for the two middle categories (debt between 30 and 90 percent of GDP). Of course, there is considerable variation across the countries, with some countries such as Australia and New Zealand experiencing no growth deterioration at very high debt levels. It is noteworthy, however, that those high-growth high-debt observations are clustered in the years following World War II.
[127] Commentary: “Too Much Debt Means the Economy Can’t Grow.” By Carmen M. Reinhart & Kenneth S. Rogoff. Bloomberg News, July 14, 2011. <www.bloomberg.com>
“We aren’t suggesting there is a bright red line at 90 percent; our results don’t imply that 89 percent is a safe debt level, or that 91 percent is necessarily catastrophic. Anyone familiar with doing empirical research understands that vulnerability to crises and anemic growth seldom depends on a single factor such as public debt.”
[128] Working paper: “Does High Public Debt Consistently Stifle Economic Growth? A Critique of Reinhart and Rogoff.” By Thomas Herndon, Michael Ash, and Robert Pollin. Political Economy Research Institute, University of Massachusetts Amherst, April 15, 2013. Revised 4/22/13. <www.peri.umass.edu>
[129] Search: (“90%” OR “90 percent”) debt (Amherst OR “Political Economy Research Institute”). Google, June 25, 2020. Date delimited from April 15, 2013 to May 5, 2013. <www.google.com>
NOTES:
[130] Working paper: “Does High Public Debt Consistently Stifle Economic Growth? A Critique of Reinhart and Rogoff.” By Thomas Herndon, Michael Ash, and Robert Pollin. Political Economy Research Institute, University of Massachusetts Amherst, April 15, 2013. Revised 4/22/13. <www.peri.umass.edu>
Page 1: “Our finding is that when properly calculated, the average real GDP [gross domestic product] growth rate for countries carrying a public-debt-to-GDP ratio of over 90 percent is actually 2.2 percent, not –0.1 percent as published in Reinhart and Rogoff [RR]. That is, contrary to RR, average GDP growth at public debt/GDP ratios over 90 percent is not dramatically different than when debt/GDP ratios are lower.”
[131] Calculated with data from the working paper: “Does High Public Debt Consistently Stifle Economic Growth? A Critique of Reinhart and Rogoff.” By Thomas Herndon, Michael Ash, and Robert Pollin. Political Economy Research Institute, April 15, 2013. Revised 4/22/13. <www.peri.umass.edu>
Page 1: “Our finding is that when properly calculated, the average real GDP growth rate for countries carrying a public-debt-to-GDP ratio of over 90 percent is actually 2.2 percent, not –0.1 percent as published in Reinhart and Rogoff [RR]. That is, contrary to RR, average GDP growth at public debt/GDP ratios over 90 percent is not dramatically different than when debt/GDP ratios are lower.”
Page 10:
Summary: Years, Spreadsheet, Weighting, and Transcription
Table 3 summarizes the errors in RR and their effect on the estimates of average real GDP growth in each public debt/GDP category. Some of the errors have strong interactive effects. Table 3 shows the effect of each possible interaction of the spreadsheet error, selective year exclusion, and country weighting.
The errors have relatively small effects on measured average real GDP growth in the lower three public debt/GDP categories. GDP growth in the lowest public debt/GDP category is roughly 4 percent per year and in the next two categories is around 3 percent per year with or without correcting the errors.
In the over-90-percent public debt/GDP category, however, the effects of the errors are substantial. For example, the impact of the excluded years for New Zealand is greatly amplified when equal country weighting assigns 14.3 percent (1/7) of the weight for the average to the single year in which New Zealand is included in the above-90-percent public debt/GDP group. This one year is when GDP growth in New Zealand was –7.6 percent. The exclusion of years coupled with the country—as opposed to country-year—weighting alone accounts for almost –2 percentage points of under-measured GDP growth. The spreadsheet and transcription errors account for an additional –0.4 percentage point. In total, as we show in Table 3, actual average real growth in the high public debt category is +2.2 percent per year compared to the –0.1 percent per year published in RR. The actual gap between the highest and next highest debt/GDP categories is 1.0 percentage point (i.e., 3.2 percent less 2.2 percent). In other words, with their estimate that average GDP growth in the above-90-percent public debt/GDP group is –0.1 percent, RR overstates the gap by 2.3 percentage points or a factor of nearly two and a half.
Page 21:
Table 3: Published and replicated average real GDP growth, by public debt/GDP category
|
Method/Source |
Public Debt/GDP Category |
|||
|
Below 30% |
30 to 60% |
60 to 90% |
90% and above |
|
|
Corrected Results Country-Year Weighting, All Data |
4.2 |
3.1 |
3.2 |
2.2 |
CALCULATIONS: 90% and above compared to:
[132] Calculated with data from the paper: “Public Debt Overhangs: Advanced-Economy Episodes Since 1800.” By Carmen M. Reinhart (University of Maryland), Vincent R. Reinhart (chief U.S. economist at Morgan Stanley), and Kenneth S. Rogoff (Harvard University). Journal of Economic Perspectives, Summer 2012. Pages 69–86. <online.wsj.com>
Page 70:
Consistent with a small but growing body of research, we find that the vast majority of high debt episodes—23 of the 26—coincide with substantially slower growth. On average across individual countries, debt/GDP [gross domestic product] levels above 90 percent are associated with an average annual growth rate 1.2 percent lower than in periods with debt below 90 percent debt; the average annual levels are 2.3 percent during the periods of exceptionally high debt versus 3.5 percent otherwise.
CALCULATION: (3.5 – 2.3) / 3.5 = 34%
[133] Calculated with data from the commentary: “Debt and Growth: A Response to Reinhart and Rogoff.” By Robert Pollin and Michael Ash. New York Times, April 29, 2013. <www.nytimes.com>
Ms. Reinhart and Mr. Rogoff have published several other papers, including a 2010 academic article, “Growth in a Time of Debt.” It found that economic growth was notably lower when a country’s gross public debt equaled or exceeded 90 percent of its gross domestic product.
Earlier this month, we posted a working paper, co-written with Thomas Herndon, finding fault with this conclusion. We identified a spreadsheet coding error—which Ms. Reinhart and Mr. Rogoff promptly acknowledged—that affected their calculations of growth rates for big economies since World War II. We also asserted that the two of them erred by omitting some data and improperly weighting other statistics. In an Op-Ed essay and appendix last week, Ms. Reinhart and Mr. Rogoff denied those accusations. …
However, Ms. Reinhart and Mr. Rogoff stubbornly maintain that “growth is about 1 percentage point lower when debt is 90 percent or more of gross domestic product,” a core finding of their 2010 paper. …
There are serious problems with this claim. The most obvious is that the median growth figures they reported in the 2010 paper are distorted by the same coding error and partial exclusion of data from Australia, Canada and New Zealand that tainted their average growth figures. When we corrected for these errors, the difference in median economic growth rates was only 0.4 percentage points between countries whose public-debt-to-G.D.P. ratio was between 60 percent and 90 percent, and those where the ratio was over 90 percent (2.9 percent median growth, versus 2.5 percent). The difference between 0.4 percent and 1 percent is quite substantial when we’re talking about national economic growth.
CALCULATION: 1%– 0.4% = 0.6%
[134] Calculated with data from the working paper: “Does High Public Debt Consistently Stifle Economic Growth? A Critique of Reinhart and Rogoff.” By Thomas Herndon, Michael Ash, and Robert Pollin. Political Economy Research Institute, April 15, 2013. Revised 4/22/13. <www.peri.umass.edu>
Page 1: “Our finding is that when properly calculated, the average real GDP [gross domestic product] growth rate for countries carrying a public-debt-to-GDP ratio of over 90 percent is actually 2.2 percent, not –0.1 percent as published in Reinhart and Rogoff [RR]. That is, contrary to RR, average GDP growth at public debt/GDP ratios over 90 percent is not dramatically different than when debt/GDP ratios are lower.”
Page 10: “The actual gap between the highest and next highest debt/GDP categories is 1.0 percentage point (i.e., 3.2 percent less 2.2 percent).”
CALCULATION: (3.2 – 2.2 ) / 3.2 = 31%
[135] Paper: “Growth in a Time of Debt.” By Carmen M. Reinhart (University of Maryland) and Kenneth S. Rogoff (Harvard University). American Economic Review, May 2010. Pages 573–578. <scholar.harvard.edu>
Page 1:
In this paper, we exploit a new multi-country historical dataset on public (government) debt to search for a systemic relationship between high public debt levels, growth and inflation.1 Our main result is that whereas the link between growth and debt seems relatively weak at “normal” debt levels, median growth rates for countries with public debt over roughly 90 percent of GDP [gross domestic product] are about one percent lower than otherwise; average (mean) growth rates are several percent lower.
[136] Paper: “Public Debt Overhangs: Advanced-Economy Episodes Since 1800.” By Carmen M. Reinhart (University of Maryland), Vincent R. Reinhart (chief U.S. economist at Morgan Stanley), and Kenneth S. Rogoff (Harvard University). Journal of Economic Perspectives, Summer 2012. Pages 69–86. <online.wsj.com>
Page 70:
Consistent with a small but growing body of research, we find that the vast majority of high debt episodes—23 of the 26—coincide with substantially slower growth. On average across individual countries, debt/GDP [gross domestic product] levels above 90 percent are associated with an average annual growth rate 1.2 percent lower than in periods with debt below 90 percent debt; the average annual levels are 2.3 percent during the periods of exceptionally high debt versus 3.5 percent otherwise.
Pages 81–82:
We would not claim that the cause-and-effect problems involved in determining how public debt overhang affects economic growth have been definitively addressed. But the balance of the existing evidence certainly suggests that public debt above a certain threshold leads to a rate of economic growth that is perhaps 1 percentage point slower per year.
[137] Email from Jim Agresti of Just Facts to Michael Ash of the Political Economy Research Institute, May 7, 2013.
Our institute has published initial research on this issue, and I am writing to make you aware of it in case you would like to respond: <www.justfactsdaily.com>
You’ve been very kind to reply to me several times, and thus, I feel bad about being hard on your research, but our mission is to present the facts, regardless of where they lead. I look forward to further constructive dialogue in pursuit of the truth on this issue.
[138] Paper: “Does High Public Debt Consistently Stifle Economic Growth? A Critique of Reinhart and Rogoff.” By Thomas Herndon, Michael Ash, and Robert Pollin. Cambridge Journal of Economics, March 2014, Pages 257–279. <doi.org>
Page 257 (Summary):
Contrary to Reinhart and Rogoff’s broader contentions, both mean and median GDP [gross domestic product] growth when public debt levels exceed 90% of GDP are not dramatically different from when the public debt/GDP ratios are lower. The relationship between public debt and GDP growth varies significantly by period and country. Our overall evidence refutes RR’s claim that public debt/GDP ratios above 90% consistently reduce a country’s GDP growth.
Page 269:
Table 5: HAP [Herndon, Ash, Pollin] recalculated GDP growth rates with RR [Reinhart and Rogoff] calculated figures (percentages for 1946–2009 time period
|
Method/Source |
Public Debt/GDP Category |
|||
|
≤ 30% |
30–60% |
60–90% |
>90% |
|
|
Recalculated Results All Data with Country–Year Weighting |
4.2 |
3.1 |
3.2 |
2.2 |
NOTES:
[139] Calculated with the dataset: “Interest Expense on the Public Debt Outstanding.” U.S. Treasury, Bureau of the Fiscal Service. Accessed May 3, 2023 at <fiscaldata.treasury.gov>
NOTES:
[140] Calculated with the dataset: “Monthly Population Estimates for the United States: April 1, 2020 to December 1, 2023.” U.S. Census Bureau, Population Division, December 2022. <www2.census.gov>
“Resident Population … July 1, 2022 [=] 333,287,557”
CALCULATION: $774,679,343,619 / 333,287,557 people = $2,324 /person
[141] Calculated with the dataset: “HH-1. Households by Type: 1940 to Present.” U.S. Census Bureau, Current Population Survey, November 2022. <www.census.gov>
“(numbers in thousands) … Total households … 2022 [=] 131,202
CALCULATION: $774,679,343,619 / 131,202,000 households = $5,904 / household
[142] Calculated with the dataset: “Table 3.2. Federal Government Current Receipts and Expenditures (Billions of Dollars).” United States Department of Commerce, Bureau of Economic Analysis. Last revised March 30, 2023. <apps.bea.gov>
“Total expenditures … 2022 [=] $6,168.4”
CALCULATION: $774,679,343,619 interest / $6,168,400,000,000 total receipts = 12.6%
[143] Calculated with the dataset: “Table 3.2. Federal Government Current Receipts and Expenditures (Billions of Dollars).” United States Department of Commerce, Bureau of Economic Analysis. Last revised March 30, 2023. <apps.bea.gov>
“Total receipts … 2022 [=] 5,058.6”
CALCULATION: $774,679,343,619 interest / $5,058,600,000,000 total receipts = 15.3%
[144] Calculated with the dataset: “Table 3.2. Federal Government Current Receipts and Expenditures (Billions of Dollars).” United States Department of Commerce, Bureau of Economic Analysis. Last revised March 30, 2023. <apps.bea.gov>
“Taxes on corporate income … 2022 [=] 335.0”
CALCULATION: $774,679,343,619 interest / $335,000,000,000 corporate income tax receipts = 2.3
[145] Calculated with the dataset: “Table 3.16. Government Current Expenditures by Function [Billions of Dollars].” U.S. Department of Commerce, Bureau of Economic Analysis. Last revised November 17, 2023. <apps.bea.gov>
Line item 70: “Education … 2022 [=] 179.1”
CALCULATION: $774,679,343,619 interest / $179,100,000,000 federal education expenditure = 4.3
[146] Calculated with data from the report: “Final Monthly Treasury Statement.” U.S. Department of the Treasury, Bureau of the Fiscal Service, October 12, 2022. Updated 12/19/22. <fiscal.treasury.gov>
Page 1: “Receipts and Outlays of the United States Government For Fiscal Year 2022 Through September 30, 2022, and Other Periods.”
Page 11: “Table 5. Outlays of the U.S. Government, September 2022 and Other Periods [$ millions] … Current Fiscal Year to Date … Outlays … Supplemental Nutrition Assistance Program [=] 148,514.”
CALCULATION: $774,679,343,619 interest / $148,514,000,000 expense = 3.9
NOTE: The available data on the federal SNAP expenditure is for the federal government’s 2022 fiscal year, which was October 1, 2021 to September 30, 2022.
[147] Calculated with data from: “Fiscal Year 2024 Historical Tables: Budget Of The U.S. Government.” White House Office of Management and Budget, March 9, 2023. <www.whitehouse.gov>
“Table 3.2—Outlays by Function and Subfunction: 1962–2028 (in Millions of Dollars).” <www.whitehouse.gov>
“Table 1.1—Summary of Receipts, Outlays, and Surpluses or Deficits (–): 1789–2028 (in Millions of Dollars).” <www.whitehouse.gov>
NOTE: An Excel file containing the data and calculations is available upon request.
[148] Report: “How Treasury Issues Debt.” By Grant A. Driessen. Congressional Research Service, August 18, 2016. <fas.org>
Page 19:
Interest paid on the federal debt increases the overall cost of borrowing. … If interest rates are low, interest payments on Treasury securities may also be low, thereby making debt less costly. However, increased borrowing will increase the supply of Treasury securities, which generally leads to higher interest rates and future net interest payments.
Despite the recent increases in federal borrowing during the recent economic recession and subsequent recovery, the actions of the Fed have kept interest rates near zero since late 2008. Therefore, borrowing costs to the Treasury currently remain low.
[149] Report: “The Budget and Economic Outlook: 2018 to 2028.” Congressional Budget Office, April 2018. <www.cbo.gov>
Page 62: “Although several factors affect the federal government’s net interest costs—such as the rate of inflation for Treasury inflation-protected securities and the maturity structure of outstanding securities (for example, longer-term securities generally yield higher interest)—its primary drivers are the amount of debt held by the public and interest rates on Treasury securities.”
[150] Report: “The 2014 Long-Term Budget Outlook.” Congressional Budget Office, July 2014. <www.cbo.gov>
Page 14: “When the federal debt is large, the government ordinarily must make substantial interest payments to its lenders, and growth in the debt causes those interest payments to increase.”
Page 21: “The growth in net interest payments and debt is mutually reinforcing: Rising interest payments push up deficits and debt, and rising debt pushes up interest
payments.”
[151] Report: “The 2014 Long-Term Budget Outlook.” Congressional Budget Office, July 2014. <www.cbo.gov>
Page 14:
When the federal debt is large, the government ordinarily must make substantial interest payments to its lenders, and growth in the debt causes those interest payments to increase. (Net interest payments are currently fairly small relative to the size of the economy because interest rates are exceptionally low, but CBO [Congressional Budget Office] anticipates that those payments will increase considerably as interest rates return to more typical levels.)
[152] Report: “The 2022 Long-Term Budget Outlook.” Congressional Budget Office, July 2022. <www.cbo.gov>
Pages 20–21:
Net Interest Costs
Over the past 50 years, the government’s net interest costs have ranged from 1.2 percent to 3.2 percent of GDP, averaging 2.0 percent of GDP. In CBO’s projections, net interest costs are 1.6 percent of GDP in 2022. By 2032, those costs double, reaching 3.3 percent of GDP, as federal debt grows and interest rates rise.
Net interest costs continue to rise thereafter, reaching 7.2 percent of GDP in 2052. They would be higher in that year than spending on Social Security, discretionary spending, or all mandatory spending other than that for the major health care programs and Social Security—and higher than at any time since at least 1940 (the first year for which the Office of Management and Budget reports such data).11
The increase in interest payments is the result of escalating interest rates and the rising level of debt. CBO estimates that the increase in interest rates accounts for about one-half of the projected growth in net outlays for interest over the 2022–2052 period.12
[153] Calculated with data from:
a) “Fiscal Year 2024 Historical Tables: Budget Of The U.S. Government.” White House Office of Management and Budget, March 9, 2023. <www.whitehouse.gov>
“Table 3.2—Outlays by Function and Subfunction: 1962–2028 (in Millions of Dollars).” <www.whitehouse.gov>
b) Dataset: “Historical Debt Outstanding—Annual, 1962–2022.” U.S. Treasury, Bureau of the Fiscal Service. Last updated October 4, 2022. <www.treasurydirect.gov>
NOTE: An Excel file containing the data and calculations is available upon request.
[154] Calculated with data from:
a) Reports: “Schedules of Federal Debt.” U.S. Treasury, Bureau of the Fiscal Service. Accessed March 9, 2023 at <fiscaldata.treasury.gov>
Page 3 (of PDF): “Note 4. Interest Expense”
b) Report: “Financial Audit: Bureau of the Fiscal Service’s Fiscal Years 2022 and 2021 Schedules of Federal Debt.” United States Government Accountability Office, November 8, 2022. <www.gao.gov>
Page 38: “Note 4. Interest Expense”
c) Webpage: “Debt to the Penny.” U.S. Treasury, Bureau of the Fiscal Service. Accessed March 27, 2023 at <fiscaldata.treasury.gov>
NOTE: An Excel file containing the data and calculations is available upon request.
[155] Report: “How Treasury Issues Debt.” By Grant A. Driessen. Congressional Research Service, August 18, 2016. <fas.org>
Page 16: “[Debts issued] to finance the operations of the federal government, are offered at a mix of maturities…. Longer-term securities generally command higher interest rates compared to shorter-term securities because investors demand greater compensation for incurring risk over a longer period of time.”
[156] Article: “Interest Rates.” By Burton G. Malkiel. The Concise Encyclopedia of Economics, 2008. <www.econlib.org>
In general, lenders demand a higher rate of interest for loans of longer maturity. …
The longer the period to maturity of the bond, the greater is the potential fluctuation in price when interest rates change.
If you hold a bond to maturity, you need not worry if the price bounces around in the interim. But if you have to sell prior to maturity, you may receive less than you paid for the bond. The longer the maturity of the bond, the greater is the risk of loss because long-term bond prices are more volatile than shorter-term issues. To compensate for that risk of price fluctuation, longer-term bonds usually have higher interest rates than shorter-term issues.
[157] Article: “Interest Rate Risk—When Interest Rates Go Up, Prices of Fixed-Rate Bonds Fall.” U.S. Securities and Exchange Commission, Office of Investor Education and Advocacy, June 1, 2013. <www.sec.gov>
Page 4:
The Effect of Maturity on Interest Rate Risk and Coupon Rates
A bond’s maturity is the specific date in the future at which the face value of the bond will be repaid to the investor. A bond may mature in a few months or in a few years. Maturity can also affect interest rate risk. The longer the bond’s maturity, the greater the risk that the bond’s value could be impacted by changing interest rates prior to maturity, which may have a negative effect on the price of the bond. Therefore, bonds with longer maturities generally have higher interest rate risk than similar bonds with shorter maturities. …
To compensate investors for this interest rate risk, long-term bonds generally offer higher coupon rates than short-term bonds of the same credit quality.
[158] Book: The Federal Reserve System Purposes & Functions (10th edition). Board of Governors of the Federal Reserve System, October 2016.
Chapter 3: “Function: Conducting Monetary Policy.” <www.federalreserve.gov>
Page 25: “When inflation is low and stable, individuals can hold money without having to worry that high inflation will rapidly erode its purchasing power. … Longer-term interest rates are also more likely to be moderate when inflation is low and stable. … [I]f inflation persisted near zero, short-term interest rates would likely also be quite low….”
[159] Report: “The Budget and Economic Outlook: 2017 to 2027.” Congressional Budget Office, January 2017. <www.cbo.gov>
Page 80:
Inflation also has an impact on outlays for net interest because it affects interest rates. If inflation was 1 percentage point higher than CBO [Congressional Budget Office] projects, for example, then interest rates would be 1 percentage point higher (all else being equal). As a result, new federal borrowing would incur higher interest costs, and outstanding inflation-indexed securities would be more costly for the federal government.
[160] Article: “Inflation and the Real Value of Debt: A Double-Edged Sword.” By Christopher J. Neely. Federal Reserve Bank of St. Louis, On the Economy, August 1, 2022. <www.stlouisfed.org>
An increase in the price level directly reduces the real value of government debt, as well as the ratio of debt to GDP [gross domestic product], because—holding other things constant—higher prices increase nominal GDP. Thus, surprise inflation transfers wealth from holders of U.S. government debt—who include both Americans and non-Americans—to U.S. taxpayers.3
This transfer is not an unalloyed good even for U.S. taxpayers, however, because unexpected inflation will tend to raise the cost of servicing future U.S. debt—i.e., nominal yields—by increasing the expected rate of inflation and the risk premium associated with inflation.
[161] Book: Is U.S. Government Debt Different? Edited by Franklin Allen and others. Penn Law, Wharton, FIC Press, 2012. <finance.wharton.upenn.edu>
Chapter 5: “Origins of the Fiscal Constitution.” By Michael W. McConnell (Director of the Constitutional Law Center at Stanford Law School). Pages 45–53.
Pages 49–50:
Section Four of the Amendment states: “The validity of the public debt of the United States, authorized by law, including debts incurred for payment of pensions and bounties for services in suppressing insurrection or rebellion, shall not be questioned.” This was designed to prevent a southern Democratic majority from repudiating the Civil War debt. … The Supreme Court has interpreted the provision only once, in Perry v. United States2, the so-called Gold Clause Cases. The Court allowed Congress to renege on its contractual agreement to pay the debt in gold; this is when U.S. public debt became denominated in dollars. Effectively, this means that even if Section Four forbids Congress to declare a formal default, it could accomplish much the same thing by inflating the debt away.
[162] “Minutes of the Federal Open Market Committee, June 12–13, 2018.” Board of Governors of the Federal Reserve System, July 5, 2018.
Page 5:
Figure 3.E provides the distribution of participants’ judgments regarding the appropriate target—or midpoint of the target range—for the federal funds rate at the end of each year from 2018 to 2020 and over the longer run. The distributions of projected policy rates through 2020 shifted modestly higher, consistent with the revisions to participants’ projections of real GDP [gross domestic product] growth, the unemployment rate, and inflation.
Page 6:
Incoming data suggested that GDP [gross domestic product] growth strengthened in the second quarter of this year, as growth of consumer spending picked up after slowing earlier in the year. … They also generally expected that further gradual increases in the target range for the federal funds rate would be consistent with sustained expansion of economic activity, strong labor market conditions, and inflation near the Committee’s symmetric 2 percent objective over the medium term.
[163] Speech: “Why Are Interest Rates So Low? Causes and Implications.” By Stanley Fischer. Board of Governors of the Federal Reserve System, October 17, 2016. <www.federalreserve.gov>
One theme that will emerge is that depressed long-term growth prospects put sustained downward pressure on interest rates. …
Lower long-run trend productivity growth, and thus lower trend output growth, affects the balance between saving and investment through a variety of channels. A slower pace of innovation means that there will be fewer profitable opportunities in which to invest, which will tend to push down investment demand. Lower productivity growth also reduces the future income prospects of households, lowering their consumption spending today and boosting their demand for savings. Thus, slower productivity growth implies both lower investment and higher savings, both of which tend to push down interest rates.5
[164] Report: “Analytical Perspectives: Budget of the U.S. Government, Fiscal Year 2018.” White House Office of Management and Budget, May 23, 2017. <www.govinfo.gov>
Page 12: “As growth increases, the Administration expects that interest rates will begin to rise to values more consistent with historical experience. … Economic theory suggests that real GDP [gross domestic product] growth rates and interest rates are positively correlated, so interest rates are likely to be propelled higher by the stronger growth that the Administration anticipates.”
NOTE: It is important to realize that association does not prove causation, and it is often difficult to determine causation in economics and other social sciences. This is because numerous variables might affect a certain outcome, and there is frequently no objective way to identify all of these factors and determine which is causing the others and to what degree.
[165] Report: “A Citizen’s Guide to the Federal Budget: Budget of the United States Government, Fiscal Year 1998.” White House Office of Management and Budget, February 6, 1997. <fraser.stlouisfed.org>
Page 23:
The deficit forces the Government to borrow money in the private capital markets. That borrowing competes with (1) borrowing by businesses that want to build factories and machines that make workers more productive and raise incomes, and (2) borrowing by families who hope to buy new homes, cars, and other goods. The competition for funds tends to produce higher interest rates.
[166] Article: “Projections of Interest Rates.” By Edward Gamber. Congressional Budget Office, February 1, 2017. <www.cbo.gov>
“Other factors are projected to push real interest rates up from their earlier average…. Federal debt is projected to be higher as a percentage of GDP [gross domestic product], increasing the supply of Treasury securities.”
[167] Report: “How Treasury Issues Debt.” By Grant A. Driessen. Congressional Research Service, August 18, 2016. <fas.org>
Page 19: “[I]ncreased borrowing will increase the supply of Treasury securities, which generally leads to higher interest rates and future net interest payments.”
[168] Paper: “New Evidence on the Interest Rate Effects of Budget Deficits and Debt.” By Thomas Laubach. Board of Governors of the Federal Reserve System, May 2003. <www.federalreserve.gov>
Page 1 (of PDF): “The estimated effects of government debt and deficits on interest rates are statistically and economically significant: a one percentage point increase in the projected deficit-to-GDP [gross domestic product] ratio is estimated to raise long-term interest rates by roughly 25 basis points.”
[169] Report: “Analytical Perspectives: Budget of the U.S. Government, Fiscal Year 2018.” White House Office of Management and Budget. <www.govinfo.gov>
Page 40:
If Treasury were unable to make timely interest payments or redeem securities, investors would cease to view U.S. Treasury securities as free of credit risk and Treasury’s interest costs would increase. … Foreign investors would likely shift out of dollar-denominated assets, driving down the value of the dollar and further increasing interest rates on non-Federal, as well as Treasury, debt.
[170] Report: “A Debt Crisis in America: What It Might Look Like.” U.S. Congress, House Budget Committee, February 22, 2013. <republicans-budget.house.gov>
Page 4:
In recent years, foreigners have flocked to Treasury debt in a “flight to quality,” which helped to keep U.S. borrowing rates at record low levels. But these investment flows work both ways, as Europe’s debt crisis illustrates. As risk perceptions change, particularly with regard to sovereign credit, investors could seek to avoid U.S. debt, thereby helping to drive up interest rates.
[171] Report: “The Long-Term Budget Outlook.” Congressional Budget Office, June 2010 (Revised August 2010). <www.cbo.gov>
Page xi: “Over time, higher debt would increase the probability of a fiscal crisis in which investors would lose confidence in the government’s ability to manage its budget, and the government would be forced to pay much more to borrow money.”
[172] Article: “Projections of Interest Rates.” By Edward Gamber. Congressional Budget Office, February 1, 2017. <www.cbo.gov>
[Congressional Budget Office] also expects the demand for Treasury securities relative to the demand for risky assets to be higher than its 1990–2007 average. That relatively higher demand for Treasury securities implies higher prices and therefore lower interest rates. …
… Current prices in financial markets indicate that investors expect short-term interest rates to rise only gradually and to remain low, possibly because they expect certain forces putting downward pressure on interest rates in the United States to persist over the next decade. One force is weakness in global financial and monetary conditions, which has resulted in a flight to low-risk securities and currencies, especially U.S. Treasury securities.
[173] According to the law of supply and demand, “if demand increases, while supply remains constant, prices will rise.”† When it comes to federal debt, price increases mean lower interest rates.‡ Lending money to the federal government is considered to be the lowest-risk investment in the world because the payments are “backed by the full faith and credit of the U.S. government.”§ When there is financial uncertainty, investors prefer lower-risk assets in a “flight to quality.”# The increased demand to purchase low-risk assets during and after the Great Recession of 2007 was large enough to outweigh the increased supply of U.S. debt, which contributed to higher prices (lower interest rates) during that period.£
NOTES:
[174] Report: “The 2014 Long-Term Budget Outlook.” Congressional Budget Office, July 2014. <www.cbo.gov>
Page 108:
In CBO’s [the Congressional Budget Office’s] assessment, the following factors will probably reduce future interest rates on government securities relative to their 1990–2007 average.…
The risk premium—the additional return that investors require to hold assets that are riskier than Treasury securities—will probably remain higher in the future than it was, on average, in the 1990–2007 period. Financial markets were already showing less appetite for risk in the early 2000s, so the risk premium was higher toward the end of that 18-year period than the average over the whole period. In addition, CBO expects that the demand for low-risk assets will be stronger in the wake of the financial crisis….
[175] Report: “How Treasury Issues Debt.” By Grant A. Driessen. Congressional Research Service, August 18, 2016. <fas.org>
Page 7:
The Fed’s monetary policy actions can affect interest rates on Treasury securities in the short run. The Fed conducts its monetary policy by setting a federal funds rate, the price at which banks buy and sell reserves on an overnight basis, based on the supply and demand for bank reserves. Monetary actions by the Fed generally affect short-term nominal interest rates. If the Fed lowers the federal funds rate, resulting in a lower short-term interest rate, long-term interest rates are likely to fall also, though they may not fall as much or as quickly.27
27 The federal funds rate is linked to the interest rates that banks and other financial institutions charge for loans—or the provision of credit. Thus, while the Fed may directly influence only a very short-term interest rate, this rate influences other longer-term rates. However, this relationship is far from being on a one-to-one basis since the longer-term market rates are influenced not only by what the Fed is doing today, but what it is expected to do in the future and what inflation is expected to be in the future.
[176] Book: The Federal Reserve System Purposes & Functions (10th edition). Board of Governors of the Federal Reserve System, October 2016.
Chapter 3: “Function: Conducting Monetary Policy.” <www.federalreserve.gov>
Page 22:
Prior to the financial crisis that began in 2007, the Federal Reserve bought or sold securities issued or backed by the U.S. government in the open market on most business days in order to keep a key short-term money market interest rate, called the federal funds rate, at or near a target set by the Federal Open Market Committee, or FOMC…. (The FOMC is the monetary policymaking arm of the Federal Reserve.) Changes in that target, and in investors’ expectations of what that target would be in the future, generated changes in a wide range of interest rates paid by borrowers and earned by savers.
Pages 27–28:
Short-term interest rates—for example, the rate of return paid to holders of U.S. Treasury bills or commercial paper (a short-term debt security) issued by private companies—are affected by changes in the level of the federal funds rate.
Short-term interest rates would likely decline if the FOMC reduced its target for the federal funds rate, or if unfolding events or Federal Reserve communications led the public to think that the FOMC would soon reduce the federal funds rate to a level lower than previously expected. Conversely, short-term interest rates would likely rise if the FOMC increased the funds rate target, or if unfolding events or Federal Reserve communications prompted the public to believe that the funds rate would soon be moved to a higher level than had been anticipated.
These changes in short-term market interest rates resulting from a change in the FOMC’s target for the federal funds rate typically are transmitted to medium- and longer-term interest rates, such as those on Treasury notes and bonds, corporate bonds, fixed-rate mortgages, and auto and other consumer loans. Medium- and longer-term interest rates are also affected by how people expect the federal funds rate to change in the future. For example, if borrowers and lenders think, today, that the FOMC is likely to raise its target for the federal funds rate substantially over the next several years, then medium-term interest rates today will be appreciably higher than short-term interest rates.
[177] Article: “Quantitative Easing: How Well Does This Tool Work?” By Stephen D. Williamson. Federal Reserve Bank of St. Louis Regional Economist, 2017. <www.stlouisfed.org>
Quantitative easing (QE)—large-scale purchases of assets by central banks—led to a large increase in the Federal Reserve’s balance sheet during the global financial crisis (2007–2008) and in the long recovery from the 2008–2009 recession. …
QE consists of large-scale asset purchases by central banks, usually of long-maturity government debt but also of private assets, such as corporate debt or asset-backed securities. Typically, QE occurs in unconventional circumstances, when short-term nominal interest rates are very low, zero or even negative. …
Traditionally, the interest rate that the Fed targets is the federal funds (fed funds) rate. Suppose, though, that the fed funds rate target is zero, but inflation is below the Fed’s 2 percent target and aggregate output is lower than potential. If the effective lower bound were not a binding constraint, the Fed would choose to lower the fed funds rate target, but it cannot. What then? The Fed faced such a situation at the end of 2008, during the financial crisis, and resorted to unconventional monetary policy, including a series of QE experiments that continued into late 2014. …
At the 2010 Jackson Hole conference, then-Fed Chairman Ben Bernanke attempted to articulate the Fed’s rationale for QE.4 Bernanke’s view was that, with short-term nominal interest rates at zero, purchases by the central bank of long-maturity assets would act to push up the prices of those securities because the Fed was reducing their net supply. Thus, long-maturity bond yields should go down, for example, if the Fed purchases long-maturity Treasury securities.
[178] Webpage: “What Were the Federal Reserve’s Large-Scale Asset Purchases?” Board of Governors of the Federal Reserve System. Last updated December 22, 2015. <www.federalreserve.gov>
With short-term interest rates at nearly zero, the Federal Reserve made a series of large-scale asset purchases (LSAPs) between late 2008 and October 2014.
In conducting LSAPs, the Fed purchased longer-term securities issued by the U.S. government and longer-term securities issued or guaranteed by government-sponsored agencies such as Fannie Mae or Freddie Mac. … The Fed’s purchases reduced the available supply of securities in the market, leading to an increase in the prices of those securities and a reduction in their yields.
[179] Article: “Inflation and the Real Value of Debt: A Double-Edged Sword.” By Christopher J. Neely. Federal Reserve Bank of St. Louis, On the Economy, August 1, 2022. <www.stlouisfed.org>
An increase in the price level directly reduces the real value of government debt, as well as the ratio of debt to GDP [gross domestic product], because—holding other things constant—higher prices increase nominal GDP. Thus, surprise inflation transfers wealth from holders of U.S. government debt—who include both Americans and non-Americans—to U.S. taxpayers.3
This transfer is not an unalloyed good even for U.S. taxpayers, however, because unexpected inflation will tend to raise the cost of servicing future U.S. debt—i.e., nominal yields—by increasing the expected rate of inflation and the risk premium associated with inflation.
[180] Report: “How Treasury Issues Debt.” By Grant A. Driessen. Congressional Research Service, August 18, 2016. <fas.org>
Page 16:
Generally, a strong economy will be accompanied by higher interest rates. If Treasury issues long-term debt during this time, they are committing to paying higher interest rates for a longer period and may decide to purchase short-term securities. However, this leads to uncertainties over the longer term, since the interest rate will likely change. During periods of economic downturn and low interest rates, Treasury may decide to finance at shorter maturities to take advantage of lower borrowing costs. This, however, may lead to more volatile and uncertain yearly interest payments because Treasury has to enter the market more often.
[181] Report: “Analytical Perspectives: Budget of the U.S. Government, Fiscal Year 2024.” White House Office of Management and Budget, March 13, 2023. <www.whitehouse.gov>
Page 245: “Historically, the average maturity of outstanding debt issued by Treasury has been about five years. The average maturity of outstanding debt was 74 months at the end of 2022.”
[182] Click here to see the current interest rates for government debt with various maturities. [Webpage: “Selected Interest Rates.” Board of Governors of the Federal Reserve System. <www.federalreserve.gov>]
[183] Report: “How Treasury Issues Debt.” By Grant A. Driessen. Congressional Research Service, August 18, 2016. <fas.org>
Page 6: “Special issue securities are available only to trust funds and are designated as nonmarketable, earning interest on a semi-annual basis. The interest rate is determined by formula, based on the average yield of certain marketable securities.”
[184] Federal laws define the method for setting interest rates on debt owed to each government trust fund. For instance, the interest rates paid to the two military retirement funds are “determined by the Secretary of the Treasury, taking into consideration current market yields on outstanding marketable obligations of the United States of comparable maturities.”† ‡ The interest rate paid to the Unemployment Trust Fund is a set formula: the average interest rate of all outstanding debt held by the public.§
NOTES:
[185] About 62% of intergovernmental debt is owed to Social Security, Medicare, the Civil Service Retirement and Disability Fund, and the Postal Service Retiree Health Benefits Fund.† The interest rates paid to these funds is the average interest rate of long-term debt held by the public. The next five footnotes provide the laws defining this rule.
NOTE: † Calculated with data from the report: “Monthly Statement of the Public Debt of the United States.” U.S. Treasury, Bureau of the Fiscal Service. February 28, 2023. <fiscaldata.treasury.gov>
Table III—Detail of Treasury Securities Outstanding, February 28, 2023 … Amounts in Millions of Dollars … Current Month Outstanding … Civil Service Retirement and Disability Fund [=] 961,053 … Federal Disability Insurance Trust Fund [=] 122,537 … Federal Hospital Insurance Trust Fund [=] 198,240 … Federal Old-Age and Survivors Insurance Trust Fund [=] 2,700,015 … Federal Supplementary Medical Insurance Trust Fund [=] 207,510 … Postal Service Retiree Health Benefits Fund [=] 33,374 … Total Government Account Series—Intragovernmental Holdings [=] 6,829,420
CALCULATION: (961,053 + 122,537 + 198,240 + 2,700,015 + 207,510 + 33,374) / 6,829,420 = 62%
[186] United States Code Title 42, Chapter 7, Subchapter II, Section 401: “Social Security, Trust Funds, Investments.” Accessed March 31, 2023 at <www.law.cornell.edu>
Such obligations issued for purchase by the Trust Funds shall have maturities fixed with due regard for the needs of the Trust Funds and shall bear interest at a rate equal to the average market yield (computed by the Managing Trustee on the basis of market quotations as of the end of the calendar month next preceding the date of such issue) on all marketable interest-bearing obligations of the United States then forming a part of the public debt which are not due or callable until after the expiration of four years from the end of such calendar month; except that where such average market yield is not a multiple of one-eighth of 1 per centum, the rate of interest of such obligations shall be the multiple of one-eighth of 1 per centum nearest such market yield.
[187] United States Code Title 42, Chapter 7, Subchapter XVIII, Part A, Section 1395i: “Federal Hospital Insurance Trust Fund, Investment of Trust Fund by Managing Trustee.” Accessed March 31, 2023 at <www.law.cornell.edu>
Such obligations issued for purchase by the Trust Fund shall have maturities fixed with due regard for the needs of the Trust Fund and shall bear interest at a rate equal to the average market yield (computed by the Managing Trustee on the basis of market quotations as of the end of the calendar month next preceding the date of such issue) on all marketable interest-bearing obligations of the United States then forming a part of the public debt which are not due or callable until after the expiration of 4 years from the end of such calendar month; except that where such average market yield is not a multiple of one-eighth of 1 per centum, the rate of interest on such obligations shall be the multiple of one-eighth of 1 per centum nearest such market yield.
[188] United States Code Title 42, Chapter 7, Subchapter XVIII, Part B, Section 1395t: “Federal Supplementary Medical Insurance Trust Fund, Investment of Trust Fund by Managing Trustee.” Accessed March 31, 2023 at <www.law.cornell.edu>
Such obligations issued for purchase by the Trust Fund shall have maturities fixed with due regard for the needs of the Trust Fund and shall bear interest at a rate equal to the average market yield (computed by the Managing Trustee on the basis of market quotations as of the end of the calendar month next preceding the date of such issue) on all marketable interest-bearing obligations of the United States then forming a part of the public debt which are not due or callable until after the expiration of 4 years from the end of such calendar month; except that where such average market yield is not a multiple of one-eighth of 1 per centum, the rate of interest on such obligations shall be the multiple of one-eighth of 1 per centum nearest such market yield.
[189] United States Code Title 5, Part III, Subpart G, Chapter 83, Subchapter III, Section 8348: “Civil Service Retirement and Disability Fund.” Accessed March 31, 2023 at <www.law.cornell.edu>
The obligations issued for purchase by the Fund shall have maturities fixed with due regard for the needs of the Fund and bear interest at a rate equal to the average market yield computed as of the end of the calendar month next preceding the date of the issue, borne by all marketable interest-bearing obligations of the United States then forming a part of the public debt which are not due or callable until after the expiration of 4 years from the end of that calendar month. If the average market yield is not a multiple of ⅛ of 1 percent, the rate of interest on the obligations shall be the multiple of ⅛ of 1 percent nearest the average market yield.
[190] United States Code Title 5, Part III, Subpart G, Chapter 89, Section 8909a: “Postal Service Retiree Health Benefit Fund.” Accessed March 31, 2023 at <www.law.cornell.edu>
“The Secretary of the Treasury shall immediately invest, in interest-bearing securities of the United States such currently available portions of the Fund as are not immediately required for payments from the Fund. Such investments shall be made in the same manner as investments for the Civil Service Retirement and Disability Fund under section 8348.”
NOTE: See the previous footnote for the text of Section 8348.
[191] Report: “How Treasury Issues Debt.” By Grant A. Driessen. Congressional Research Service, August 18, 2016. <fas.org>
Page 16: “[Debts issued] to finance the operations of the federal government, are offered at a mix of maturities…. Longer-term securities generally command higher interest rates compared to shorter-term securities because investors demand greater compensation for incurring risk over a longer period of time.”
[192] Article: “Interest Rates.” By Burton G. Malkiel. Concise Encyclopedia of Economics, 2008. <www.econlib.org>
In general, lenders demand a higher rate of interest for loans of longer maturity. … The longer the period to maturity of the bond, the greater is the potential fluctuation in price when interest rates change.
If you hold a bond to maturity, you need not worry if the price bounces around in the interim. But if you have to sell prior to maturity, you may receive less than you paid for the bond. The longer the maturity of the bond, the greater is the risk of loss because long-term bond prices are more volatile than shorter-term issues. To compensate for that risk of price fluctuation, longer-term bonds usually have higher interest rates than shorter-term issues.
[193] Article: “Interest Rate Risk—When Interest Rates Go Up, Prices of Fixed-Rate Bonds Fall.” U.S. Securities and Exchange Commission, Office of Investor Education and Advocacy, June 1, 2013. <www.sec.gov>
The Effect of Maturity on Interest Rate Risk and Coupon Rates
A bond’s maturity is the specific date in the future at which the face value of the bond will be repaid to the investor. A bond may mature in a few months or in a few years. Maturity can also affect interest rate risk. The longer the bond’s maturity, the greater the risk that the bond’s value could be impacted by changing interest rates prior to maturity, which may have a negative effect on the price of the bond. Therefore, bonds with longer maturities generally have higher interest rate risk than similar bonds with shorter maturities. …
To compensate investors for this interest rate risk, long-term bonds generally offer higher coupon rates than short-term bonds of the same credit quality.
[194] Report: “The 2014 Long-Term Budget Outlook.” Congressional Budget Office, July 2014. <www.cbo.gov>
Page 110: “The Social Security and Medicare trust funds hold special-issue bonds that generally earn interest rates that are higher than the average real interest rate on federal debt.”
[195] Calculated with data from:
a) Reports: “Schedules of Federal Debt.” U.S. Treasury, Bureau of the Fiscal Service. Accessed March 9, 2023 at <fiscaldata.treasury.gov>
Page 3 (of PDF): “Note 4. Interest Expense”
b) Report: “Financial Audit: Bureau of the Fiscal Service’s Fiscal Years 2022 and 2021 Schedules of Federal Debt.” United States Government Accountability Office, November 8, 2022. <www.gao.gov>
Page 38: “Note 4. Interest Expense”
c) Webpage: “Debt to the Penny.” U.S. Treasury, Bureau of the Fiscal Service. Accessed March 27, 2023 at <fiscaldata.treasury.gov>
NOTE: An Excel file containing the data and calculations is available upon request.
[196] Calculated with data from the report: “Monthly Statement of the Public Debt of the United States.” U.S. Treasury, Bureau of the Fiscal Service. February 28, 2023. <fiscaldata.treasury.gov>
Pages 2–13: “Table III – Detail of Treasury Securities Outstanding, February 29, 2023 … Amounts in Millions of Dollars … Current Month Outstanding … Federal Disability Insurance Trust Fund [=] 122,537 … Federal Old-Age and Survivors Insurance Trust Fund [=] 2,700,015 … Total Government Account Series—Intragovernmental Holdings [=] 6,829,420”
CALCULATION: (122,537 + 2,700,015) / 6,829,420 = 41%
[197] Actuarial note: “Social Security Trust Fund Investment Policies and Practices.” By Jeffrey L. Kunkel. United States Social Security Administration, January 1999. <www.ssa.gov>
The administrative policy followed since 1959 (with rare exceptions) has been to spread the maturity dates of each trust fund’s portfolio of special obligations as evenly as possible over the next 1 to 15 years, with the month and day of maturity always being June 30. (At the time the policy was set, June 30 was the end of the government’s fiscal year.) The policy calls for immediately investing income received by the trust funds in short-term special obligations, called certificates of indebtedness, that mature on the next June 30. On June 30, the certificates of indebtedness and any other special issues that mature on that date are reinvested (“rolled over”) as special issue notes or bonds with maturity dates designed to achieve an even 1-to-15 year spread.
[198] “2022 Annual Report of the Board of Trustees of the Federal Old-Age and Survivors Insurance and Disability Insurance Trust Funds.” United States Social Security Administration, June 7, 2022. <www.ssa.gov>
Pages 32–33:
Daily trust fund tax income is invested in the short-term certificates of indebtedness which mature on the next June 30 following the date of issue. The trust fund normally acquires long-term special-issue bonds when special issue securities of either type mature on June 30 and must be reinvested. …
Section 201(d) of the Social Security Act provides that the obligations issued for purchase by the OASI [Old-Age & Survivors Insurance] and DI [Disability Insurance] Trust Funds shall have maturities fixed with due regard for the needs of the funds. The usual practice has been to reinvest the maturing special issue securities, as of each June 30, so that the value of the total portfolio of special issue securities maturing in each of the next 15 years are approximately equal.
[199] Report: “How Treasury Issues Debt.” By Grant A. Driessen. Congressional Research Service, August 18, 2016. <fas.org>
Page 6:
When revenues in the trust funds exceed benefit payments, the unspent monies must remain in the trust fund for future use. However, this excess cash is transferred to the Treasury’s General Fund and is used to finance other activities which fall outside the specific purpose of the trust fund. In exchange, the trust fund is issued a Treasury “special issue” security to be redeemed at face value at any time in the future when the funds are needed.
[200] Report: “Federal Debt and Interest Costs.” Congressional Budget Office, December 2010. <www.cbo.gov>
Page 20: “When a trust fund’s expenses exceed its cash income, the agency administering the trust fund redeems its Treasury securities for cash as needed; the Treasury must obtain that cash from tax revenues or other sources of income or by borrowing from the public.”
[201] Webpage: “Social Security Trust Funds: Frequently Asked Questions.” United States Social Security Administration, Office of the Chief Actuary. Accessed May 24, 2021 at <www.ssa.gov>
How Are the Trust Funds Invested?
By law, income to the trust funds must be invested, on a daily basis, in securities guaranteed as to both principal and interest by the Federal government. All securities held by the trust funds are “special issues” of the United States Treasury. Such securities are available only to the trust funds.
In the past, the trust funds have held marketable Treasury securities, which are available to the general public. Unlike marketable securities, special issues can be redeemed at any time at face value. Marketable securities are subject to the forces of the open market and may suffer a loss, or enjoy a gain, if sold before maturity. Investment in special issues gives the trust funds the same flexibility as holding cash.
[202] Constitution of the United States. Signed September 17, 1787. <www.justfacts.com>
Article I, Section 7:
[Clause 1] All Bills for raising Revenue shall originate in the House of Representatives; but the Senate may propose or concur with Amendments as on other Bills.
[Clause 2] Every Bill which shall have passed the House of Representatives and the Senate, shall, before it become a Law, be presented to the President of the United States; If he approve he shall sign it, but if not he shall return it, with his Objections to that House in which it shall have originated, who shall enter the Objections at large on their Journal, and proceed to reconsider it. If after such Reconsideration two thirds of that House shall agree to pass the Bill, it shall be sent, together with the Objections, to the other House, by which it shall likewise be reconsidered, and if approved by two thirds of that House, it shall become a Law. But in all such Cases the Votes of both Houses shall be determined by yeas and Nays, and the Names of the Persons voting for and against the Bill shall be entered on the Journal of each House respectively. If any Bill shall not be returned by the President within ten Days (Sundays excepted) after it shall have been presented to him, the Same shall be a Law, in like Manner as if he had signed it, unless the Congress by their Adjournment prevent its Return, in which Case it shall not be a Law.
Article I, Section 8, Clause 1: “The Congress shall have Power To lay and collect Taxes, Duties, Imposts and Excises, to pay the Debts and provide for the common Defence and general Welfare of the United States….”
[203] Report: “A Citizen’s Guide to the Federal Budget: Fiscal Year 2000.” White House Office of Management and Budget, January 1999. <www.gpo.gov>
Pages 18–19:
• Discretionary spending, which accounts for one-third of all Federal spending, is what the President and Congress must decide to spend for the next year through the 13 annual appropriations bills. It includes money for such activities as the FBI and the Coast Guard, for housing and education, for space exploration and highway construction, and for defense and foreign aid.
• Mandatory spending, which accounts for two-thirds of all spending, is authorized by permanent laws, not by the 13 annual appropriations bills. It includes entitlements—such as Social Security, Medicare, veterans’ benefits, and Food Stamps—through which individuals receive benefits because they are eligible based on their age, income, or other criteria. It also includes interest on the national debt, which the Government pays to individuals and institutions that hold Treasury bonds and other Government securities. The President and Congress can change the law in order to change the spending on entitlements and other mandatory programs—but they don’t have to.
[204] Book: This Time is Different: Eight Centuries of Financial Folly. By Carmen M. Reinhart (University of Maryland) and Kenneth S. Rogoff (Harvard University). Princeton University Press, 2009.
Page 65: “Governments can also default on domestic public debt through high and unanticipated inflation, as the United States and many European countries famously did in the 1970s.”
Page 175:
[I]nflation has long been the weapon of choice in sovereign defaults on domestic debt and, where possible, on international debt. … [G]overnments engage in massive monetary expansion, in part because they can thereby gain a seigniorage tax on real money balances (by inflating down the value of citizens’ currency and issuing more to meet demand). But they also want to reduce, or even wipe out, the real value of public debts outstanding.
Page 400: “Seigniorage is simply the real income a government can realize by exercising its monopoly on printing currency. The revenue can be broken down into the quantity of currency needed to meet the growing transactions demand at constant prices and the remaining growth, which causes inflation, thereby lowering the purchasing power of existing currency.”
[205] Report: “GAO Strategic Plan, 2007–2012.” U.S. Government Accountability Office, March 2007. <www.gao.gov>
Page 15:
Table 2: Forces Shaping the United States and Its Place in the World
Changing security threats: The world has changed dramatically in overall security, from the conventional threats posed during the Cold War era to more unconventional and asymmetric threats. Providing for people’s safety and security requires attention to threats as diverse as terrorism, violent crime, natural disasters, and infectious diseases. The response to many of these threats depends not only on the action of the U.S. government but also on the cooperation of other nations and multilateral organizations, as well as on state and local governments and the private and independent sectors. Complicating such efforts are a number of failed states allowing the trade of arms, drugs, or other illegal goods; the spread of infectious diseases; and the accommodation of terrorist groups. …
Economic growth and competitiveness: Economic growth and competition are also affected by the skills and behavior of U.S. citizens, the policies of the U.S. government, and the ability of the private and public sectors to innovate and manage change. … Importantly, the saving and investment behavior of U.S. citizens affects the capital available to invest in research, development, and productivity enhancement. …
Global interdependency: Economies as well as governments and societies are becoming increasingly interdependent as more people, information, goods, and capital flow across increasingly porous borders. …
Societal change: The U.S. population is aging and becoming more diverse. As U.S. society ages and the ratio of elderly persons and children to persons of working age increases, the sustainability of social insurance systems will be further threatened. Specifically, according to the 2000 census, the median age of the U.S. population is now the highest it has ever been, and the baby boomer age group—people born from 1946 to 1964, inclusive—was a significant part of the population.
[206] Report: “The Effects of Pandemic-Related Legislation on Output.” Congressional Budget Office, September 2020. <www.cbo.gov>
Page 2 (of PDF): “In March and April of 2020, four major federal laws were enacted to address the public health emergency and the economic distress created by the 2020 coronavirus pandemic. … By increasing debt as a percentage of GDP [gross domestic product], the legislation is expected to raise borrowing costs, lower economic output, and reduce national income in the longer term.”
Pages 3–4:
In the longer term, the legislation is projected to increase the ratio of federal debt to GDP. High and rising federal debt makes the economy more vulnerable to rising interest rates and also to rising inflation, depending on how that debt is financed. The growing debt burden also raises borrowing costs, slowing the growth of the economy and national income, and it could increase the risk of a fiscal crisis or a gradual decline in the value of Treasury securities.
[207] Report: “The 2013 Long-Term Budget Outlook.” Congressional Budget Office, September 2013. <cbo.gov>
Page 4: “Under one set of alternative policies, referred to as the extended alternative fiscal scenario, certain policies that are now in place but that are scheduled to change under current law would continue instead, and some provisions of current law that might be difficult to sustain for a long period would be modified.”
Page 79:
The extended alternative fiscal scenario incorporates the assumptions that certain policies that have been in place for a number of years will be continued and that some provisions of law that might be difficult to sustain for a long period will be modified. …
The results with economic feedback include the economic effects of the budget policies in the long run and the effects of that economic feedback on the budget. Those results are CBO’s [Congressional Budget Office] central estimates from ranges determined by alternative assumptions about how much deficits “crowd out” investment in capital goods such as factories and computers (because a larger portion of people’s savings is being used to purchase government securities) and how much people respond to changes in after-tax wages by adjusting the number of hours they work.
Pages 84–85:
Under CBO’s extended alternative fiscal scenario, noninterest spending would be higher and revenues would be lower than under the extended baseline…. Noninterest spending in 2023 would be 0.5 percent of GDP higher under the alternative fiscal scenario than under the baseline, and that difference would grow in later years, reaching roughly 3 percent of GDP [gross domestic product] in 2038. The higher noninterest spending stems from several assumptions of the extended alternative fiscal scenario: that the automatic reductions in spending required by the Budget Control Act for 2014 and later will not occur (although the original caps on discretionary appropriations in that law are assumed to remain in place); that lawmakers will act to prevent Medicare’s payment rates for physicians from declining; that after 2023, lawmakers will not allow various restraints on the growth of Medicare costs and health insurance subsidies to exert their full effect; and that after 2023, federal spending for programs other than Social Security and the major health care programs will rise to the average of other noninterest spending, net of offsetting receipts, as a percentage of GDP during the past two decades, rather than fall significantly below that level, as it does in the extended baseline.
[208] “2014 Annual Report of the Boards of Trustees of the Federal Hospital Insurance and Federal Supplementary Medical Insurance Trust Funds.” U.S. Department of Health & Human Services, Centers for Medicare and Medicaid Services, July 28, 2014. <www.cms.gov>
Pages 276–277:
Statement of Actuarial Opinion …
In past reports, the Board of Trustees has emphasized the virtual certainty that actual Part B expenditures will exceed the projections under current law due to further legislative action to avoid substantial reductions in the Medicare physician fee schedule. Current law would require a physician fee reduction of almost 21 percent on April 1, 2015—an implausible expectation.
Since lawmakers have overridden these scheduled reductions each year since 2003, the Trustees have changed the basis of their projections of Part B expenditures from current law to a projected baseline, which includes an assumption that the physician payment updates will equal the increase averaged over the last 10 years. This change results in a far more reasonable expectation of Medicare expenditures than occurs under current law. The projected baseline estimates are summarized throughout the main body of this report, while current-law estimates are included in appendix C.
The Affordable Care Act is making important changes to the Medicare program that are designed, in part, to substantially improve its financial outlook. While the ACA [Affordable Care Act] has been successful in reducing many Medicare expenditures to date, there is a strong possibility that certain of these changes will not be viable in the long range. Specifically, the annual price updates for most categories of non-physician health services will be adjusted downward each year by the growth in economy-wide productivity. The ability of health care providers to sustain these price reductions will be challenging, as the best available evidence indicates that most providers cannot improve their productivity to this degree for a prolonged period given the labor-intensive nature of these services.
Absent an unprecedented change in health care delivery systems and payment mechanisms, the prices paid by Medicare for health services will fall increasingly short of the costs of providing these services. By the end of the long-range projection period, Medicare prices for many services would be less than half of their level without consideration of the productivity price reductions. Before such an outcome would occur, lawmakers would likely intervene to prevent the withdrawal of providers from the Medicare market and the severe problems with beneficiary access to care that would result. Overriding the productivity adjustments, as lawmakers have done repeatedly in the case of physician payment rates, would lead to substantially higher costs for Medicare in the long range than those projected in this report.
[209] Chart constructed with data from:
a) Dataset: “The 2013 Long-Term Budget Outlook.” Congressional Budget Office, September 2013. <www.cbo.gov>
Tab: “Figure 1-1. Federal Debt Held by the Public Under CBO’s Extended Baseline”
Tab: “6. Summary Data for the Extended Alternative Fiscal Scenario”
b) Dataset: “The 2013 Long-Term Budget Outlook.” Congressional Budget Office, September 2013. <www.cbo.gov>
Tab: “6. Summary Data for the Extended Alternative Fiscal Scenario”
c) Dataset: “The Budget and Economic Outlook: 2023 to 2033.” Congressional Budget Office, February 2023. <www.cbo.gov>
“Figure 1-2. Federal Debt Held by the Public, 1900 to 2053”
NOTE: An Excel file containing the data is available upon request.
[210] Article: “Federal Reserve’s Role During WWII.” By Gary Richardson. Federal Reserve Bank of Richmond, Federal Reserve History, November 22, 2013. <www.federalreservehistory.org>
In September 1939, Germany’s invasion of Poland triggered war among the principal European powers. In December 1941, Japan attacked Pearl Harbor. Germany and Italy declared war on the United States. The American “arsenal of democracy” joined the Allied nations, including Britain, France, China, the Soviet Union, and numerous others, in the fight against the Axis alliance. The Allied counteroffensive began in 1942. The Axis surrendered in 1945.
[211] “WHO Director-General’s Opening Remarks at the Media Briefing on Covid-19.” World Health Organization, March 11, 2020. <bit.ly>
[Dr. Tedros Adhanom Ghebreyesus:] …
WHO [World Health Organization] has been assessing this outbreak around the clock and we are deeply concerned both by the alarming levels of spread and severity, and by the alarming levels of inaction.
We have therefore made the assessment that COVID-19 can be characterized as a pandemic.
[212] Chart constructed with data from:
a) Dataset: “An Update to the Budget and Economic Outlook: Fiscal Years 2014 to 2024.” Congressional Budget Office, August 2014. <www.cbo.gov>
Tab: “Figure 1-2. Total Revenues and Outlays”
b) Dataset: “The 2013 Long-Term Budget Outlook.” Congressional Budget Office, September 2013. <www.cbo.gov>
Tab: “6. Summary Data for the Extended Alternative Fiscal Scenario”
c) Dataset: “The Budget and Economic Outlook: 2023 to 2033.” Congressional Budget Office, February 2023. <www.cbo.gov>
“Figure 1-3. Total Outlays and Revenues”
NOTE: An Excel file containing the data is available upon request.
[213] “WHO Director-General’s Opening Remarks at the Media Briefing on Covid-19.” World Health Organization, March 11, 2020. <bit.ly>
[Dr. Tedros Adhanom Ghebreyesus:] …
WHO [World Health Organization] has been assessing this outbreak around the clock and we are deeply concerned both by the alarming levels of spread and severity, and by the alarming levels of inaction.
We have therefore made the assessment that COVID-19 can be characterized as a pandemic.
[214] Report: “The 2014 Long-Term Budget Outlook.” Congressional Budget Office, July 2014. <www.cbo.gov>
Pages 19–20:
Spending for the Major Health Care Programs and Social Security
Mandatory programs have accounted for a rising share of the federal government’s noninterest spending over the past few decades, averaging 60 percent in recent years. Most of the growth in mandatory spending has involved the three largest programs—Social Security, Medicare, and Medicaid. Federal outlays for those programs together made up more than 40 percent of the government’s noninterest spending, on average, during the past 10 years, compared with less than 30 percent four decades ago.
Most of the anticipated growth in noninterest spending as a share of GDP [gross domestic product] over the long term is expected to come from the government’s major health care programs: Medicare, Medicaid, the Children’s Health Insurance Program, and the subsidies for health insurance purchased through the exchanges created under the ACA [Affordable Care Act, a.k.a. Obamacare]. CBO [Congressional Budget Office] projects that, under current law, total outlays for those programs, net of offsetting receipts, would grow much faster than the overall economy, increasing from just below 5 percent of GDP now to 8 percent in 2039…. Spending for Social Security also would increase relative to the size of the economy, but by much less—from almost 5 percent of GDP in 2014 to more than 6 percent in 2039 and beyond….
Those projected increases in spending for Social Security and the government’s major health care programs are attributable primarily to three causes: the aging of the population, rising health care spending per beneficiary, and the ACA’s expansion of federal subsidies for health insurance.
NOTE: A very common but false belief is that the Social Security program has been looted. For facts about this myth, visit Just Facts’ research on Social Security.
[215] Report: “The 2022 Long-Term Budget Outlook.” Congressional Budget Office, July 2022. <www.cbo.gov>
Page 2 (of PDF):
Spending. In CBO’s [Congressional Budget Office] projections, outlays in 2022 are 23.5 percent of GDP—less than last year’s total—and they continue to decline in 2023 and 2024 as federal spending in response to the pandemic diminishes. Outlays then steadily increase, reaching 30.2 percent of GDP [gross domestic product] in 2052. Rising interest costs and growth in spending on the major health care programs and Social Security—driven by the aging of the population and growth in health care costs per person—boost federal outlays significantly over the 2025–2052 period.
[216] Report: “The Long-Term Budget Outlook.” Congressional Budget Office, June 2010. Revised August 2010. <www.cbo.gov>
Page 16:
Waiting to close the fiscal gap would make the necessary changes larger. To illustrate the costs of delay, CBO [Congressional Budget Office] simulated the effects of closing the fiscal gap under the alternative fiscal scenario beginning in 2011, 2015, 2020, or 2025. Those simulations indicate that postponing action would substantially increase the size of the policy adjustments needed to put the budget on a sustainable course. For example, if lawmakers wanted to close the fiscal gap through 2035 but did not begin until 2015, they would have to reduce primary spending or increase revenues over that period by 5.7 percent of GDP [gross domestic product], rather than by 4.8 percent if they acted in 2011…. If they waited until 2020 to close the fiscal gap through 2035, they would have to cut noninterest outlays or raise revenues over that period by 7.9 percent of GDP. Moreover, those simulations omit the effects that deficits and debt would have on economic growth and interest rates in the intervening years; incorporating such effects would make the impact of delaying policy changes even more severe.
[217] Report: “The 2014 Long-Term Budget Outlook.” Congressional Budget Office, July 2014. <www.cbo.gov>
Pages 12–13:
Second, CBO [Congressional Budget Office] has estimated the amount by which delaying policy changes to reduce deficits would increase the size of the policy adjustments needed to achieve any chosen goal for debt. If the goal was to have the debt equal 74 percent of GDP [gross domestic product] in 2039 but to wait to implement new policies until 2020, the combination of increases in revenues and reductions in noninterest spending over the 2020–2039 period would need to be 1.5 percent of GDP, rather than the 1.2 percent of GDP needed to reach that goal if policy changes took effect in 2015…. If lawmakers waited even longer—until 2025—to take action, the policy changes over the 2025–2039 period would need to amount to 2.1 percent of GDP. If, instead of aiming to keep debt from rising relative to GDP, lawmakers wanted to return debt to its historical average percentage of GDP—but policy changes did not take effect until 2020—the policy changes would need to amount to 3.2 percent rather than 2.6 percent of GDP. Waiting an additional five years would require even larger changes, amounting to 4.3 percent of GDP.
Third, CBO has studied how waiting to resolve the long-term fiscal imbalance would affect various generations of the U.S. population. In 2010, CBO compared economic outcomes under a policy that would stabilize the debt-to-GDP ratio starting in 2015 with outcomes under a policy that would delay stabilizing the ratio until 2025.6 That analysis suggested that generations born after about 2015 would be worse off if action to stabilize the debt-to-GDP ratio was postponed to 2025. People born before 1990, however, would be better off if action was delayed—largely because they would partly or entirely avoid the policy changes needed to stabilize the debt—and generations born between 1990 and 2015 could either gain or lose from a delay, depending on the details of the policy changes.7
6 See Congressional Budget Office, Economic Impacts of Waiting to Resolve the Long-Term Budget Imbalance (December 2010), <www.cbo.gov>. That analysis was based on a projection of slower growth in debt than CBO now projects, so the estimated effects of a similar policy today would be close, but not identical, to the effects estimated in that earlier analysis.
7 Those conclusions do not incorporate the possible negative effects of a fiscal crisis or effects that might arise from the government’s reduced flexibility to respond to unexpected challenges.
[218] Report: “United States Federal Debt: Answers To Frequently Asked Questions, An Update.” U.S. Government Accountability Office, August 12, 2004. <www.gao.gov>
Page 59:
Waiting to take action entails risks. First, we lose the opportunity to reduce the burden of interest in the federal budget, thereby creating a legacy of higher debt as well as elderly entitlement spending for the relatively smaller workforce of the future. Second, the nation would lose an important window where today’s relatively large workforce can increase saving and enhance productivity, two elements critical to growing the future economy. Third, and most critically, we risk losing the opportunity to phase in changes gradually. Addressing the nation’s fiscal imbalance requires a three-pronged approach to (1) restructure existing entitlement programs, (2) reexamine the base of discretionary and other spending, and (3) review and revise the federal government’s tax policy and enforcement programs.
[219] Article: “Federal Reserve’s Role During WWII.” By Gary Richardson. Federal Reserve Bank of Richmond, Federal Reserve History, November 22, 2013. <www.federalreservehistory.org>
In September 1939, Germany’s invasion of Poland triggered war among the principal European powers. In December 1941, Japan attacked Pearl Harbor. Germany and Italy declared war on the United States. The American “arsenal of democracy” joined the Allied nations, including Britain, France, China, the Soviet Union, and numerous others, in the fight against the Axis alliance. The Allied counteroffensive began in 1942. The Axis surrendered in 1945.
[220] Article: “World War II.” Encyclopædia Britannica Ultimate Reference Suite 2004.
[It was] also called Second World War, a conflict that involved virtually every part of the world during the years 1939–45. The principal belligerents were the Axis powers—Germany, Italy, and Japan—and the Allies—France, Great Britain, the United States, the Soviet Union, and, to a lesser extent, China. The war was in many respects a continuation, after an uneasy 20-year hiatus, of the disputes left unsettled by World War I. The 40,000,000–50,000,000 deaths incurred in World War II make it the bloodiest conflict as well as the largest war in history.
[221] Calculated with data from:
a) Dataset: “Historical Debt Outstanding—Annual, 1790–1849.” United States Department of the Treasury, Bureau of the Public Debt. Updated May 5, 2013. <www.justfacts.com>
b) Dataset: “Historical Debt Outstanding—Annual, 1850–1899.” United States Department of the Treasury, Bureau of the Public Debt. Updated May 5, 2013. <www.justfacts.com>
c) Dataset: “Historical Debt Outstanding—Annual, 1900–1949.” United States Department of the Treasury, Bureau of the Public Debt. Updated May 5, 2013. <www.justfacts.com>
d) Dataset: “Historical Debt Outstanding—Annual, 1950–1999.” United States Department of the Treasury, Bureau of the Public Debt. Updated May 5, 2013. <www.justfacts.com>
e) Webpage: “Debt to the Penny.” U.S. Department of the Treasury, Bureau of the Fiscal Service. Accessed June 2, 2020 at <fiscaldata.treasury.gov>
f) Dataset: “Historical Data on the Federal Debt.” Congressional Budget Office, August 5, 2010. <www.cbo.gov>
g) Dataset: “Table 1.1.5. Gross Domestic Product [Billions of Dollars].” U.S. Bureau of Economic Analysis. Last revised May 28, 2020. <apps.bea.gov>
NOTES:
[222] Webpage: “Paul Davidson.” University of Tennessee Knoxville, 2011. <haslam.utk.edu>
Editor, Journal of Post Keynesian Economics
Author: The Keynes Solution: The Path to Global Economic Prosperity
Bernard Schwartz Center for Economic Policy Analysis …
Dr. Davidson is the Editor of the Journal of Post Keynesian Economics and member of the Editorial Board of Ekonomia. He is the author, co-author, or editor of 22 books. He is the author of over 210 articles.
[223] Commentary: “Making Dollars and Sense of the U.S. Government Debt.” By Paul Davidson. Journal of Post Keynesian Economics, Summer 2010. Pages 663–667. <www.tandfonline.com>
Pages 664–665:
In the war years from 1941 to 1945, the GDP [gross domestic product] doubled while the national debt increased by more than 500 percent as Roosevelt financed much of the war expenditures by government borrowing. By the end of the war in 1945, the national debt … was equal to approximately 120 percent of GDP.
Rather than bankrupting the nation, this large growth in the national debt promoted a prosperous economy. By 1946, the average American household was living much better economically than in the prewar days. Moreover, the children of that Depression–World War II generation were not burdened by having to pay off what then was considered a huge national debt. Instead, for the next quarter century, the economy continued on a path of unprecedented economic growth and prosperity….
[224] Webpage: “Douglas J. Amy.” Mount Holyoke College, 2011. <www.mtholyoke.edu>
Professor of Politics …
Douglas Amy is a leading expert on electoral voting systems, including proportional representation, redistricting issues in the United States, and the plight of third party candidacies. …
Prior to his interest in electoral systems, Amy concentrated on environmental mediation and policy analysis.
[225] Commentary: “The Deficit Scare: Myth vs. Reality.” By Douglas J. Amy. Accessed March 22, 2011 at <governmentisgood.com>
Page 3:
Conservatives are also wrong when they argue that deficit spending and a large national debt will inevitably undermine economic growth. To see why, we need to simply look back at times when we have run up large deficits and increased the national debt. The best example is World War II when the national debt soared to 120% of GDP [gross domestic product]—nearly twice the size of today’s debt. This spending not only got us out of the Great Depression but set the stage for a prolonged period of sustained economic growth in the 50s and 60s. Massive investments were made in science and technology, American workers were re-trained and re-employed, private investment was encouraged, and consumer purchasing power was increased. That 25-year post-war economic boom, with the most rapid increase in living standards in our history, would not have happened without the stimulus of all this deficit spending.
[226] Webpage: “Paul Krugman.” New York Times, 2011. <www.nytimes.com>
Paul Krugman joined the New York Times in 1999 as a columnist on the Op-Ed Page and continues as professor of Economics and International Affairs at Princeton University. …
On October 13, 2008, it was announced that Mr. Krugman would receive the Nobel Prize in Economics.
[227] Commentary: “How Big Is $9 Trillion?” By Paul Krugman. New York Times, August 23, 2009. <krugman.blogs.nytimes.com>
What you have to bear in mind is that the economy—and hence the federal tax base—is enormous, too. Right now GDP [gross domestic product] is around $14 trillion. If economic growth averages 2.5% a year, which has been the norm, and inflation is 2% a year, which is the target (and which the bond market seems to believe), GDP will be around $22 trillion a decade from now. So we’re talking about adding debt that’s equal to around 40% of GDP.
Right now, federal debt is about 50% of GDP. So even if we do run these deficits, federal debt as a share of GDP will be substantially less than it was at the end of World War II. It will also be substantially less than, say, debt in several European countries in the mid to late 1990s. (There are some technical issues in comparing these various numbers—gross debt versus net (mainly about Social Security) and overall government debt versus federal, but they don’t change the basic picture.)
Again, the debt outlook is bad. But we’re not looking at something inconceivable, impossible to deal with; we’re looking at debt levels that a number of advanced countries, the US included, have had in the past, and dealt with.
[228] Calculated with data from:
a) Dataset: “Table 3.2. Federal Government Current Receipts and Expenditures.” U.S. Department of Commerce, Bureau of Economic Analysis. Last revised March 28, 2018. <apps.bea.gov>
Line items 1 and 23: “Current receipts” and “Current expenditures”
b) Dataset: “Table 1.1.5. Gross Domestic Product.” U.S. Department of Commerce, Bureau of Economic Analysis. Last revised March 28, 2018. <apps.bea.gov>
NOTE: An Excel file containing the data and calculations is available upon request.
[229] Calculated with data from:
a) Dataset: “Historical Debt Outstanding—Annual, 1790–1849.” United States Department of the Treasury, Bureau of the Public Debt. Updated May 5, 2013. <www.justfacts.com>
b) Dataset: “Historical Debt Outstanding—Annual, 1850–1899.” United States Department of the Treasury, Bureau of the Public Debt. Updated May 5, 2013. <www.justfacts.com>
c) Dataset: “Historical Debt Outstanding—Annual, 1900–1949.” United States Department of the Treasury, Bureau of the Public Debt. Updated May 5, 2013. <www.justfacts.com>
d) Dataset: “Historical Debt Outstanding—Annual, 1950–1999.” United States Department of the Treasury, Bureau of the Public Debt. Updated May 5, 2013. <www.justfacts.com>
e) Dataset: “Historical Data on the Federal Debt.” Congressional Budget Office, August 5, 2010. <www.cbo.gov>
f) Dataset: “Table 1.1.5. Gross Domestic Product [Billions of Dollars].” U.S. Bureau of Economic Analysis, Last revised February 28, 2019. <apps.bea.gov>
NOTE: An Excel file containing the data and calculations is available upon request.
[230] Calculated with data from:
a) Report: “Fiscal Year 2012 Historical Tables, Budget of the U.S. Government.” White House Office of Management and Budget, 2010. <www.gpo.gov>
Pages 24–25: “Table 1.2—Summary of Receipts, Outlays, and Surpluses or Deficits ( ) as Percentages of GDP: 1930–2016”
b) Dataset: “The Long-Term Budget Outlook.” Congressional Budget Office, June 2010. <www.cbo.gov>
Tab: “Summary Data for the Alternative Fiscal Scenario”
NOTE: An Excel file containing the data and calculations is available upon request.
[231] Calculated with data from:
a) Report: “Fiscal Year 2012 Historical Tables, Budget of the U.S. Government.” White House Office of Management and Budget, 2011. <www.gpo.gov>
Pages 139–140: “Table 7.1—Federal Debt at the End of Year: 1940–2016”
b) Dataset: “The Long-Term Budget Outlook.” Congressional Budget Office, June 2010. <www.cbo.gov>
Tab: “Summary Data for the Alternative Fiscal Scenario”
NOTE: An Excel file containing the data and calculations is available upon request.
[232] Article: “Federal Reserve’s Role During WWII.” By Gary Richardson. Federal Reserve Bank of Richmond, Federal Reserve History, November 22, 2013. <www.federalreservehistory.org>
In September 1939, Germany’s invasion of Poland triggered war among the principal European powers. In December 1941, Japan attacked Pearl Harbor. Germany and Italy declared war on the United States. The American “arsenal of democracy” joined the Allied nations, including Britain, France, China, the Soviet Union, and numerous others, in the fight against the Axis alliance. The Allied counteroffensive began in 1942. The Axis surrendered in 1945.
[233] Calculated with data from:
a) Dataset: “Historical Debt Outstanding—Annual, 1790–1849.” United States Department of the Treasury, Bureau of the Public Debt. Updated May 5, 2013. <www.justfacts.com>
b) Dataset: “Historical Debt Outstanding—Annual, 1850–1899.” United States Department of the Treasury, Bureau of the Public Debt. Updated May 5, 2013. <www.justfacts.com>
c) Dataset: “Historical Debt Outstanding—Annual, 1900–1949.” United States Department of the Treasury, Bureau of the Public Debt. Updated May 5, 2013. <www.justfacts.com>
d) Dataset: “Historical Debt Outstanding—Annual, 1950–1999.” United States Department of the Treasury, Bureau of the Public Debt. Updated May 5, 2013. <www.justfacts.com>
e) Webpage: “Debt to the Penny.” U.S. Department of the Treasury, Bureau of the Fiscal Service. Accessed March 3, 2023 at <fiscaldata.treasury.gov>
f) Dataset: “Historical Data on the Federal Debt.” Congressional Budget Office, August 5, 2010. <www.cbo.gov>
g) Dataset: “Table 1.1.5. Gross Domestic Product [Billions of Dollars].” United States Department of Commerce, Bureau of Economic Analysis. Last revised January 26, 2023. <apps.bea.gov>
NOTE: An Excel file containing the data and calculations is available upon request.
[234] Report: “The 2014 Long-Term Budget Outlook.” Congressional Budget Office, July 2014. <www.cbo.gov>
Page 8: “CBO’s [Congressional Budget Office] long-term projections extend beyond the usual 10-year budget window to focus on the 25-year period ending in 2039. They generally reflect current law, following the agency’s April 2014 baseline budget projections through 2024 and then extending the baseline concept into later years; hence, they constitute what is called the extended baseline.”
[235] Dataset: “The 2014 Long-Term Budget Outlook.” Congressional Budget Office, July 15, 2014. <www.cbo.gov>
Tab “1. Summary Data for the Extended Baseline.”
[236] Report: “The 2014 Long-Term Budget Outlook.” Congressional Budget Office, July 2014. <www.cbo.gov>
Pages 7–8: “CBO [Congressional Budget Office] projects, revenues would remain roughly stable relative to GDP [gross domestic product] for the next 10 years as an increase in individual income taxes was offset by a decline in receipts from corporate income taxes and remittances from the Federal Reserve (all relative to the size of the economy).”
Page 18:
Revenue projections through 2024 follow the 10-year baseline, which generally incorporates the assumption that various tax provisions will expire as scheduled even if they have routinely been extended in the past. After 2024, rules for individual income taxes, payroll taxes, excise taxes, and estate and gift taxes are assumed to evolve as scheduled under current law.13 Because of the structure of current tax law, total federal revenues from those sources are estimated to grow faster than GDP over the long run. Revenues from corporate income taxes and other sources (such as receipts from the Federal Reserve System) are assumed to remain constant as a percentage of GDP after 2024….
13 The sole exception to the current-law assumption applies to expiring excise taxes dedicated to trust funds. The Deficit Control Act requires CBO’s baseline to reflect the assumption that those taxes would be extended at their current rates. That law does not stipulate that the baseline include the extension of other expiring tax provisions, even if they have been routinely extended in the past.
Page 59:
After 2024, revenues would continue rising faster than GDP, largely for two reasons: Growth in real (inflation-adjusted) income and the interaction of the tax system with inflation would push a greater proportion of income into higher tax brackets; and certain tax increases enacted in the Affordable Care Act (ACA) would generate increasing amounts of revenues relative to the size of the economy.
Pages 64–65:
Under CBO’s extended baseline, marginal tax rates on income from labor and capital would rise over time. The effective federal marginal tax rate on labor income—that is, the marginal tax rate on labor income averaged across taxpayers using weights proportional to their labor income—is projected to increase from about 29 percent in calendar year 2014 to 34 percent in 2039…. By contrast, the effective federal marginal tax rate on capital income (returns on investment) is projected to rise only from 18 percent to 19 percent over that period.
Page 66:
The cumulative effect of rising prices would significantly reduce the value of some parameters of the tax system that are not indexed for inflation. As one example, CBO estimates that the amount of mortgage debt eligible for the mortgage interest deduction, which is not indexed for inflation, would fall from $1 million today to less than $600,000 in 2039 measured in today’s dollars. As another example, the portion of Social Security benefits subject to taxation would increase from about 30 percent now to about 50 percent by 2039, CBO estimates, because the thresholds for taxing benefits are not indexed for inflation.
[237] Calculated with data from:
a) Dataset: “The 2014 Long-Term Budget Outlook.” Congressional Budget Office, July 15, 2014. <www.cbo.gov>
Tab “1. Summary Data for the Extended Baseline (Percentage of Gross Domestic Product). … Revenues … 2084 [=] 23.5”
“Figure 1-3. Spending and Revenues Under CBO’s [Congressional Budget Office] Extended Baseline, Compared With Past Averages. (Percentage of Gross Domestic Product) … Revenues … Total … Average, 1974–2013 [=] 17.4.”
b) Report: “The 2014 Long-Term Budget Outlook.” Congressional Budget Office, July 2014. <www.cbo.gov>
Page 60: “Over the past 40 years, total federal revenues have ranged from a high of 19.9 percent of GDP [gross domestic product] (in 2000) to a low of 14.6 percent (in 2009 and 2010), with no evident trend over time….”
CALCULATION: (23.5% – 17.4%) / 17.4% = 35%
[238] Dataset: “The 2014 Long-Term Budget Outlook.” Congressional Budget Office, July 15, 2014. <www.cbo.gov>
Tab “1. Summary Data for the Extended Baseline.”
[239] Calculated with the dataset: “The 2014 Long-Term Budget Outlook.” Congressional Budget Office, July 15, 2014. <www.cbo.gov>
Tab “1. Summary Data for the Extended Baseline (Percentage of Gross Domestic Product). … Total Spending … 2040 [=] 26.0.”
“Figure 1-3. Spending and Revenues Under CBO’s [Congressional Budget Office] Extended Baseline, Compared With Past Averages. (Percentage of Gross Domestic Product) … Spending … Total … Average, 1974–2013 [=] 20.5.”
CALCULATION: (26.0% – 20.5%) / 20.5% = 27%
[240] Report: “The 2014 Long-Term Budget Outlook.” Congressional Budget Office, July 2014. <www.cbo.gov>
Page 8:
CBO’s [Congressional Budget Office] 10-year and extended baselines are meant to serve as benchmarks for measuring the budgetary effects of proposed changes in federal revenues or spending. They are not meant to be predictions of future budgetary outcomes; rather, they represent CBO’s best assessment of how the economy and other factors would affect revenues and spending if current law generally remained unchanged. In that way, the baselines incorporate the assumption that some policy changes that lawmakers have routinely made in the past—such as preventing the sharp cuts to Medicare’s payment rates for physicians that are called for by law—will not be made again.
Page 16: “[T]he projections incorporate the reduction in Medicare’s payments to physicians scheduled for 2015 and the reductions in Medicare spending specified in the Budget Control Act of 2011, as amended, for 2015 through 2024.”
[241] “2014 Annual Report of the Boards of Trustees of the Federal Hospital Insurance and Federal Supplementary Medical Insurance Trust Funds.” Centers for Medicare and Medicaid Services, July 28, 2014. <www.cms.gov>
Pages 276–277:
Statement of Actuarial Opinion …
In past reports, the Board of Trustees has emphasized the virtual certainty that actual Part B expenditures will exceed the projections under current law due to further legislative action to avoid substantial reductions in the Medicare physician fee schedule. Current law would require a physician fee reduction of almost 21 percent on April 1, 2015—an implausible expectation.
Since lawmakers have overridden these scheduled reductions each year since 2003, the Trustees have changed the basis of their projections of Part B expenditures from current law to a projected baseline, which includes an assumption that the physician payment updates will equal the increase averaged over the last 10 years. This change results in a far more reasonable expectation of Medicare expenditures than occurs under current law. The projected baseline estimates are summarized throughout the main body of this report, while current-law estimates are included in appendix C.
The Affordable Care Act is making important changes to the Medicare program that are designed, in part, to substantially improve its financial outlook. While the ACA [Affordable Care Act] has been successful in reducing many Medicare expenditures to date, there is a strong possibility that certain of these changes will not be viable in the long range. Specifically, the annual price updates for most categories of non-physician health services will be adjusted downward each year by the growth in economy-wide productivity. The ability of health care providers to sustain these price reductions will be challenging, as the best available evidence indicates that most providers cannot improve their productivity to this degree for a prolonged period given the labor-intensive nature of these services.
Absent an unprecedented change in health care delivery systems and payment mechanisms, the prices paid by Medicare for health services will fall increasingly short of the costs of providing these services. By the end of the long-range projection period, Medicare prices for many services would be less than half of their level without consideration of the productivity price reductions. Before such an outcome would occur, lawmakers would likely intervene to prevent the withdrawal of providers from the Medicare market and the severe problems with beneficiary access to care that would result. Overriding the productivity adjustments, as lawmakers have done repeatedly in the case of physician payment rates, would lead to substantially higher costs for Medicare in the long range than those projected in this report.
[242] Report: “Budgetary and Economic Outcomes Under Paths for Federal Revenues and Noninterest Spending Specified by Chairman Ryan, April 2014.” Congressional Budget Office, April 2014. <www.cbo.gov>
Page 2: “The amounts of federal debt and economic output estimated for all of the scenarios in this report are highly uncertain. That uncertainty stems from the difficulties inherent in projecting the effects of federal fiscal policies, especially far into the future.”
Page 12:
The projections for debt, revenues, spending, and economic output presented in this report are highly uncertain for many reasons. The projections are based on CBO’s [Congressional Budget Office] central estimates for key parameters of economic behavior—including the extent to which government borrowing crowds out capital investment and the effect that changes in real after-tax wages have on the supply of labor.11 Estimates of those and other economic parameters are uncertain, and analysis using different parameters can produce results that are substantially higher or lower than CBO’s central estimates.
[243] Report: “The Path to Prosperity: Fiscal Year 2015 Budget Resolution.” House Budget Committee, April 2014. <budget.house.gov>
Pages 58–59:
The Medicare reform envisioned in this budget resolution begins with a commitment to keep the promises made to those who now are in or near retirement. Consequently, for those who enter the program before 2024, the Medicare program and its benefits will remain as they are, without change.
For future retirees, the budget supports an approach known as “premium support.” Starting in 2024, seniors (those who first become eligible by turning 65 on or after January 1, 2024) would be given a choice of private plans competing alongside the traditional fee-for-service Medicare program on a newly created Medicare Exchange. Medicare would provide a premium-support payment either to pay for or offset the premium of the plan chosen by the senior, depending on the plan’s cost. For those who were 55 or older in 2013, they would remain in the traditional Medicare system.
The Medicare recipient of the future would choose, from a list of guaranteed-coverage options, a health plan that best suits his or her needs. This is not a voucher program. A Medicare premium-support payment would be paid, by Medicare, directly to the plan or the fee-for-service program to subsidize its cost. The program would operate in a manner similar to that of the Medicare prescription-drug benefit. The Medicare premium-support payment would be adjusted so that the sick would receive higher payments if their conditions worsened; lower-income seniors would receive additional assistance to help cover out-of-pocket costs; and wealthier seniors would assume responsibility for a greater share of their premiums.
This approach to strengthening the Medicare program—which is based on a long history of bipartisan reform plans—would ensure security and affordability for seniors now and into the future. In September 2013, the Congressional Budget Office analyzed illustrative options of a premium support system. They found that a program in which the premium-support payment was based on the average bid of participating plans would result in savings for affected beneficiaries as well as the federal government.52
Moreover, it would set up a carefully monitored exchange for Medicare plans. Health plans that chose to participate in the Medicare Exchange would agree to offer insurance to all Medicare beneficiaries, to avoid cherry-picking, and to ensure that Medicare’s sickest and highest-cost beneficiaries receive coverage.
While there would be no disruptions in the current Medicare fee-for-service program for those currently enrolled or becoming eligible before 2024, all seniors would have the choice to opt in to the new Medicare program once it began in 2024. This budget envisions giving seniors the freedom to choose a plan best suited for them, guaranteeing health security throughout their retirement years.
52 Congressional Budget Office, “A Premium Support System for Medicare: Analysis of Illustrative Options,” 18 Sept. 2013.
[244] Report: “The Path to Prosperity: Fiscal Year 2015 Budget Resolution.” House Budget Committee, April 2014. <budget.house.gov>
Page 59: “Also starting in 2024, the age of eligibility for Medicare would begin to rise gradually to correspond with Social Security’s retirement age and the fee-for-service benefit would be modernized to have a single deductible and by reforming supplemental insurance policies.”
[245] Calculated with “Summary Tables for the Path to Prosperity: Fiscal Year 2015 Budget Resolution.” House Budget Committee, April 2014. <budget.house.gov>
a) Table “S-3. FY2015 House Budget by Major Category (Outlays in Billions) … Medicare (Net) … 2016 [=] $552 … 2020 [=] $684 … 2024 [=] $855.”
b) Table “S-4. FY2015 House Budget vs. Current Policy by Major Category (Outlays in Billions) … Medicare (Net) … 2016 [=] $–3 … 2020 [=] $–13 … 2024 [=] $–38.”
CALCULATIONS:
[246] Report: “The Path to Prosperity: Fiscal Year 2015 Budget Resolution.” House Budget Committee, April 2014. <budget.house.gov>
Pages 54–55:
Provide State Flexibility on Medicaid. One way to secure the Medicaid benefit is by converting the federal share of Medicaid spending into an allotment that each state could tailor to meet its needs, indexed for inflation and population growth. Such a reform would end the misguided one-size-fits-all approach that has tied the hands of state governments. States would no longer be shackled by federally determined program requirements and enrollment criteria. Instead, each state would have the freedom and flexibility to tailor a Medicaid program that fit the needs of its unique population.
The budget resolution proposes to transform Medicaid from an open-ended entitlement into a block-granted program like SCHIP [State Children’s Health Insurance Program]. These programs would be unified under the proposal and grown together for population growth and inflation.
This reform also would improve the health-care safety net for low-income Americans by giving states the ability to offer their Medicaid populations more options and better access to care. Medicaid recipients, like all other Americans, deserve to choose their own doctors and make their own health-care decisions, instead of having Washington make those decisions for them.
There are numerous examples across the country where states have used the existing, but limited, flexibility of Medicaid’s waiver program to introduce innovative reforms that produced cost savings, quality improvements, and beneficiary satisfaction. The state of Indiana implemented such reforms through the Healthy Indiana Plan, a patient-centered system that provided health coverage to uninsured residents who didn’t qualify for Medicaid. Enrollees in this program had access to benefits such as physician services, prescription drugs, both patient and outpatient hospital care, and disease management.
The Medicaid reforms proposed in the fiscal year 2015 budget provide all states with the necessary flexibility to pursue reforms similar to the Indiana plan.
Based on this kind of reform, this budget assumes $732 billion in savings over ten years, easing the fiscal burdens imposed on state budgets and contributing to the long-term stabilization of the federal government’s fiscal path.
[247] Report: “The Path to Prosperity: Fiscal Year 2015 Budget Resolution.” House Budget Committee, April 2014. <budget.house.gov>
Page 55:
Repeal the Medicaid Expansions in the New Health-Care Law. The recently enacted health-care law calls for major expansions in the Medicaid program beginning in 2014. These expansions will have a significant impact on the federal share of the Medicaid program and will dramatically increase outlays.
In the face of enormous stress on federal and state budgets and declining quality of care in Medicaid, the new health-care law would increase the eligible population for the program by one-third. For fiscal years 2015 through 2024, CBO [Congressional Budget Office] projects the new law will increase federal spending by $792 billion.
This future fiscal burden will have serious budgetary consequences for both federal and state governments. While the health law requires the federal government to finance 100 percent of the Medicaid costs associated with covering new enrollees, this provision begins to phase out in fiscal year 2016. At that time, state governments will be required to assume a share of this cost. This share increases from fiscal year 2016 through 2020, when states will be required to finance 10 percent of the health law’s expansion of Medicaid.
Not only does this expansion magnify the challenges to both state and federal budgets, it also binds the hands of local governments in developing solutions that meet the unique needs of their citizens. The health-care law would exacerbate the already crippling one-size-fits-all enrollment mandates that have resulted in below-market reimbursements, poor health-care outcomes, and restrictive services. The budget calls for repealing the Medicaid expansions contained in the health-care law and removing the law’s burdensome programmatic mandates on state governments. Adopting this option would save $792.4 billion over ten years.
[248] Calculated with the dataset: “Summary Tables for the Path to Prosperity: Fiscal Year 2015 Budget Resolution.” House Budget Committee, April 2014. <budget.house.gov>
a) Table “S-3. FY2015 House Budget by Major Category (Outlays in Billions) … Medicaid & Other Health … 2016 [=] $311 … 2020 [=] $343 … 2024 [=] $403.”
b) Table “S-4. FY2015 House Budget vs. Current Policy by Major Category (Outlays in Billions) … Medicaid & Other Health … 2016 [=] –$31 … 2020 [=] –$80 … 2024 [=] –$124.”
CALCULATIONS:
[249] Report: “The Path to Prosperity: Fiscal Year 2015 Budget Resolution.” House Budget Committee, April 2014. <budget.house.gov>
Pages 55–56:
Repeal the Exchange Subsidies Created by the New Health-Care Law. According to CBO [Congressional Budget Office] estimates, the health law proposes to spend $1.2 trillion over the next ten years providing eligible individuals with subsidies to purchase government-approved health insurance. These subsidies can only be used to purchase plans that meet standards determined by the new health-care law. In addition to this enormous market distortion, the law also stipulates a complex maze of eligibility and income tests to determine how much of a subsidy qualifying individuals may receive.
The new law couples these subsidies with a mandate for individuals to purchase health insurance and bureaucratic controls on the types of insurance that may legally be offered. Taken together, these provisions will undermine the private insurance market, which serves as the backbone of the current U.S. health-care system. Exchange subsidies will undermine the competitive forces of the marketplace. Government mandates will drive out all but the largest insurance companies. Punitive tax penalties will force individuals to purchase coverage whether they choose to or not. Further, this budget does not condone any policy that would require entities or individuals to finance activities or make health decisions that violate their religious beliefs. This budget provides for the repeal of the President’s onerous health-care law for this and many other reasons.
Left in place, the health law will create pressures that will eventually lead to a single-payer system in which the federal government determines how much health care Americans need and what kind of care they can receive. This budget recommends repealing the architecture of this new law, which puts health-care decisions into the hands of bureaucrats, and instead allowing Congress to pursue patient-centered health-care reforms that actually bring down the cost of care by empowering consumers.
… To be clear, this budget repeals all federal spending related to the health law’s exchange subsidies and related spending.
[250] Dataset: “Budgetary and Economic Outcomes Under Paths for Federal Revenues and Noninterest Spending Specified by Chairman Ryan, April 2014.” Congressional Budget Office, April 1, 2014. <www.cbo.gov>
Figure “9. Spending Excluding Interest Payments Under Various Budget Scenarios, With Macroeconomic Effects (Percentage of Gross Domestic Product) … Paths for Revenues and Noninterest Spending Specified by Chairman Ryan … 2015 [=] 18.9 … 2025 [=] 16.0 … 2035 [=] 16.4”
[251] Calculated with the dataset: “The 2014 Long-Term Budget Outlook.” Congressional Budget Office, July 15, 2014. <www.cbo.gov>
“Figure 1-3. Spending and Revenues Under CBO’s [Congressional Budget Office] Extended Baseline, Compared With Past Averages (Percentage of Gross Domestic Product). … Spending … Net Interest … Average, 1947 to 2013 [=] 2.2 … Total Spending… Average, 1947 to 2013 [=] 20.5”
CALCULATION: 20.5 – 2.2 = 18.3 total spending less net interest
[252] Dataset: “Budgetary and Economic Outcomes Under Paths for Federal Revenues and Noninterest Spending Specified by Chairman Ryan, April 2014.” Congressional Budget Office, April 1, 2014. <www.cbo.gov>
Figure “11. Revenues Under Various Budget Scenarios, With Macroeconomic Effects (Percentage of Gross Domestic Product) … Paths for Revenues and Noninterest Spending Specified by Chairman Ryan … 2015 [=] 18.2 … 2025 [=] 18.4 … 2032 [=] 19.0”
[253] Dataset: “The 2014 Long-Term Budget Outlook.” Congressional Budget Office, July 15, 2014. <www.cbo.gov>
“Figure 1-3. Spending and Revenues Under CBO’s [Congressional Budget Office] Extended Baseline, Compared With Past Averages (Percentage of Gross Domestic Product). … Revenues … Total Revenues … Average, 1947 to 2013 [=] 17.4”
[254] These debt projections account for the economic effects of federal debt, taxes, and spending. As explained by the Congressional Budget Office (CBO):
The results with economic feedback include the economic effects of the budget policies and the effects of that economic feedback on the budget. Those results are CBO’s central estimates from ranges determined by alternative assessments about how much deficits “crowd out” investment in capital goods such as factories and computers (because a larger portion of people’s savings is being used to purchase government securities) and how much people respond to changes in after-tax wages by adjusting the number of hours they work. [Report: “The 2014 Long-Term Budget Outlook.” Congressional Budget Office, July 2014. <www.cbo.gov>. Page 76.]
[255] Chart constructed with data from:
a) Dataset: “The 2014 Long-Term Budget Outlook.” Congressional Budget Office, July 15, 2014. <www.cbo.gov>
“Figure 1-1. Federal Debt Held by the Public”
“Figure 6-3. Long-Run Effects of the Fiscal Policies in CBO’s Extended Alternative Fiscal Scenario”
Tab: “6. Summary Data for the Extended Alternative Fiscal Scenario, Without Economic Feedback”
b) Dataset: “The Budget and Economic Outlook: 2023 to 2033.” Congressional Budget Office, February 2023. <www.cbo.gov>
“Figure 1-2. Federal Debt Held by the Public, 1900 to 2053”
c) Dataset: “Budgetary and Economic Outcomes Under Paths for Federal Revenues and Noninterest Spending Specified by Chairman Ryan.” Congressional Budget Office, April 1, 2014. <www.cbo.gov>
“Figure 1. Federal Debt Held by the Public Under Various Budget Scenarios, with Macroeconomic Effects, 2015 to 2040”
NOTE: An Excel file containing the data is available upon request.
[256] Article: “Federal Reserve’s Role During WWII.” By Gary Richardson. Federal Reserve Bank of Richmond, Federal Reserve History, November 22, 2013. <www.federalreservehistory.org>
In September 1939, Germany’s invasion of Poland triggered war among the principal European powers. In December 1941, Japan attacked Pearl Harbor. Germany and Italy declared war on the United States. The American “arsenal of democracy” joined the Allied nations, including Britain, France, China, the Soviet Union, and numerous others, in the fight against the Axis alliance. The Allied counteroffensive began in 1942. The Axis surrendered in 1945.
[257] “WHO Director-General’s Opening Remarks at the Media Briefing on Covid-19.” World Health Organization, March 11, 2020. <bit.ly>
[Dr. Tedros Adhanom Ghebreyesus:] …
WHO [World Health Organization] has been assessing this outbreak around the clock and we are deeply concerned both by the alarming levels of spread and severity, and by the alarming levels of inaction.
We have therefore made the assessment that COVID-19 can be characterized as a pandemic.
[258] Report: “The 2014 Long-Term Budget Outlook.” Congressional Budget Office, July 2014. <www.cbo.gov>
Pages 19–20:
Spending for the Major Health Care Programs and Social Security
Mandatory programs have accounted for a rising share of the federal government’s noninterest spending over the past few decades, averaging 60 percent in recent years. Most of the growth in mandatory spending has involved the three largest programs—Social Security, Medicare, and Medicaid. Federal outlays for those programs together made up more than 40 percent of the government’s noninterest spending, on average, during the past 10 years, compared with less than 30 percent four decades ago.
Most of the anticipated growth in noninterest spending as a share of GDP [gross domestic product] over the long term is expected to come from the government’s major health care programs: Medicare, Medicaid, the Children’s Health Insurance Program, and the subsidies for health insurance purchased through the exchanges created under the ACA [Affordable Care Act]. CBO [Congressional Budget Office] projects that, under current law, total outlays for those programs, net of offsetting receipts, would grow much faster than the overall economy, increasing from just below 5 percent of GDP now to 8 percent in 2039…. Spending for Social Security also would increase relative to the size of the economy, but by much less—from almost 5 percent of GDP in 2014 to more than 6 percent in 2039 and beyond….
Those projected increases in spending for Social Security and the government’s major health care programs are attributable primarily to three causes: the aging of the population, rising health care spending per beneficiary, and the ACA’s expansion of federal subsidies for health insurance.
NOTE: A very common but false belief is that the Social Security program has been looted. For facts about this myth, visit Just Facts’ research on Social Security.
[259] Report: “The 2022 Long-Term Budget Outlook.” Congressional Budget Office, July 2022. <www.cbo.gov>
Page 2 (of PDF):
Spending. In CBO’s [Congressional Budget Office] projections, outlays in 2022 are 23.5 percent of GDP—less than last year’s total—and they continue to decline in 2023 and 2024 as federal spending in response to the pandemic diminishes. Outlays then steadily increase, reaching 30.2 percent of GDP [gross domestic product] in 2052. Rising interest costs and growth in spending on the major health care programs and Social Security—driven by the aging of the population and growth in health care costs per person—boost federal outlays significantly over the 2025–2052 period.
[260] Chart constructed with data from:
a) Dataset: “Table 1.1.5. Gross Domestic Product [Billions of Dollars].” U.S. Bureau of Economic Analysis. Last revised March 30, 2023. <apps.bea.gov>
b) Webpage: “Debt to the Penny.” U.S. Department of the Treasury, Bureau of the Fiscal Service. Accessed April 7, 2023 at <fiscaldata.treasury.gov>
c) Report: “As Economic Concerns Recede, Environmental Protection Rises on the Public’s Policy Agenda.” Pew Research Center, February 13, 2020. <www.pewresearch.org>
d) Report: “Economy Remains the Public’s Top Policy; Covid-19 Concerns Decline Again.” Pew Research Center, February 6, 2023. <www.pewresearch.org>
NOTE: An Excel file containing the data and calculations is available upon request.
[261] “American Trends Panel Wave 38 Methodology Report.” Pew Research Center, December 28, 2018. <www.pewresearch.org>
Page 3 (of PDF):
The American Trends Panel (ATP) is a national, probability-based online panel of adults living in households in the United States living. On behalf of the Pew Research Center, GfK Custom Research, LLC (“GfK”) conducted the 38th wave of the panel survey from September 24 to October 7, 2018. In total, 10,682 ATP members (both English- and Spanish-language survey-takers) completed the Wave 38 survey. Survey weights were provided for the total sample. The margin of sampling error for the weighted estimates is ± 1.50 percentage points.
[262] “American Trends Panel Wave 53 Methodology Report.” Pew Research Center, September 18, 2019. <www.pewresearch.org>
Page 3 (of PDF):
The American Trends Panel (ATP) is a national, probability-based online panel of adults living in households in the United States. On behalf of the Pew Research Center, Ipsos Public Affairs (“Ipsos”) conducted the 53rd wave of the panel from September 3 to September 15, 2019. In total, 9,895 ATP members (both English- and Spanish-language survey-takers) completed the Wave 53 survey. Survey weights were provided for the total responding sample. The margin of sampling error for weighted estimates based on the full sample is ± 1.53 percentage points.
[263] “American Trends Panel Wave 69 Methodology Report.” Pew Research Center, June 25, 2020. <www.pewresearch.org>
Page 3 (of PDF):
The American Trends Panel (ATP) is a national, probability-based online panel of adults living in households in the United States. On behalf of the Pew Research Center, Ipsos Public Affairs (“Ipsos”) conducted the Wave 69 survey of the panel from June 16, 2020 to June 22, 2020. In total, 4,708 ATP members (both English- and Spanish-language survey-takers) completed the Wave 69 survey. Survey weights were provided for the total responding sample. The margin of sampling error for weighted estimates based on the full sample is ±1.8 percentage points.
[264] Report: “Economy and Covid-19 Top the Public’s Policy Agenda for 2021.” Pew Research Center, January 28, 2021. <www.pewresearch.org>
Page 3:
Pew Research Center conducted this study to understand which issues the public views as most important for Congress and the president to prioritize in the coming year. For this analysis, we surveyed 5,360 U.S. adults in January 2021. Everyone who took part in this survey is a member of Pew Research Center’s American Trends Panel (ATP), an online survey panel that is recruited through national, random sampling of residential addresses. This way nearly all U.S. adults have a chance of selection. The survey is weighted to be representative of the U.S. adult population by gender, race, ethnicity, partisan affiliation, education and other categories.
Page 17: “The data collection field period for this survey was Jan. 8 to Jan. 12, 2021.”
Page 19: “The following table shows the unweighted sample sizes and the error attributable to sampling that would be expected at the 95% level of confidence for different groups in the survey. … Half sample† … Unweighted sample size [=] At least 2,676 … Plus or minus 2.7 percentage points”
NOTE: † According to pages 21–22 of this report, “Reducing the budget deficit” was an option on “Form 1 Only … (N=2,684)” and not on Form 2 (N=2,676).
[265] Report: “Public’s Top Priority for 2022: Strengthening the Nation’s Economy.” Pew Research Center, February 16, 2022. <www.pewresearch.org>
Page 3:
Pew Research Center conducted this study to understand which issues the public views as most important for the president and Congress to prioritize in the coming year. For this analysis, we surveyed 5,128 U.S. adults in January 2022. Everyone who took part in this survey is a member of the Center’s American Trends Panel (ATP), an online survey panel that is recruited through national, random sampling of residential addresses. This way nearly all U.S. adults have a chance of selection. The survey is weighted to be representative of the U.S. adult population by gender, race, ethnicity, partisan affiliation, education and other categories.
Page 21: “The data collection field period for this survey was Jan. 10 to Jan. 17, 2022.”
Page 24: “The following table shows the unweighted sample sizes and the error attributable to sampling that would be expected at the 95% level of confidence for different groups in the survey. … Half sample† … Unweighted sample size [=] At least 2,558 … 2.8 percentage points”
NOTE: † According to pages 26–27 of this report, “Reducing the budget deficit” was an option on “Form 1 Only (N=2,558)” and not on Form 2 (N=2,570).
[266] Report: “If No Deal is Struck, Four-in-Ten Say Let the Sequester Happen.” Pew Research Center, February 21, 2013. <www.pewresearch.org>
The poll finds new evidence of the public’s concern over the federal budget deficit. Fully 70% say it is essential for the president and Congress to pass major legislation to reduce the federal budget deficit, including wide majorities across party lines. …
Overall, 19% say the focus of deficit reduction efforts should be only on spending cuts; just 3% want to concentrate only on tax increases. …
When those who favor a balanced approach to reducing the deficit are asked if the focus should mostly be on spending cuts or tax increases, they overwhelmingly say spending cuts. Overall, 73% say efforts by the president and Congress to reduce the deficit should be only or mostly focused on spending cuts while just 19% say the focus should be only or mostly on tax increases.
[267] Report: “As Sequester Deadline Looms, Little Support for Cutting Most Programs.” Pew Research Center, February 22, 2013. <www.pewresearch.org>
Page 1: “Public Rejects Cuts in Government Spending in Most Areas … Would you increase, decrease or keep spending the same for … Medicare… Increase [=] 36 … Same [=] 46 … Decrease [=] 15 … Social Security … Increase [=] 41 … Same [=] 46 … Decrease [=] 10”
[268] Poll: “NBC News/Wall Street Journal Survey.” HART/McInturff, February 2011. <online.wsj.com>
Page 1 (of PDF): “Interviews: 1000 adults, including 200 reached by cell phone … Date: February 24–28, 2011 … The margin of error for 1000 interviews is ±3.10%”
Page 13 (of PDF):
Q19 Thinking (now/again) about YOURSELF AND YOUR FAMILY, when you think about our federal budget problems, including our growing federal budget deficit and our increasing national debt, how much does this concern you personally, in terms of how it impacts you and your family’s future—a great deal, quite a bit, only a little, or not at all?
A great deal [=] 48%
Quite a bit [=] 32% …
Page 14 (of PDF):
Q22a Do you think it will be necessary to cut spending on Medicare, the federal government health care program for seniors, in order to significantly reduce the federal budget deficit? If you don’t know enough to have an opinion, please just say so.*
Yes [=] 18%
No [=] 54%
No opinion [=] 27%
Not sure [=] 1%
* Asked of one-half of the respondents (FORM A).
Q22b Do you think it will be necessary to cut spending on Social Security in order to significantly reduce the federal budget deficit? If you don’t know enough to have an opinion, please just say so.
Yes [=] 22%
No [=] 49%
No opinion [=] 27%
Not sure [=] 2
** Asked of one-half of the respondents (FORM B).
Q23 If the deficit cannot be eliminated solely by cutting wasteful federal spending, which one of these steps would you most favor … cutting important programs, raising taxes, or postponing elimination of the deficit?
Cutting important programs [=] 35%
Raising taxes [=] 33%
Postponing elimination of the deficit [=] 26%
[269] Article: “Poll Shows Budget-Cuts Dilemma.” By Neil King Jr. and Scott Greenberg. Wall Street Journal, March 3, 2011. <www.wsj.com>
“Asked directly if they thought cuts to Medicare were necessary to ‘significantly reduce’ the deficit, 18% of respondents said yes, while 54% said no; the rest were not sure or had no opinion. On Social Security, 22% said cuts would be needed, while 49% said they weren’t.”
[270] Article: “AP–CNBC Poll: Cut Services to Balance the Budget.” By Alan Fram and Jennifer Agiesta. Associated Press, November 30, 2010. <archive.boston.com>
Eighty-five percent worry that growing red ink will harm future generations—the strongest expression of concern since AP [Associated Press] polls began asking the question in 2008. Fifty-six percent think the shortfalls will spark a major economic crisis in the coming decade. …
Asked to choose between two paths lawmakers could follow to balance the budget, 59 percent in the AP–CNBC Poll preferred cutting unspecified government services while 30 percent picked unspecified tax increases.
[271] Article: “Headed for a Crash? Experts Warn Heavy Debt Threatens Economy.” By Robert Tanner. Associated Press, Aug 27, 2005. <theworldlink.com>
The AP/Ipsos [Associated Press] poll of 1,000 adults taken July 5–7 found that a sweeping majority—70 percent—worried about the size of the federal deficit either “some” or “a lot.”
But only 35 percent were willing to cut government spending and experience a drop in services to balance the budget. Even fewer—18 percent—were willing to raise taxes to keep current services. Just 1 percent wanted to both raise taxes and cut spending. The poll has a margin of error of 3 percentage points.
[272] Calculated with data from:
a) Dataset: “Nationwide Rankings: Spending Over Next 10 Fiscal Years, Include Baseline, All Bills.” Spending Tracker. Accessed April 1–3, 2023 at <spendingtracker.org>
b) Dataset: “CPI—All Urban Consumers (Current Series).” U.S. Department of Labor, Bureau of Labor Statistics. Accessed January 27, 2023 at <www.bls.gov>
“Series Id: CUUR0000SA0; Series Title: All Items in U.S. City Average, All Urban Consumers, Not Seasonally Adjusted; Area: U.S. City Average; Item: All Items; Base Period: 1982–84=100”
NOTE: An Excel file containing the data and calculations is available upon request.
[273] Webpage: “Frequently Asked Questions.” Spending Tracker. Accessed April 28, 2022 at <spendingtracker.org>
What is My Congressman’s Number?
The number is the total amount of new tax dollars each Member of Congress has voted to spend.
How Is It Calculated?
We take every bill that each Member voted for (or against) and sum the monetary amount of spending in them to get the final total. If Members vote for some bills that lower spending and some bills that raise it, the net difference is their number.
Where Does the Data Come From?
Spending estimates for major pieces of legislation come from the Congressional Budget Office (CBO), which is the nonpartisan budget organization of the U.S. Congress. We incorporate all bills that have a total increase in spending greater than $1 million. We only incorporate legislation that has been scored by the CBO into our estimates.
Vote records come from the Sunlight Foundation, through their data services which provide up-to-date information on congressional bills, votes, and floor activity, among other things. Much of the Sunlight Foundation’s publicly available data on congressional votes originates from GovTrack.us. …
Over What Period Does Spending Occur?
We default to looking at spending over a 10-year time horizon, since the CBO typically estimates the spending implications of bills over the next decade. …
Do You Include Both Spending Authorizations and Appropriations Bills?
Yes. Authorization scores represent the sum of CBO’s estimates, while appropriations bills are assigned the net difference between the current year and the previous year’s level of appropriations. This helps us avoid the double-counting of spending contained in both types of bills.
In addition, we include any emergency spending and off-budget appropriations in full, since those appropriations represent fully new spending. It’s important to note that because the budgetary process has not been followed in recent years, many pre-existing programs are not reauthorized, essentially creating “autopilot” spending for discretionary programs.
[274] Webpage: “U.S. Senate: Dates of Sessions of Congress.” Accessed April 28, 2022 at <www.senate.gov>
|
Congress |
Session |
Begin Date |
Adjourn Date |
|
117 |
2 |
January 3, 2022 |
|
|
1 |
January 3, 2021 |
January 3, 2022 |
|
|
116 |
2 |
January 3, 2020 |
January 3, 2021 |
|
1 |
January 3, 2019 |
January 3, 2020 |
|
|
115 |
2 |
January 3, 2018 |
January 3, 2019 |
|
1 |
January 3, 2017 |
January 3, 2018 |
|
|
114 |
2 |
January 4, 2016 |
January 3, 2017 |
|
1 |
January 6, 2015 |
December 18, 2015 |
|
|
113 |
2 |
January 3, 2014 |
December 16, 2014 |
|
1 |
January 3, 2013 |
January 3, 2014 |
|
|
112 |
2 |
January 3, 2012 |
January 3, 2013 |
|
1 |
January 5, 2011 |
January 3, 2012 |
|
|
111 |
2 |
January 5, 2010 |
December 22, 2010 |
|
1 |
January 6, 2009 |
December 24, 2009 |
[275] Report: “The Tea Is Cooling: The First Session of the 113th Congress.” National Taxpayers Union Foundation, July 10, 2014. <www.ntu.org>
Page 2: “During the First Session of the 113th Congress, Representatives authored 496 spending bills and 112 savings bills. Senators drafted 332 increase bills and 56 savings bills. While the number of increases was the lowest seen since the 105th Congress, this is also the first time in several years that there were fewer cut bills introduced compared to the preceding Congress.”
[276] Calculated with data from:
a) Report: “The Tea Is Cooling: The First Session of the 113th Congress.” National Taxpayers Union Foundation, July 10, 2014. <www.ntu.org>
Pages 8–9: “Table 3. House Sponsorship of Legislation in the First Sessions of the Past Twelve Congresses by Party (Dollar Amounts in Millions)”
Pages 9–10: “Table 4. Senate Sponsorship of Legislation in the First Sessions of the Past Twelve Congresses by Party (Dollar Amounts in Millions)”
b) Dataset: “CPI—All Urban Consumers (Current Series).” U.S. Department of Labor, Bureau of Labor Statistics. Accessed January 27, 2023 at <www.bls.gov>
“Series Id: CUUR0000SA0; Series Title: All Items in U.S. City Average, All Urban Consumers, Not Seasonally Adjusted; Area: U.S. City Average; Item: All Items; Base Period: 1982–84=100”
NOTE: An Excel file containing the data and calculations is available upon request.
[277] Speech: “Address of the President to Joint Sessions of Congress.” President George W. Bush, February 27, 2001. <georgewbush-whitehouse.archives.gov>
My budget has funded a responsible increase in our ongoing operations. It has funded our nation’s important priorities. It has protected Social Security and Medicare. And our surpluses are big enough that there is still money left over.
Many of you have talked about the need to pay down our national debt. I listened, and I agree. (Applause.) We owe it to our children and grandchildren to act now, and I hope you will join me to pay down $2 trillion in debt during the next 10 years. (Applause.) At the end of those 10 years, we will have paid down all the debt that is available to retire. (Applause.) That is more debt, repaid more quickly than has ever been repaid by any nation at any time in history. (Applause.)
[278] Article: “$1.35 Trillion Tax Cut Becomes Law.” By Kelly Wallace. CNN, June 7, 2001. <www.cnn.com>
“President George W. Bush signed into law Thursday the first major piece of legislation of his presidency, a $1.35 trillion tax cut over 10 years.”
[279] Webpage: “Past Inaugural Ceremonies.” Joint Congressional Committee on Inaugural Ceremonies. Accessed June 2, 2021 at <www.inaugural.senate.gov>
“56th Inaugural Ceremonies … President Barack H. Obama … January 20, 2009”
[280] Calculated with data from the webpage: “Debt to the Penny.” U.S. Department of the Treasury, Bureau of the Fiscal Service. Accessed March 30, 2020 at <fiscaldata.treasury.gov>
“Total Public Debt Outstanding … 06/07/2001 [=] $5,672,373,164,658.13 … 01/20/2009 [=] $10,626,877,048,913.08”
CALCULATION: $10,626,877,048,913.08 – $5,672,373,164,658.13 = $4,954,503,884,254.95
[281] Calculated with data from the webpage: “Debt to the Penny.” U.S. Department of the Treasury, Bureau of the Fiscal Service. Accessed March 30, 2020 at <fiscaldata.treasury.gov>
“Total Public Debt Outstanding … 06/07/2001 [=] $5,672,373,164,658.13 … 01/20/2009 [=] $10,626,877,048,913.08”
CALCULATION: ($10,626,877,048,913.08 – $5,672,373,164,658.13) / $5,672,373,164,658.13 = 87.3%
[282] Calculated with the dataset: “CPI—All Urban Consumers (Current Series).” U.S. Department of Labor, Bureau of Labor Statistics. Accessed January 27, 2023 at <www.bls.gov>
“Series Id: CUUR0000SA0; Series Title: All Items in U.S. City Average, All Urban Consumers, Not Seasonally Adjusted; Area: U.S. City Average; Item: All Items; Base Period: 1982–84=100”
“2001 … June [=] 178.0 … 2009 … January [=] 211.1”
CALCULATION: (211.1 – 178.0) / 178.0 = 18.6%
[283] Calculated with data from:
a) Webpage: “Debt to the Penny.” U.S. Department of the Treasury, Bureau of the Fiscal Service. Accessed March 30, 2020 at <fiscaldata.treasury.gov>
“Total Public Debt Outstanding … 06/07/2001 [=] $5,672,373,164,658.13 … 01/20/2009 [=] $10,626,877,048,913.08”
b) Dataset: “Table 1.1.5. Gross Domestic Product [GDP].” U.S. Department of Commerce, Bureau of Economic Analysis. Last revised March 30, 2023. <apps.bea.gov>
“[Billions of dollars] Seasonally adjusted at annual rates … Gross Domestic Product … 2001 Q2 [=] 10,599.0 … 2009 Q1 [=] 14,430.9”
c) Webpage: “Calculate Duration Between Two Dates.” Accessed August 29, 2018 at <www.timeanddate.com>
“From and including: Thursday, June 7, 2001 … To, and including: Tuesday, January 20, 2009 … It is 2785 days from the start date to the end date, end date included”
CALCULATIONS:
[284] Webpage: “Vetoes by President George W. Bush.” United States Senate. Accessed March 15, 2011 at <www.senate.gov>
“President George W. Bush vetoed twelve bills.”
Vetoes overridden:
H.R.2419: Food, Conservation, and Energy Act of 2008†
H.R.6124: Food, Conservation, and Energy Act of 2008†
H.R.6331: Medicare Improvement for Patients and Providers Act of 2008
H.R.1495: Water Resources Development Act of 2007
NOTE: † “The House and Senate passed H.R. 2419 over veto, enacting 14 of 15 farm bill titles into law. The trade title (title III) was inadvertently excluded from the enrolled bill. To remedy the situation, both chambers re-passed the farm bill conference agreement (including the trade title) as H.R. 6124, again over veto. H.R. 6124, in section 4, repealed Public Law 110-234 and amendments made by it, effective on the date of that Act’s enactment.” Webpage: “H.R.2419: Food, Conservation, and Energy Act of 2008.” Library of Congress. Accessed November 2, 2016 at <www.congress.gov>
[285] Calculated with data from:
a) Report: “H.R. 2419, Food, Conservation, and Energy Act of 2008.” Congressional Budget Office, May 13, 2008. <www.cbo.gov>
Page 1 (of PDF): “Relative to CBO’s [Congressional Budget Office’s] March 2008 baseline projections, we estimate that enacting H.R. 2419 would increase direct spending by about $3.6 billion over the 2008–2018 period, assuming that the legislation would remain in effect throughout that period. JCT [Joint Committee on Taxation] and CBO estimate that revenues would increase under the legislation by $0.7 billion over the same period. On balance, those changes would produce net costs (increases in deficits or reductions in surpluses) of about $2.9 billion over the 11-year period, relative to CBO’s most recent baseline projections.”
b) Report: “Cost Estimate: H.R. 6331, Medicare Improvements for Patients and Providers Act of 2008.” Congressional Budget Office, July 23, 2008. <www.cbo.gov>
Page 1 (of PDF): “CBO estimates that enacting H.R. 6331 will increase direct spending by less than $50 million over the 2008–2013 period and by $0.3 billion over the 2008–2018 period. In addition, the Joint Committee on Taxation (JCT) estimates that the act will increase federal revenues by $0.2 billion over the 2008–2013 period and by $0.4 billion over the 2008–2018 period. In total, CBO estimates that the act will reduce deficits (or increase surpluses) by $0.1 billion over the 2008–2013 period and by less than $50 million over the 2008–2018 period.”
c) Report: “Cost Estimate: H.R. 1495: Water Resources Development Act of 2007.” Congressional Budget Office, September 24, 2007. <www.cbo.gov>
“Assuming appropriation of the necessary amounts, including adjustments for increases in anticipated inflation, CBO estimates that implementing this conference agreement for H.R. 1495 would result in discretionary outlays of about $11.2 billion over the 2008–2012 period and an additional $12.0 billion over the 10 years after 2012. (Some construction costs and operations and maintenance would continue or commence after those first 15 years.)”
CALCULATION: $2.9 billion (over 2008–2018 for H.R. 2419) + $0.1 billion (over 2008–2013 for H.R. 6331) + $11.2 billion (over 2008–2012 for H.R. 1495) + $12.0 billion (over 2013–2022) = 26.2 billion over 2008–2022
[286] “Remarks at the Fiscal Responsibility Summit.” By Barack Obama. The White House, February 23, 2009. <obamawhitehouse.archives.gov>
And that’s why today I’m pledging to cut the deficit we inherited in half by the end of my first term in office. This will not be easy. It will require us to make difficult decisions and face challenges we’ve long neglected. But I refuse to leave our children with a debt that they cannot repay—and that means taking responsibility right now, in this administration, for getting our spending under control.
[287] Transcript: “Obama’s Remarks at Stimulus Bill Signing.” Washington Post, February 17, 2009. <www.washingtonpost.com>
“The American Recovery and Reinvestment Act that I will sign today, a plan that meets the principles I laid out in January, is the most sweeping economic recovery package in our history.”
[288] Webpage: “Past Inaugural Ceremonies.” Joint Congressional Committee on Inaugural Ceremonies. Accessed June 2, 2021 at <www.inaugural.senate.gov>
“58th Inaugural Ceremonies … President Donald J. Trump … January 20, 2017”
[289] Calculated with data from the webpage: “Debt to the Penny.” U.S. Department of the Treasury, Bureau of the Fiscal Service. Accessed March 30, 2020 at <fiscaldata.treasury.gov>
“Total Public Debt Outstanding … 02/17/2009 [=] $10,789,783,760,341.41 … 01/20/2017 [=] $19,947,304,555,212.49”
CALCULATION: $19,947,304,555,212.49 – $10,789,783,760,341.41 = $9,157,520,794,871.08
[290] Calculated with data from the webpage: “Debt to the Penny.” U.S. Department of the Treasury, Bureau of the Fiscal Service. Accessed March 30, 2020 at <fiscaldata.treasury.gov>
“Total Public Debt Outstanding … 02/17/2009 [=] $10,789,783,760,341.41 … 01/20/2017 [=] $19,947,304,555,212.49”
CALCULATION: ($19,947,304,555,212.49 – $10,789,783,760,341.41) / $10,789,783,760,341.41 = 84.9%
[291] Calculated with the dataset: “CPI—All Urban Consumers (Current Series).” U.S. Department of Labor, Bureau of Labor Statistics. Accessed January 27, 2023 at <www.bls.gov>
“Series Id: CUUR0000SA0; Series Title: All Items in U.S. City Average, All Urban Consumers, Not Seasonally Adjusted; Area: U.S. City Average; Item: All Items; Base Period: 1982–84=100”
“2009 … February [=] 212.2 … 2017 … January [=] 242.8”
CALCULATION: (242.8 – 212.2) / 212.2 = 14.4%
[292] Calculated with data from:
a) Webpage: “Debt to the Penny.” U.S. Department of the Treasury, Bureau of the Fiscal Service. Accessed March 30, 2020 at <fiscaldata.treasury.gov>
“Total Public Debt Outstanding … 02/17/2009 [=] $10,789,783,760,341.41 … 01/20/2017 [=] $19,947,304,555,212.49”
b) Dataset: “Table 1.1.5. Gross Domestic Product.” U.S. Department of Commerce, Bureau of Economic Analysis. Last revised March 30, 2023. <apps.bea.gov>
“[Billions of dollars] Seasonally adjusted at annual rates … Gross Domestic Product … 2009 Q1 [=] 14,430.9 … 2017 Q1 [=] 19,148.2”
c) Webpage: “Calculate Duration Between Two Dates.” Accessed April 20, 2018 at <www.timeanddate.com>
“From and including: Tuesday, February 17, 2009 … To and including: Friday, January 20, 2017 … It is 2895 days from the start date to the end date, end date included”
CALCULATIONS:
[293] Webpage: “Vetoes by President Barack H. Obama.” United States Senate. Accessed April 28, 2023 at <www.senate.gov>
“President Barack Obama vetoed twelve bills. … 114th Congress, 2nd Session (2016) … S.2040 … Justice Against Sponsors of Terrorism Act … Sep 23 … Veto overridden by the House on Sep 28 by vote No. 564 (348–77) … Veto overridden by the Senate on Sep 28 by vote No. 148 (97–1).”
[294] Report: “Cost Estimate: S. 2040: Justice Against Sponsors of Terrorism Act.” Congressional Budget Office, January 28, 2016. <www.cbo.gov>
“CBO [Congressional Budget Office] estimates that implementing S. 2040 would have no significant effect on the federal budget.”
[295] Transcript: “Donald Trump Interview with Bob Woodward and Robert Costa.” Washington Post, April 2, 2016. <www.washingtonpost.com>
Trump: “We’ve got to get rid of the $19 trillion in debt.”
Woodward: “How long would that take?”
Trump: “I think I could do it fairly quickly, because of the fact the numbers…”
Woodward: “What’s fairly quickly?”
Trump: “Well, I would say over a period of eight years.”
[296] Article: “Republican-Led Congress Passes Sweeping Tax Bill.” By Benjy Sarlin. NBC News, December 19, 2017. Updated 12/20/2017. <www.nbcnews.com>
“Congress approved a sweeping $1.5 trillion tax bill on Wednesday.… It is the president’s first significant legislative accomplishment and the biggest tax overhaul in a generation.”
[297] “WHO Director-General’s Opening Remarks at the Media Briefing on Covid-19.” World Health Organization, March 11, 2020. <bit.ly>
[Dr. Tedros Adhanom Ghebreyesus:] …
WHO [World Health Organization] has been assessing this outbreak around the clock and we are deeply concerned both by the alarming levels of spread and severity, and by the alarming levels of inaction.
We have therefore made the assessment that COVID-19 can be characterized as a pandemic.
[298] Calculated with data from the webpage: “Debt to the Penny.” U.S. Department of the Treasury, Bureau of the Fiscal Service. Accessed February 25, 2021 at <fiscaldata.treasury.gov>
“Total Public Debt Outstanding … 12/20/2017 [=] $20,492,523,558,087.55 … 3/11/2020 [=] $23,483,045,370,415.47”
CALCULATION: $23,483,045,370,415.47 – $20,492,523,558,087.55 = $2,990,521,812,327.92
[299] Calculated with data from the webpage: “Debt to the Penny.” U.S. Department of the Treasury, Bureau of the Fiscal Service. Accessed February 25, 2021 at <fiscaldata.treasury.gov>
“Total Public Debt Outstanding … 12/20/2017 [=] $20,492,523,558,087.55 … 3/11/2020 [=] $23,483,045,370,415.47”
CALCULATION: ($23,483,045,370,415.47 – $20,492,523,558,087.55) / $20,492,523,558,087.55 = 14.6%
[300] Calculated with the dataset: “CPI—All Urban Consumers (Current Series).” U.S. Department of Labor, Bureau of Labor Statistics. Accessed January 27, 2023 at <www.bls.gov>
“Series Id: CUUR0000SA0; Series Title: All Items in U.S. City Average, All Urban Consumers, Not Seasonally Adjusted; Area: U.S. City Average; Item: All Items; Base Period: 1982–84=100”
“2017 … December [=] 246.5 … 2020 … March [=] 258.1”
CALCULATION: (258.1 – 246.5) / 246.5 = 5.3%
[301] Calculated with data from:
a) Webpage: “Debt to the Penny.” U.S. Department of the Treasury, Bureau of the Fiscal Service. Accessed February 25, 2021 at <fiscaldata.treasury.gov>
“Total Public Debt Outstanding … 12/20/2017 [=] $20,492,523,558,087.55 … 3/11/2020 [=] $23,483,045,370,415.47”
b) Dataset: “Table 1.1.5. Gross Domestic Product.” U.S. Department of Commerce, Bureau of Economic Analysis. Last revised March 30, 2023. <apps.bea.gov>
“[Billions of dollars] Seasonally adjusted at annual rates … Gross domestic product … 2017 Q4 [=] 19,894.8 … 2020 Q1 [=] 21,538.0”
c) Webpage: “Days Calculator: Days Between Two Dates.” Accessed February 25, 2021 at <www.timeanddate.com>
“From and including: Wednesday, December 20, 2017 … To and including: Wednesday, March 11, 2020 … It is 813 days from the start date to the end date, end date included”
CALCULATIONS:
[302] Webpage: “Vetoes by President Donald J. Trump.” United States Senate. Accessed February 24, 2021 at <www.senate.gov>
Vetoes by President Donald J. Trump
President Donald J. Trump has vetoed 10 bills. …
|
116th Congress, 1st Session (2019) |
||||
|
Bill No. |
Subject |
Veto Date |
Presidential Message |
Status |
|
H.J.Res.46 |
Relating to a national emergency declared by the President on February 15, 2019 |
Mar 15 |
H.Doc.116-22 |
The House sustained the vote on Mar 26 by vote No. 127 (248–181). |
|
S.J.Res.7 |
Yemen War Powers Resolution |
Apr 16 |
S.Doc.116-4 |
The Senate sustained the veto on May 2 by vote No. 94 (53–45). |
|
S.J.Res.38 |
Saudi Arabia and United Kingdom of Great Britain and Northern Ireland arms sales disapproval resolution |
Jul 24 |
S.Doc.116-9 |
The Senate sustained the veto on July 29 by vote No. 233 (46–41). |
|
S.J.Res.37 |
UAE arms sales disapproval resolution |
Jul 24 |
S.Doc.116-8 |
The Senate sustained the veto on July 29 by vote No. 232 (45–39). |
|
S.J.Res.36 |
Saudi Arabia, United Kingdom of Great Britain and Northern Ireland, Kingdom of Spain, and Italian Republic arms sales disapproval resolution |
Jul 24 |
S.Doc.116-7 |
The Senate sustained the veto on July 29 by vote No. 231 (45–40). |
|
S.J.Res.54 |
Relating to a national emergency declared by the President on February 15, 2019 |
Oct 15 |
S.Doc.116-11 |
The Senate sustained the veto on Oct 17 by vote No. 325 (53–36). |
[303] “WHO Director-General’s Opening Remarks at the Media Briefing on Covid-19.” World Health Organization, March 11, 2020. <bit.ly>
[Dr. Tedros Adhanom Ghebreyesus:] …
WHO [World Health Organization] has been assessing this outbreak around the clock and we are deeply concerned both by the alarming levels of spread and severity, and by the alarming levels of inaction.
We have therefore made the assessment that COVID-19 can be characterized as a pandemic.
[304] Webpage: “Past Inaugural Ceremonies.” Joint Congressional Committee on Inaugural Ceremonies. Accessed June 2, 2021 at <www.inaugural.senate.gov>
“59th Inaugural Ceremonies … President Joseph R. Biden … January 20, 2021”
[305] Calculated with data from the webpage: “Debt to the Penny.” U.S. Department of the Treasury, Bureau of the Fiscal Service. Accessed June 2, 2021 at <fiscaldata.treasury.gov>
“Total Public Debt Outstanding … 3/11/2020 [=] $23,483,045,370,415.47 … 1/20/2021 [=] $27,751,896,236,414.77”
CALCULATION: $27,751,896,236,414.77 – $23,483,045,370,415.47 = $4,268,850,865,999.30
[306] Calculated with data from the webpage: “Debt to the Penny.” U.S. Department of the Treasury, Bureau of the Fiscal Service. Accessed February 25, 2021 at <fiscaldata.treasury.gov>
“Total Public Debt Outstanding … 3/11/2020 [=] $23,483,045,370,415.47 … 1/20/2021 [=] $27,751,896,236,414.77”
CALCULATION: ($27,751,896,236,414.77 – $23,483,045,370,415.47) / $23,483,045,370,415.47 = 14.6%
[307] Calculated with the dataset: “CPI—All Urban Consumers (Current Series).” U.S. Department of Labor, Bureau of Labor Statistics. Accessed January 27, 2023 at <www.bls.gov>
“Series Id: CUUR0000SA0; Series Title: All Items in U.S. City Average, All Urban Consumers, Not Seasonally Adjusted; Area: U.S. City Average; Item: All Items; Base Period: 1982–84=100”
“2020 … March [=] 258.1 … 2021 … January [=] 261.6”
CALCULATION: (261.6 – 258.1) / 258.1 = 1.3%
[308] Calculated with data from:
a) Webpage: “Debt to the Penny.” U.S. Department of the Treasury, Bureau of the Fiscal Service. Accessed June 2, 2021 at <fiscaldata.treasury.gov>
“Total Public Debt Outstanding … 3/11/2020 [=] $23,483,045,370,415.47 … 1/20/2021 [=] $27,751,896,236,414.77”
b) Dataset: “Table 1.1.5. Gross Domestic Product [GDP].” U.S. Department of Commerce, Bureau of Economic Analysis. Last revised March 30, 2023. <apps.bea.gov>
“[Billions of dollars] Seasonally adjusted at annual rates … Gross Domestic Product … 2020 Q1 [=] 21,538.0 … 2021 Q1 [=] 22,313.9”
c) Webpage: “Days Calculator: Days Between Two Dates.” Accessed February 25, 2021 at <www.timeanddate.com>
“From and including: Wednesday, March 11, 2020 … To and including: Wednesday, January 20, 2021 … It is 316 days from the start date to the end date, end date included”
CALCULATIONS:
[309] Webpage: “Vetoes by President Donald J. Trump.” United States Senate. Accessed February 24, 2021 at <www.senate.gov>
Vetoes by President Donald J. Trump
President Donald J. Trump has vetoed 10 bills. …
|
116th Congress, 2nd Session (2020) |
||||
|
Bill No. |
Subject |
Veto Date |
Presidential Message |
Status |
|
S.J. Res.68 |
Iran War Powers Resolution |
May 06 |
veto message |
The Senate sustained the veto on May 7 by vote No. 84 (49–44). |
|
H.J.Res.76 |
Borrower Defense Institutional Accountability regulation rule |
May 29 |
H.Doc.116-131 |
The House sustained the veto on June 26 by vote No. 120 (238–173). |
|
H.R.6395 |
National Defense Authorization Act for Fiscal Year 2021 |
Dec 23 |
H.Doc.116-174 |
Veto overridden by the House on Dec 28 by vote No. 253 (322–87) Veto overridden by the Senate on Jan 1, 2021 by vote No. 292 (81–13) Veto overridden |
|
S.906 |
Driftnet Modernization and Bycatch Reduction Act |
Jan 1, 2021 |
S.Doc.116-29 |
|
[310] Report: “Direct Spending and Revenue Effects of H.R. 6395, the William M. (Mac) Thornberry National Defense Authorization Act for Fiscal Year 2021.” U.S. Congressional Budget Office, November 2, 2020. <www.cbo.gov>
Page 1:
The Congressional Budget Office has completed the enclosed estimate of the direct spending and revenue effects of H.R. 6395, the William M. (Mac) Thornberry National Defense Authorization Act for Fiscal Year 2021, as passed by the House of Representatives on July 21, 2020. Enacting the legislation would increase both direct spending and revenues. The net increase in the deficit would total $21 million over the 2021–2030 period.
[311] Article: “How Many Workers Are Employed in Sectors Directly Affected by Covid-19 Shutdowns, Where Do They Work, and How Much Do They Earn?” By Matthew Dey and Mark A. Loewenstein. U.S. Bureau of Labor Statistics Monthly Labor Review, April 2020. <www.bls.gov>
Page 1:
To reduce the spread of coronavirus disease 2019 (Covid-19), nearly all states have issued stay-at-home orders and shut down establishments deemed nonessential. Answering the following questions is crucial to assessing the potential labor market impacts of the shutdown policy: How many jobs are in the industries that are shut down? Where are these jobs located? What wages do they pay?
[312] Report: “An Unemployment Crisis after the Onset of Covid-19.” By Nicolas Petrosky-Nadeau and Robert G. Valletta. Federal Reserve Bank of San Francisco, May 18, 2020. <www.frbsf.org>
Page 1:
The wave of initial job losses during the coronavirus disease 2019 (COVID-19) pandemic has been massive, with more than 20 million jobs swept away between March and April. This is much larger than losses recorded during similar time frames in any other postwar recession. As a result, the April unemployment rate spiked to the highest level recorded since the Great Depression of the 1930s.
[313] “Monetary Policy Report.” Board of Governors of the Federal Reserve System, February 19, 2021. <www.federalreserve.gov>
Page 1:
The COVID-19 pandemic continues to weigh heavily on economic activity and labor markets in the United States and around the world, even as the ongoing vaccination campaigns offer hope for a return to more normal conditions later this year. While unprecedented fiscal and monetary stimulus and a relaxation of rigorous social-distancing restrictions supported a rapid rebound in the U.S. labor market last summer, the pace of gains has slowed and employment remains well below pre-pandemic levels.
Page 5:
The public health crisis spurred by the spread of COVID-19 weighed on economic activity throughout 2020, and patterns in the labor market reflected the ebb and flow of the virus and the actions taken by households, businesses, and governments to combat its spread. During the initial stage of the pandemic in March and April, payroll employment plunged by 22 million jobs, while the measured unemployment rate jumped to 14.8 percent—its highest level since the Great Depression….2 As cases subsided and early lockdowns were relaxed, payroll employment rebounded rapidly—particularly outside of the service sectors—and the unemployment rate fell back. Beginning late last year, however, the pace of improvement in the labor market slowed markedly amid another large wave of COVID-19 cases. The unemployment rate declined only 0.4 percentage point from November through January, while payroll gains averaged just 29,000 per month, weighed down by a contraction in the leisure and hospitality sector, which is particularly affected by social distancing and government-mandated restrictions.
[314] Report: “U.S. Economic Recovery in the Wake of Covid-19: Successes and Challenges.” By Marc Labonte and Lida R. Weinstock. Congressional Research Service, May 31, 2022. <crsreports.congress.gov>
Introduction:
The Covid-19 pandemic caused an unprecedented disruption to the basic functioning of the economy in spring 2020. According to the National Bureau of Economic Research (NBER), an independent, nonprofit research group, the U.S. economy experienced a two-month recession in March and April of 2020.1 The recession was the deepest since the Great Depression, with gross domestic product (GDP) falling by the largest percentage in one quarter in the history of the data series and unemployment rising to its highest monthly rate in the history of that series. Just as economic activity had declined at a historically fast pace, it also started to recover at a historically fast pace. In May 2020, a new economic expansion began, spurred in large part by the historic nature of both fiscal and monetary stimulus throughout the initial months of the pandemic.
[315] Speech: “Remarks By President Biden on the Economy.” By Joseph R. Biden. White House, May 10, 2022. <www.whitehouse.gov>
Finally, let’s do one more comparison. Let’s compare our two plans when it comes to the deficit.
Republicans love to attack me as a big spender, as if that’s the reason why inflation has gone up. Let’s compare the facts.
Under my predecessor, the deficit exploded, raising—rising every single year under the Republicans.
Under my plan, we’re on track to cut the federal deficit by $1.5 trillion this year. Let me say it again: $1.5 trillion by the end of this fiscal year. The biggest one-year decline in all of history for America. And that’s in addition to last year we cut the budget $350 billion—the deficit, not the budget. The deficit: $350 billion.
My Treasury Department is planning to pay down the national debt this quarter, which never happened under my predecessor. Not once. Not once.
Because unlike my predecessor, the deficit has gone down both years I’ve been here. That is not an abstraction. It matters. It matters to families, because reducing the deficit is one of the main ways we can ease inflationary pressures.
Look, the bottom line is this: Americans have a choice right now between two paths, reflecting two very different sets of values.
My plan attacks inflation and grows the economy by lowering costs for working families, giving workers well-deserved raises, reducing the deficit by historic levels, and making big corporations and the very wealthiest Americans pay their fair share.
NOTES:
SOURCES:
Page 2 (of PDF): “Deficits … have widened significantly as a result of the economic disruption caused by the pandemic and the enactment of legislation in response. … Projected outlays decline relative to GDP [gross domestic product]
for the next few years, as pandemic-related spending wanes and low interest rates persist.”
“This bill provides additional relief to address the continued impact of COVID-19 (i.e., coronavirus disease 2019) on the economy, public health, state and local governments, individuals, and businesses.”
Page 1: “Estimated Effects on the Budget, 2021–2030 (in Billions of Dollars) … American Rescue Plan Act of 2021 … Increase in the Deficit [=] 1,856”
Pages 3–12: “American Rescue Plan Act of 2021 … Unemployment Benefits … Assistance to Individuals … Assistance to Businesses … Assistance to State, Local, and Tribal Governments … Medicare … Medicaid and CHIP [Children’s Health Insurance Program] … Premium Tax Credits and Other Health Insurance … Other Health and Human Services … Education … Agriculture … Funding for Federal Agencies to Respond to the Pandemic … Miscellaneous … Provides assistance to certain multiemployer defined benefit pension plans and reduces funding requirements for single-employer pension plans”
[316] Webpage: “House Resolution 1319: American Rescue Plan Act of 2021.” U.S. House of Representatives, 117th Congress (2021–2022). Accessed April 22, 2023 at <www.congress.gov>
“Date … 03/10/2021 … Actions Overview … Resolving differences -- House actions: On motion that the House agree to the Senate amendment Agreed to by the Yeas and Nays: 220–211….”
[317] Calculated with data from the webpage: “Debt to the Penny.” U.S. Department of the Treasury, Bureau of the Fiscal Service. Accessed April 29, 2023 at <fiscaldata.treasury.gov>
“Total Public Debt Outstanding … 03/10/2021 [=] $27,926,627,063,040.10 … 12/30/2022 [=] $31,419,689,421,557.90”
CALCULATION: $31,419,689,421,557.90 – $27,926,627,063,040.10 = $3,493,062,358,517.80
[318] Calculated with data from the webpage: “Debt to the Penny.” U.S. Department of the Treasury, Bureau of the Fiscal Service. Accessed April 29, 2023 at <fiscaldata.treasury.gov>
“Total Public Debt Outstanding … 03/10/2021 [=] $27,926,627,063,040.10 … 12/30/2022 [=] $31,419,689,421,557.90”
CALCULATION: ($31,419,689,421,557.90 – $27,926,627,063,040.10) / $27,926,627,063,040.10 = 12.5%
[319] Calculated with the dataset: “CPI—All Urban Consumers (Current Series).” U.S. Department of Labor, Bureau of Labor Statistics. Accessed April 29, 2023 at
“Series Id: CUUR0000SA0; Series Title: All Items in U.S. City Average, All Urban Consumers, Not Seasonally Adjusted; Area: U.S. City Average; Item: All Items; Base Period: 1982–84=100”
“2021 … March [=] 264.9 … 2022 … December [=] 296.8”
CALCULATION: (296.8 – 264.9) / 264.9 = 12.0%
[320] Calculated with data from:
a) Webpage: “Debt to the Penny.” U.S. Department of the Treasury, Bureau of the Fiscal Service. Accessed April 29, 2023 at <fiscaldata.treasury.gov>
“Total Public Debt Outstanding … 03/10/2021 [=] $27,926,627,063,040.10 … 12/30/2022 [=] $31,419,689,421,557.90”
b) Dataset: “Table 1.1.5. Gross Domestic Product.” U.S. Department of Commerce, Bureau of Economic Analysis. Last revised April 27, 2023. <apps.bea.gov>
“[Billions of dollars] Seasonally adjusted at annual rates … Gross domestic product … 2021 Q1 [=] 22,313.9 … 2023 Q1 [=] 26,138.0”
c) Webpage: “Days Calculator: Days Between Two Dates.” Accessed April 29, 2023 at <www.timeanddate.com>
“From and including: Wednesday, March 10, 2021 … To and including: Saturday, December 31, 2022 … It is 662 days from the start date to the end date, end date included”
CALCULATIONS:
[321] Webpage: “Vetoes by President Joseph R. Biden Jr.” United States Senate. Accessed April 28, 2023 at <www.senate.gov>
“President Joseph R. Biden Jr. has vetoed 1 bill. … 118th Congress, 1st Session (2023) … H.J.Res.30 … Department of Labor Rule on Prudence and Loyalty in Selecting Plan Investments and Exercising Shareholder Rights … Mar 20”
[322] Article: “How Many Workers Are Employed in Sectors Directly Affected by Covid-19 Shutdowns, Where Do They Work, and How Much Do They Earn?” By Matthew Dey and Mark A. Loewenstein. U.S. Bureau of Labor Statistics Monthly Labor Review, April 2020. <www.bls.gov>
Page 1:
To reduce the spread of coronavirus disease 2019 (Covid-19), nearly all states have issued stay-at-home orders and shut down establishments deemed nonessential. Answering the following questions is crucial to assessing the potential labor market impacts of the shutdown policy: How many jobs are in the industries that are shut down? Where are these jobs located? What wages do they pay?
[323] Report: “An Unemployment Crisis after the Onset of Covid-19.” By Nicolas Petrosky-Nadeau and Robert G. Valletta. Federal Reserve Bank of San Francisco, May 18, 2020. <www.frbsf.org>
Page 1:
The wave of initial job losses during the coronavirus disease 2019 (COVID-19) pandemic has been massive, with more than 20 million jobs swept away between March and April. This is much larger than losses recorded during similar time frames in any other postwar recession. As a result, the April unemployment rate spiked to the highest level recorded since the Great Depression of the 1930s.
[324] “Monetary Policy Report.” Board of Governors of the Federal Reserve System, February 19, 2021. <www.federalreserve.gov>
Page 1:
The COVID-19 pandemic continues to weigh heavily on economic activity and labor markets in the United States and around the world, even as the ongoing vaccination campaigns offer hope for a return to more normal conditions later this year. While unprecedented fiscal and monetary stimulus and a relaxation of rigorous social-distancing restrictions supported a rapid rebound in the U.S. labor market last summer, the pace of gains has slowed and employment remains well below pre-pandemic levels.
Page 5:
The public health crisis spurred by the spread of COVID-19 weighed on economic activity throughout 2020, and patterns in the labor market reflected the ebb and flow of the virus and the actions taken by households, businesses, and governments to combat its spread. During the initial stage of the pandemic in March and April, payroll employment plunged by 22 million jobs, while the measured unemployment rate jumped to 14.8 percent—its highest level since the Great Depression….2 As cases subsided and early lockdowns were relaxed, payroll employment rebounded rapidly—particularly outside of the service sectors—and the unemployment rate fell back. Beginning late last year, however, the pace of improvement in the labor market slowed markedly amid another large wave of COVID-19 cases. The unemployment rate declined only 0.4 percentage point from November through January, while payroll gains averaged just 29,000 per month, weighed down by a contraction in the leisure and hospitality sector, which is particularly affected by social distancing and government-mandated restrictions.
[325] Report: “U.S. Economic Recovery in the Wake of Covid-19: Successes and Challenges.” By Marc Labonte and Lida R. Weinstock. Congressional Research Service, May 31, 2022. <crsreports.congress.gov>
Introduction:
The Covid-19 pandemic caused an unprecedented disruption to the basic functioning of the economy in spring 2020. According to the National Bureau of Economic Research (NBER), an independent, nonprofit research group, the U.S. economy experienced a two-month recession in March and April of 2020.1 The recession was the deepest since the Great Depression, with gross domestic product (GDP) falling by the largest percentage in one quarter in the history of the data series and unemployment rising to its highest monthly rate in the history of that series. Just as economic activity had declined at a historically fast pace, it also started to recover at a historically fast pace. In May 2020, a new economic expansion began, spurred in large part by the historic nature of both fiscal and monetary stimulus throughout the initial months of the pandemic. The recovery continued throughout 2020 and 2021, bolstered by additional stimulus, the gradual loosening of travel restrictions and stay-at-home orders, and the eventual rollout of Covid-19 vaccines and treatments.2
Fiscal and monetary support continued through 2021, as did the economic recovery. Despite the brevity of the recession and the rapid recovery, most economic indicators—such as output and unemployment—had not fully recovered until the latter part of 2021. To date, in the aggregate, the recovery has been fairly robust, but there are nonetheless frictions in the economy that indicate it has not fully returned to normal yet. As the U.S. economy has rebounded from the disruptions caused by the initial stages of the pandemic, it is now characterized by relatively tight labor markets and inflation higher than the United States has experienced since the 1980s. In addition to high inflation, the key economic policy challenges going forward relate to supply disruptions, a low labor force participation rate, and maintaining financial stability in light of rapid asset price appreciation in 2020 and 2021.
[326] Article: “Inflation and the Real Value of Debt: A Double-Edged Sword.” By Christopher J. Neely (Ph.D., Economics). Federal Reserve Bank of St. Louis, On the Economy, August 1, 2022. <www.stlouisfed.org>
An increase in the price level directly reduces the real value of government debt, as well as the ratio of debt to GDP [gross domestic product], because—holding other things constant—higher prices increase nominal GDP. Thus, surprise inflation transfers wealth from holders of U.S. government debt—who include both Americans and non-Americans—to U.S. taxpayers.3
This transfer is not an unalloyed good even for U.S. taxpayers, however, because unexpected inflation will tend to raise the cost of servicing future U.S. debt—i.e., nominal yields—by increasing the expected rate of inflation and the risk premium associated with inflation.
[327] Book: This Time is Different: Eight Centuries of Financial Folly. By Carmen M. Reinhart (University of Maryland) and Kenneth S. Rogoff (Harvard University). Princeton University Press, 2009.
Page 65: “Governments can also default on domestic public debt through high and unanticipated inflation, as the United States and many European countries famously did in the 1970s.”
Page 175:
[I]nflation has long been the weapon of choice in sovereign defaults on domestic debt and, where possible, on international debt. … [G]overnments engage in massive monetary expansion, in part because they can thereby gain a seigniorage tax on real money balances (by inflating down the value of citizens’ currency and issuing more to meet demand). But they also want to reduce, or even wipe out, the real value of public debts outstanding.
Page 400: “Seigniorage is simply the real income a government can realize by exercising its monopoly on printing currency. The revenue can be broken down into the quantity of currency needed to meet the growing transactions demand at constant prices and the remaining growth, which causes inflation, thereby lowering the purchasing power of existing currency.”
[328] Book: Is U.S. Government Debt Different? Edited by Franklin Allen and others. Penn Law, Wharton, FIC Press, 2012. <finance.wharton.upenn.edu>
Chapter 5: “Origins of the Fiscal Constitution.” By Michael W. McConnell (Director of the Constitutional Law Center at Stanford Law School). Pages 45–53.
Pages 49–50:
Section Four of the Amendment states: “The validity of the public debt of the United States, authorized by law, including debts incurred for payment of pensions and bounties for services in suppressing insurrection or rebellion, shall not be questioned.” This was designed to prevent a southern Democratic majority from repudiating the Civil War debt. … The Supreme Court has interpreted the provision only once, in Perry v. United States2, the so-called Gold Clause Cases. The Court allowed Congress to renege on its contractual agreement to pay the debt in gold; this is when U.S. public debt became denominated in dollars. Effectively, this means that even if Section Four forbids Congress to declare a formal default, it could accomplish much the same thing by inflating the debt away.
[329] “2010 Annual Report of the Board of Trustees of The Federal Old-Age and Survivors Insurance and Federal Disability Insurance Trust Funds.” United States Social Security Administration, August 9, 2010. <www.ssa.gov>
Page 138:
The Federal Old-Age and Survivors Insurance (OASI) Trust Fund was established on January 1, 1940 as a separate account in the United States Treasury. The Federal Disability Insurance (DI) Trust Fund, another separate account in the United States Treasury, was established on August 1, 1956. All the financial operations of the OASI and DI programs are handled through these respective funds.
[330] Report: “Federal Debt: Answers To Frequently Asked Questions, An Update.” U.S. Government Accountability Office, August 12, 2004. <www.gao.gov>
Page 1: “Debt held by the public plus debt held by government accounts represent total debt, or gross federal debt.”
Pages 10–12:
Debt held by the public approximates current federal demand on credit markets. It represents a burden on today’s economy, and the interest paid on this debt represents a burden on current taxpayers. Federal borrowing from the public absorbs resources available for private investment and may put upward pressure on interest rates. Further, debt held by the public is the accumulation of what the federal government borrowed in the past and is reported as a liability on the balance sheet of the government’s consolidated financial statements.
In contrast, debt held by government accounts (intragovernmental debt) and the interest on it represent a claim on future resources. This debt performs largely an internal accounting function. Special federal securities credited to government accounts (primarily trust funds) represent the cumulative surpluses of these accounts that have been lent to the general fund. These transactions net out on the government’s consolidated financial statements. Debt issued to government accounts does not affect today’s economy and does not currently compete with the private sector for available funds in the credit market.
However, debt held by government accounts reflects a future burden on taxpayers and the economy. The special federal securities held in the accounts represent legal obligations of the Treasury and are guaranteed for principal and interest by the full faith and credit of the U.S. government. When a government account needs to pay expenditures exceeding its receipts from the public, the Treasury must provide cash to redeem debt held by the government account. For example, according to 2004 Trustees projections, the Social Security trust funds will have insufficient tax income to pay scheduled benefits by 2018. The trust funds will begin drawing on the Treasury to cover the cash deficit, first relying on interest income and eventually drawing down accumulated trust fund assets. The government must obtain cash to finance this spending in excess of earmarked tax receipts either through increased taxes, spending cuts, increased borrowing from the public, retiring less debt (if the unified budget is in surplus), or some combination thereof.
Because debt held by the trust funds is not equal to the future benefit costs implied by the current design of the programs, it cannot be seen as a measure of the government’s total future commitment to programs financed by trust funds. The projected accumulated balances held by trust funds can provide one signal about the underlying fiscal imbalances in these programs. Trust fund balances do not provide meaningful information about program sustainability. The critical question is whether the government as a whole can afford the benefits in the future and at what cost in terms of other claims on scarce resources.
[331] Report: “Debt Limit: History and Recent Increases.” By D. Andrew Austin and Mindy R. Levit. Congressional Research Service, October 15, 2013. <www.everycrsreport.com>
Page 2 (of PDF): “[D]ebt increases when the federal government issues debt to certain government accounts, such as the Social Security, Medicare, and Transportation trust funds, in exchange for their reported surpluses. This increases debt held by government accounts.”
[332] Webpage: “Debt Versus Deficit: What’s the Difference?” United States Department of the Treasury, Bureau of the Fiscal Service, August 5, 2004. <www.treasurydirect.gov>
“Additionally, the Government Trust Funds are required by law to invest accumulated surpluses in Treasury securities. The Treasury securities issued to the public and to the Government Trust Funds (intragovernmental holdings) then become part of the total debt.”
[333] “2010 Annual Report of the Board of Trustees of The Federal Old-Age and Survivors Insurance and Disability Insurance Trust Funds.” Board of Trustees of the Federal OASDI Trust Funds, August 9, 2010. <www.ssa.gov>
Page 221: “Funds not withdrawn for current monthly or service benefits, the financial interchange, and administrative expenses are invested in interest-bearing Federal securities, as required by law; the interest earned is also deposited in the trust funds.”
[334] Report: “Federal Debt and Interest Costs.” Congressional Budget Office, December 2010. <www.cbo.gov>
Page IX:
Because those trust funds and other government accounts are part of the federal government, transactions between them and the Treasury are intragovernmental; that is, the government securities in those funds are an asset to the individual programs but a liability to the rest of the government. The resources needed to redeem the government securities in the trust funds and other accounts in some future year must be generated from taxes, income from other government sources, or borrowing by the government in that year.
[335] Report: “Analytical Perspectives: Budget of the U.S. Government, Fiscal Year 2011.” White House Office of Management and Budget. <www.gpo.gov>
Page 57: “The … Federal social insurance and employee retirement programs, which own 93 percent of the debt held by Government accounts, are important in their own right and need to be analyzed separately.”
[336] Webpage: “Debt to the Penny.” U.S. Department of the Treasury, Bureau of the Fiscal Service. Accessed April 3, 2023 at <fiscaldata.treasury.gov>
NOTE: As shown in this source, the Bureau of the Fiscal Service breaks down the “Total Public Debt Outstanding” into “Debt Held by the Public” and “Intragovernmental Holdings.” Forthcoming facts define these terms.
[337] Report: “Debt Limit: History and Recent Increases.” By D. Andrew Austin and Mindy R. Levit. Congressional Research Service, October 15, 2013. <www.everycrsreport.com>
Page 2 (of PDF):
Total federal debt can increase in two ways. First, debt increases when the government sells debt to the public to finance budget deficits and acquire the financial resources needed to meet its obligations. This increases debt held by the public. Second, debt increases when the federal government issues debt to certain government accounts, such as the Social Security, Medicare, and Transportation trust funds, in exchange for their reported surpluses. This increases debt held by government accounts. The sum of debt held by the public and debt held by government accounts is the total federal debt.
[338] Webpage: “FAQs About the Public Debt.” United States Department of the Treasury, Bureau of the Fiscal Service. Accessed April 3, 2023 at <treasurydirect.gov>
What is the Debt Held by the Public?
The Debt Held by the Public is all federal debt held by individuals, corporations, state or local governments, Federal Reserve Banks, foreign governments, and other entities outside the United States Government less Federal Financing Bank securities. Types of securities held by the public include, but are not limited to, Treasury Bills, Notes, Bonds, TIPS [Treasury Inflation-Protected Securities], United States Savings Bonds, and State and Local Government Series securities.
[339] Paper: “Government Debt.” By Douglas W. Elmendorf (Federal Reserve Board) and N. Gregory Mankiw (Harvard University and the National Bureau of Economic Research), January 1998. <www.federalreserve.gov>
Page 2: “The figure shows federal debt ‘held by the public,’ which includes debt held by the Federal Reserve System but excludes debt held by other parts of the federal government, such as the Social Security trust fund.”
[340] Report: “Federal Debt and Interest Costs.” Congressional Budget Office, December 2010. <www.cbo.gov>
Pages 13–14:
Ownership of Federal Debt Held by the Public …
A significant amount of federal debt is held by the Federal Reserve—the nation’s central bank and an independent entity within the government that is responsible for conducting monetary policy, among other activities.
[341] For some prime examples, see Just Facts’ article “Does the Social Security Trust Fund Really Exist?”
[342] Webpage: “FAQs: National Debt.” U.S. Treasury. Last updated September 8, 2014. <home.treasury.gov>
The term national debt refers to direct liabilities of the United States Government. There are several different concepts of debt that are at various times used to refer to the national debt:
• Public debt is defined as public debt securities issued by the U.S. Treasury. U.S. Treasury securities primarily consist of marketable Treasury securities (i.e., bills, notes and bonds), savings bonds and special securities issued to state and local governments. A portion is debt held by the public and a portion is debt held by government accounts.
[343] Report: “The Budget and Economic Outlook: Fiscal Years 2013 to 2023.” U.S. Congressional Budget Office, February 2013. <www.cbo.gov>
Page 28: “Gross Federal Debt … Comprises federal debt held by the public plus Treasury securities held by federal trust funds and other government accounts.”
[344] Report: “Analytical Perspectives: Budget of the U.S. Government, Fiscal Year 2011.” White House Office of Management and Budget. <www.gpo.gov>
Page 56: “The gross Federal debt is defined to consist of both the debt held by the public and the debt held by Government accounts. Nearly all the Federal debt has been issued by the Treasury and is sometimes called ‘public debt,’ but a small portion has been issued by other Government agencies and is called ‘agency debt.’ ”
[345] Webpage: “FAQs: National Debt.” U.S. Treasury. Last updated September 8, 2014. <home.treasury.gov>
The term national debt refers to direct liabilities of the United States Government. There are several different concepts of debt that are at various times used to refer to the national debt: …
• Debt Held by the Public excludes the portion of the debt that is held by government accounts.
[346] Report: “Analytical Perspectives: Budget of the U.S. Government, Fiscal Year 2011.” White House Office of Management and Budget. <www.gpo.gov>
Page 56: “For the purposes of the Budget, ‘debt held by the public’ is defined as debt held by investors outside of the Federal Government, both domestic and foreign, including U.S. State and local governments and foreign governments. It also includes debt held by the Federal Reserve.”
[347] “2009 Financial Report of the United States Government.” U.S. Department of the Treasury, February 26, 2010. <fiscal.treasury.gov>
Page 4: “[T]he largest contributors to the Government’s net cost include … the interest paid on debt held by the public (i.e., publicly-held debt).”
[348] Report: “Debt Limit: History and Recent Increases.” By D. Andrew Austin and Mindy R. Levit. Congressional Research Service, October 15, 2013. <www.everycrsreport.com>
Page 2 (of PDF): “[D]ebt increases when the federal government issues debt to certain government accounts, such as the Social Security, Medicare, and Transportation trust funds, in exchange for their reported surpluses. This increases debt held by government accounts.”
[349] Testimony: “An Overview of Federal Debt.” By Paul L. Posner. U.S. General Accounting Office, June 24, 1998. <www.gao.gov>
Page 2: “[G]overnment held debt is expected to grow due to the large projected increases in trust fund surpluses invested in special Treasury securities.”
[350] Webpage: “FAQs About the Public Debt.” United States Department of the Treasury, Bureau of the Fiscal Service. Accessed April 3, 2023 at <treasurydirect.gov>
What are Intragovernmental Holdings?
Intragovernmental Holdings are Government Account Series securities held by Government trust funds, revolving funds, and special funds; and Federal Financing Bank securities. A small amount of Treasury marketable securities are held by government accounts.
[351] Report: “Monthly Statement of the Public Debt of the United States.” U.S. Treasury, Bureau of the Fiscal Service. December 31, 2022. <fiscaldata.treasury.gov>
Page 1: “Table I—Summary of Treasury Securities Outstanding, December 31, 2022 (Millions of Dollars) … Amount Outstanding … Debt Held By the Public [=] 24,517,593 … Intragovernmental Holdings [=] 6,902,096 … Totals [=] 31,419,689”
[352] United States Code Title 31, Subtitle III, Chapter 31, Subchapter II, Section 3123: “Payment of Obligations and Interest on the Public Debt.” Accessed April 3, 2023 at <www.law.cornell.edu>
“(a) The faith of the United States Government is pledged to pay, in legal tender, principal and interest on the obligations of the Government issued under this chapter.”
[353] Report: “United States Federal Debt: Answers To Frequently Asked Questions, An Update.” U.S. Government Accountability Office, August 12, 2004. <www.gao.gov>
Page 1: “Debt held by the public plus debt held by government accounts represent total debt, or gross federal debt.”
Pages 10–12:
Debt held by the public approximates current federal demand on credit markets. It represents a burden on today’s economy, and the interest paid on this debt represents a burden on current taxpayers. Federal borrowing from the public absorbs resources available for private investment and may put upward pressure on interest rates. Further, debt held by the public is the accumulation of what the federal government borrowed in the past and is reported as a liability on the balance sheet of the government’s consolidated financial statements.
In contrast, debt held by government accounts (intragovernmental debt) and the interest on it represent a claim on future resources. This debt performs largely an internal accounting function. Special federal securities credited to government accounts (primarily trust funds) represent the cumulative surpluses of these accounts that have been lent to the general fund. These transactions net out on the government’s consolidated financial statements. Debt issued to government accounts does not affect today’s economy and does not currently compete with the private sector for available funds in the credit market.
However, debt held by government accounts reflects a future burden on taxpayers and the economy. The special federal securities held in the accounts represent legal obligations of the Treasury and are guaranteed for principal and interest by the full faith and credit of the U.S. government. When a government account needs to pay expenditures exceeding its receipts from the public, the Treasury must provide cash to redeem debt held by the government account. For example, according to 2004 Trustees projections, the Social Security trust funds will have insufficient tax income to pay scheduled benefits by 2018. The trust funds will begin drawing on the Treasury to cover the cash deficit, first relying on interest income and eventually drawing down accumulated trust fund assets. The government must obtain cash to finance this spending in excess of earmarked tax receipts either through increased taxes, spending cuts, increased borrowing from the public, retiring less debt (if the unified budget is in surplus), or some combination thereof.
Because debt held by the trust funds is not equal to the future benefit costs implied by the current design of the programs, it cannot be seen as a measure of the government’s total future commitment to programs financed by trust funds. The projected accumulated balances held by trust funds can provide one signal about the underlying fiscal imbalances in these programs. Trust fund balances do not provide meaningful information about program sustainability. The critical question is whether the government as a whole can afford the benefits in the future and at what cost in terms of other claims on scarce resources.
[354] Report: “Analytical Perspectives: Budget of the U.S. Government, Fiscal Year 2011.” White House Office of Management and Budget. <www.gpo.gov>
Page 57:
However, issuing debt to Government accounts does not have any of the credit market effects of borrowing from the public. It is an internal transaction of the Government, made between two accounts that are both within the Government itself. Issuing debt to a Government account is not a current transaction of the Government with the public; it is not financed by private saving and does not compete with the private sector for available funds in the credit market. While such issuance provides the account with assets—a binding claim against the Treasury—those assets are fully offset by the increased liability of the Treasury to pay the claims, which will ultimately be covered by taxation or borrowing. Similarly, the current interest earned by the Government account on its Treasury securities does not need to be financed by other resources. …
For all these reasons, debt held by the public and debt net of financial assets are both better gauges of the effect of the budget on the credit markets than gross Federal debt.
[355] Report: “Analytical Perspectives: Budget of the U.S. Government, Fiscal Year 2010.” White House Office of Management and Budget. <www.gpo.gov>
Page 223: “Debt is the largest legally binding obligation of the Federal Government. At the end of 2008, the Government owed $5,803 billion of principal to the individuals and institutions who had loaned it the money to fund past deficits.”
NOTE: As proof that the statement above excludes the debt owed to federal entities, consider that at the end of fiscal year 2008 (September 30, 2008), the gross national debt was $10,025 billion, which consisted of $5,809 billion of publicly held debt and $4,216 billion of government-held debt. [Webpage: “Debt to the Penny.” U.S. Department of the Treasury, Bureau of the Fiscal Service. Accessed April 4, 2011 at <fiscaldata.treasury.gov>]
[356] Report: “The Long-Term Budget Outlook.” Congressional Budget Office, June 2010. Revised August 2010. <www.cbo.gov>
Page 13:
The most meaningful measure of federal debt for such projections is debt held by the public, which represents the amount that the government is borrowing in the financial markets (by issuing Treasury securities) to pay for federal operations and activities. That borrowing competes with other participants in the credit markets for financial resources and can crowd out private investment.14
14 In contrast, debt held by trust funds and other government accounts—which, together with debt held by the public, make up gross federal debt—represents internal transactions of the government and thus has no effect on credit markets.
[357] “2008 Financial Report of the United States Government.” U.S. Department of the Treasury, 2008. <www.fiscal.treasury.gov>
Page 26: “Intra-governmental debt is not shown on the balance sheet because claims of one part of the Government against another are eliminated for consolidation purposes (see Financial Statement Note 11).”
[358] Report: “United States Federal Debt: Answers To Frequently Asked Questions, An Update.” U.S. Government Accountability Office, August 12, 2004. <www.gao.gov>
Page 1: “Debt held by the public plus debt held by government accounts represent total debt, or gross federal debt.”
Pages 10–12:
Debt held by the public approximates current federal demand on credit markets. It represents a burden on today’s economy, and the interest paid on this debt represents a burden on current taxpayers. Federal borrowing from the public absorbs resources available for private investment and may put upward pressure on interest rates. Further, debt held by the public is the accumulation of what the federal government borrowed in the past and is reported as a liability on the balance sheet of the government’s consolidated financial statements.
In contrast, debt held by government accounts (intragovernmental debt) and the interest on it represent a claim on future resources. This debt performs largely an internal accounting function. Special federal securities credited to government accounts (primarily trust funds) represent the cumulative surpluses of these accounts that have been lent to the general fund. These transactions net out on the government’s consolidated financial statements. Debt issued to government accounts does not affect today’s economy and does not currently compete with the private sector for available funds in the credit market.
However, debt held by government accounts reflects a future burden on taxpayers and the economy. The special federal securities held in the accounts represent legal obligations of the Treasury and are guaranteed for principal and interest by the full faith and credit of the U.S. government. When a government account needs to pay expenditures exceeding its receipts from the public, the Treasury must provide cash to redeem debt held by the government account. For example, according to 2004 Trustees projections, the Social Security trust funds will have insufficient tax income to pay scheduled benefits by 2018. The trust funds will begin drawing on the Treasury to cover the cash deficit, first relying on interest income and eventually drawing down accumulated trust fund assets. The government must obtain cash to finance this spending in excess of earmarked tax receipts either through increased taxes, spending cuts, increased borrowing from the public, retiring less debt (if the unified budget is in surplus), or some combination thereof.
Because debt held by the trust funds is not equal to the future benefit costs implied by the current design of the programs, it cannot be seen as a measure of the government’s total future commitment to programs financed by trust funds. The projected accumulated balances held by trust funds can provide one signal about the underlying fiscal imbalances in these programs. Trust fund balances do not provide meaningful information about program sustainability. The critical question is whether the government as a whole can afford the benefits in the future and at what cost in terms of other claims on scarce resources.
[359] “2010 Annual Report of the Board of Trustees of The Federal Old-Age and Survivors Insurance and Federal Disability Insurance Trust Funds.” United States Social Security Administration, August 9, 2010. <www.ssa.gov>
Page 141: “Another source of income to the trust funds is interest received on investments held by the trust funds. That portion of each trust fund that is not required to meet the current cost of benefits and administration is invested, on a daily basis, primarily in interest-bearing obligations of the U.S. Government (including special public-debt obligations described below).”
Page 2: “Total income was $807 billion ($689 billion in tax revenue and $118 billion in interest earnings), and assets held in special issue U.S. Treasury securities grew to $2.5 trillion.”
[360] Dataset: “Table VI.F7. Operations of the Combined OASI and DI Trust Funds, in Constant 2010 Dollars, Calendar Years 2010–85 [In billions].” United States Social Security Administration, Office of the Chief Actuary. Last reviewed or modified August 5, 2010. <www.ssa.gov>
NOTES:
[361] “Status of the Social Security and Medicare Programs: A Summary of the 2000 Annual Reports.” Social Security and Medicare Boards of Trustees, April 2000. <www.ssa.gov>
Page 1: “Trust fund operations, in billions of dollars … HI [Hospital Insurance, a.k.a., Medicare Part A] … Assets (end of 1999) [=] 141.4”
[362] “Prosperity for America’s Families: The Gore Lieberman Economic Plan.” Gore/Lieberman, Inc., September 2000. <www.laputan.org>
NOTE: Just Facts searched this document from cover to cover three times while examining all uses of the word “debt.” In all such instances, the intergovernmental debt is not mentioned, acknowledged, or included in any of the data. This document uses the phrases “publicly held debt” and “debt held by the public” a total of five times. On more than 150 other occasions, the document uses terms such as “debt,” “federal debt,” and “national debt,” when in fact, it is actually referring only to the publicly held debt in many of these cases.
[363] “Prosperity for America’s Families: The Gore Lieberman Economic Plan.” Gore/Lieberman, Inc., September 2000. <www.laputan.org>
Page 12: “But with Social Security projected to become insolvent in 2037‡ and Medicare in 2025,† they face looming challenges that are just around the corner.”
NOTES:
[364] United States Code Title 31, Subtitle II, Chapter 11, Section 1102: “Fiscal Year.” Accessed April 3, 2023 at <www.law.cornell.edu>
“The fiscal year of the Treasury begins on October 1 of each year and ends on September 30 of the following year.”
[365] Calculated with data from the webpage: “Debt to the Penny.” U.S. Department of the Treasury, Bureau of the Fiscal Service. Accessed April 5, 2011 at <fiscaldata.treasury.gov>
“Total Public Debt Outstanding … 10/1/2009 [=] $11,920,519,164,319 … 9/30/2010 [=] $13,561,623,030,892”
CALCULATION: $13,561,623,030,892 – $11,920,519,164,319 = $1,641,103,866,573 increase in national debt during fiscal year 2010
NOTE: Using a different methodology, the White House Office of Management and Budget arrives at a very similar figure of $1,653 billion. [Report: “Analytical Perspectives: Budget of the U.S. Government, Fiscal Year 2012.” White House Office of Management and Budget. <www.gpo.gov>. Page 61: “In [fiscal year] 2010 the … gross Federal debt increased by $1,653 billion….”]
[366] “Economic Report of the President (Together with the Annual Report
of the Council of Economic Advisers).” White House, February 2011. <obamawhitehouse.archives.gov>
Page 40: “The Federal budget deficit on September 30, the end of fiscal year 2010, was $1.29 trillion, down about 8.5 percent from $1.41 trillion the year before.”
[367] Article: “Obama’s Budget Deficit: Still $1.3 Trillion.” By Richard Wolf. USA Today, October 15, 2010. <content.usatoday.com>
“The $1.29 trillion is the official U.S. budget deficit for the 2010 fiscal year, which ended two weeks ago.”
[368] Article: “Fiscal 2010 Deficit Thins to $1.29 Trillion.” By Donna Smith. Reuters, October 16, 2010. <www.reuters.com>
“The budget deficit for fiscal 2010 narrowed to $1.294 trillion from last year’s record $1.416 trillion as tax collections started to recover and bailout spending fell sharply.”
[369] Report: “Analytical Perspectives: Budget of the U.S. Government, Fiscal Year 2012.” White House Office of Management and Budget. <www.gpo.gov>
Page 136: “Unified budget includes receipts from all sources and outlays for all programs of the Federal Government, including both on- and off-budget programs.”
Page 137: “The Federal Government has used the unified budget concept as the foundation for its budgetary analysis and presentation since the 1969 Budget….”
Page 64: “Debt Held by Government Accounts.—The amount of Federal debt issued to Government accounts depends largely on the surpluses of the trust funds, both on-budget and off-budget, which owned 92 percent of the total Federal debt held by Government accounts at the end of 2010. … The remainder of debt issued to Government accounts is owned by a number of special funds and revolving funds.”
Page 73: “The trust fund surplus reduces the total budget deficit or increases the total budget surplus….”
Pages 68–69 contain a listing of all federal programs to which money is owed: “Debt Held by Government Accounts1 (in Millions of Dollars) … Investment or Disinvestment … 2010 Actual … Total, investment in Federal debt1 [=] 178,723”
NOTE: To understand how this all fits together, see the calculation shown two footnotes below.
[370] Report: “Analytical Perspectives: Budget of the U.S. Government, Fiscal Year 2012.” White House Office of Management and Budget. <www.gpo.gov>
Page 139:
To illustrate the budgetary and non-budgetary components of a credit program, consider a portfolio of new direct loans made to a cohort of college students. To encourage higher education, the Government offers loans at a lower cost than private lenders. Students agree to repay the loans according to the terms of their promissory notes. The loan terms may include lower interest rates or longer repayment periods than would be available from private lenders. Some of the students are likely to become delinquent or default on their loans, leading to Government losses to the extent the Government is unable to recover the full amount owed by the students. … In other words, the subsidy cost is the difference in present value between the amount disbursed by the Government and the estimated value of the loan assets the Government receives in return. Because the loan assets have value, the remainder of the transaction (beyond the amount recorded as a subsidy) is simply an exchange of financial assets of equal value and does not result in a cost to the Government.
Page 129:
Borrowing is not exactly equal to the deficit, and debt repayment is not exactly equal to the surplus, because of the other means of financing such as those discussed in this section. …
The budget treats borrowing and debt repayment as a means of financing, not as receipts and outlays. …
In 2010, the Government borrowed $1,474 billion from the public, bringing debt held by the public to $9,019 billion. This borrowing financed the $1,293 billion deficit in that year as well as the net effect of the other means of financing, such as changes in cash balances and other accounts discussed below. …
The budget records the net cash flows of credit programs in credit financing accounts. These accounts include the transactions for direct loan and loan guarantee programs, as well as the equity purchase programs under TARP [Troubled Asset Relief Program]….
Page 63: “In 2010 the deficit was $1,293 billion while these other factors—primarily the net disbursements of credit financing accounts—increased the need to borrow by $181 billion.”
NOTE: To understand how this all fits together, see the calculation shown in the next footnote.
[371] The following calculation reconciles the reported budget deficit for fiscal year 2010 and the increase in national debt during this period. All data are from the footnotes above.
CALCULATION: $1,293 billion “deficit” + $181 billion “other means of financing” + $179 billion increase in “debt held by government accounts” = $1,653
This figure of $1,653 is exactly the same as that cited in the source for all of the data used in this calculation. [Report: “Analytical Perspectives: Budget of the U.S. Government, Fiscal Year 2012.” White House Office of Management and Budget. <www.gpo.gov>. Page 61: “In [fiscal year] 2010 the … gross Federal debt increased by $1,653 billion….”]
[372] Webpage: “About PolitiFact.” Accessed November 4, 2016 at <www.politifact.com>
PolitiFact is a project of the Tampa Bay Times and its partners to help you find the truth in politics.
Every day, reporters and researchers from PolitiFact and its partner news organization examine statements by members of Congress, state legislators, governors, mayors, the president, cabinet secretaries, lobbyists, people who testify before Congress and anyone else who speaks up in American politics. We research their statements and then rate the accuracy on our Truth-O-Meter—True, Mostly True, Half True, Mostly False and False. The most ridiculous falsehoods get our lowest rating, Pants on Fire.
[373] Article: “$5 Trillion Added to National Debt Under Bush.” By Angie Drobnic Holan. PolitiFact, January 22, 2009. <www.politifact.com>
At the end of the Clinton administration, there were several years of budget surpluses. …
When Bush took office, the national debt was $5.73 trillion. When he left, it was $10.7 trillion. …
So even though he [Rahm Emanuel] is off by about 20 percent, the fact that the number has been surging lately supports his point that the debt increased greatly under Bush. So we rate his statement Mostly True.
[374] Webpage: “Past Inauguration Ceremonies.” Joint Congressional Committee on Inaugural Ceremonies. Accessed June 2, 2021 at <www.inaugural.senate.gov>
“52nd Inaugural Ceremonies … President William J. Clinton … January 20, 1993
53rd Inaugural Ceremonies … President William J. Clinton … January 20, 1997
52nd Inaugural Ceremonies … President George W. Bush … January 20, 2001”
[375] Webpage: “Debt to the Penny.” U.S. Department of the Treasury, Bureau of the Fiscal Service. Accessed March 7, 2019 at <fiscaldata.treasury.gov>
|
Inaugural Date / Anniversary |
Date of Debt Data |
National Debt |
|
1/20/1993 |
1/20/1993 |
$4,188,092,107,184 |
|
1/20/1994 |
1/20/1994 |
$4,500,676,535,250 |
|
1/20/1995 |
1/20/1995 |
$4,796,537,934,596 |
|
1/20/1996 |
1/19/1996 |
$4,988,397,941,589 |
|
1/20/1997 |
1/21/1997 |
$5,310,267,076,517 |
|
1/20/1998 |
1/20/1998 |
$5,495,525,658,807 |
|
1/20/1999 |
1/20/1999 |
$5,623,807,213,463 |
|
1/20/2000 |
1/20/2000 |
$5,706,174,969,874 |
|
1/20/2001 |
1/19/2001 |
$5,727,776,738,305 |
NOTES:
|
Fiscal Year Outset |
Date of Debt Data |
National Debt |
|
10/1/1993 |
10/1/1993 |
$4,406,339,573,433 |
|
10/1/1994 |
9/30/1994 |
$4,692,749,910,013 |
|
10/1/1995 |
10/2/1995 |
$4,987,587,163,003 |
|
10/1/1996 |
10/1/1996 |
$5,234,730,786,627 |
|
10/1/1997 |
10/1/1997 |
$5,420,505,789,573 |
|
10/1/1998 |
10/1/1998 |
$5,540,570,493,226 |
|
10/1/1999 |
10/1/1999 |
$5,652,679,330,611 |
|
10/1/2000 |
10/2/2000 |
$5,661,548,045,675 |
|
10/1/2001 |
10/1/2001 |
$5,806,151,389,190 |
[376] United States Code Title 31, Subtitle II, Chapter 11, Section 1102: “Fiscal Year.” Accessed April 3, 2023 at <www.law.cornell.edu>
“The fiscal year of the Treasury begins on October 1 of each year and ends on September 30 of the following year.”
[377] Calculated with data from:
a) Report: “Treasury Bulletin.” U.S. Department of the Treasury, Financial Management Service, March 2023. <fiscal.treasury.gov>
Page 45: “Table OFS-2—Estimated Ownership of U.S. Treasury Securities”
b) Report: “Factors Affecting Reserve Balances of Depository Institutions and Condition Statement of Federal Reserve Banks.” U.S. Federal Reserve, September 29, 2022. <www.federalreserve.gov>
Pages 1–2: Table “1. Factors Affecting Reserve Balances of Depository Institutions [Millions of Dollars]”
c) Report: “Monthly Statement of the Public Debt of the United States.” U.S. Bureau of the Fiscal Service, September 30, 2022.
Page 1: “Table I—Summary of Treasury Securities Outstanding, September 30, 2022”
Pages 2–13: “Table III—Detail of Treasury Securities Outstanding, September 30, 2022”
d) Dataset: “Major Foreign Holders of Treasury Securities Holdings (In Billions of Dollars).” U.S. Department of the Treasury, March 15, 2023. <ticdata.treasury.gov>
NOTE: An Excel file containing the data and calculations is available upon request.
[378] Calculated with data from:
a) Report: “Treasury Bulletin.” U.S. Department of the Treasury, Financial Management Service, March 2023. <fiscal.treasury.gov>
Page 45: “Table OFS-2—Estimated Ownership of U.S. Treasury Securities”
b) Report: “Factors Affecting Reserve Balances of Depository Institutions and Condition Statement of Federal Reserve Banks.” U.S. Federal Reserve, September 29, 2022. <www.federalreserve.gov>
Pages 1–2 (of PDF) “1. Factors Affecting Reserve Balances of Depository Institutions”
c) Report: “Monthly Statement of the Public Debt of the United States.” U.S. Bureau of the Fiscal Service, September 30, 2022.
Page 1: “Table I—Summary of Treasury Securities Outstanding, September 30, 2022”
Pages 2–13: “Table III—Detail of Treasury Securities Outstanding, September 30, 2022”
d) Dataset: “Major Foreign Holders of Treasury Securities Holdings (In Billions of Dollars).” U.S. Department of the Treasury, March 15, 2023. <ticdata.treasury.gov>
NOTE: An Excel file containing the data and calculations is available upon request.
[379] Calculated with data from the reports: “Treasury Bulletin.” Board of Governors of the Federal Reserve System. <fraser.stlouisfed.org>
1933–1939: “Summary Distribution by Classes of Holders of Interest-Bearing Securities Issued by United States Government and Guaranteed by United States (In millions of dollars)”
1940–1958: “Table 1. – Distribution of Federal Securities by Classes of Investors and Types of Issues (In millions of dollars)”
1959: “Table 1. – Distribution of Certain Federal Securities by Classes of Investors and Types of Issues (In millions of dollars)”
1960–2022: “Table OFS-1.—Distribution of Federal Securities by Classes of Investors and Types of Issues (In millions of dollars)”
NOTE: An Excel file containing the data and calculations is available upon request.
[380] Calculated with data from the report: “Monthly Statement of the Public Debt of the United States.” U.S. Bureau of the Fiscal Service, September 30, 2022.
Page 1: “Table I—Summary of Treasury Securities Outstanding, September 30, 2022 … (Millions of Dollars) … Total Public Debt Outstanding … Debt Held By the Public [=] $24,299,193 … Intragovernmental Holdings [=] $6,629,719 … Totals [=] $30,928,912
CALCULATIONS:
[381] Paper: “Government Debt.” By Douglas W. Elmendorf (Federal Reserve Board) and N. Gregory Mankiw (Harvard University and the National Bureau of Economic Research), January 1998. <www.federalreserve.gov>
Page 2: “The figure shows federal debt ‘held by the public,’ which includes debt held by the Federal Reserve System….”
[382] Calculated with data from:
a) Report: “Treasury Bulletin.” U.S. Department of the Treasury, Financial Management Service, March 2023. <fiscal.treasury.gov>
Page 45: “Table OFS-2—Estimated Ownership of U.S. Treasury Securities”
b) Report: “Factors Affecting Reserve Balances of Depository Institutions and Condition Statement of Federal Reserve Banks.” U.S. Federal Reserve, September 29, 2022. <www.federalreserve.gov>
Pages 1–2 (of PDF) “1. Factors Affecting Reserve Balances of Depository Institutions”
c) Report: “Monthly Statement of the Public Debt of the United States.” U.S. Bureau of the Fiscal Service, September 30, 2022.
Page 1: “Table I—Summary of Treasury Securities Outstanding, September 30, 2022”
Pages 2–13: “Table III—Detail of Treasury Securities Outstanding, September 30, 2022”
d) Dataset: “Major Foreign Holders of Treasury Securities Holdings (In Billions of Dollars).” U.S. Department of the Treasury, March 15, 2023. <ticdata.treasury.gov>
NOTE: An Excel file containing the data and calculations is available upon request.
[383] Report: “Analytical Perspectives: Budget of the U.S. Government, Fiscal Year 2024.” White House Office of Management and Budget, March 13, 2023. <www.whitehouse.gov>
Page 245:
During most of American history, the Federal debt was held almost entirely by individuals and institutions within the United States. In the late 1960s, foreign holdings were just over $10 billion, less than 5 percent of the total Federal debt held by the public. [“Debt held by the public” is the largest part of the total national debt.] Foreign holdings began to grow significantly in the early 1970s, and then remained about 15–20 percent of total Federal debt until the mid-1990s. During 1995–97, growth in foreign holdings accelerated, reaching 33 percent by the end of 1997. From 2004 to 2019, foreign holdings of Federal debt generally represented around 40 percent or more of outstanding [publicly held] debt. …
Although foreign holdings of Treasury debt continued to grow in dollars, by the end of 2020, foreign holdings had fallen to 34 percent of the total debt held by the public. In 2022, foreign holdings fell in both dollar terms, to $7,252 billion, and as a percent of total debt held by the public, to 30 percent.30
[384] Calculated with data from:
a) Report: “Treasury Bulletin.” U.S. Department of the Treasury, Financial Management Service, March 2023. <fiscal.treasury.gov>
Page 45: “Table OFS-2—Estimated Ownership of U.S. Treasury Securities”
b) Report: “Factors Affecting Reserve Balances of Depository Institutions and Condition Statement of Federal Reserve Banks.” U.S. Federal Reserve, September 29, 2022. <www.federalreserve.gov>
Pages 1–2 (of PDF) “1. Factors Affecting Reserve Balances of Depository Institutions”
c) Report: “Monthly Statement of the Public Debt of the United States.” U.S. Bureau of the Fiscal Service, September 30, 2022.
Page 1: “Table I—Summary of Treasury Securities Outstanding, September 30, 2022”
Pages 2–13: “Table III—Detail of Treasury Securities Outstanding, September 30, 2022”
d) Dataset: “Major Foreign Holders of Treasury Securities Holdings (In Billions of Dollars).” U.S. Department of the Treasury, March 15, 2023. <ticdata.treasury.gov>
NOTE: An Excel file containing the data and calculations is available upon request.
[385] Article: “Experts Warn Debt May Threaten Economy.” By Robert Tanner. Associated Press, August 27, 2005. <www.heraldtribune.com>
“In a very real sense, the U.S. economy is dependent on the central banks of Japan, China and other nations to invest in U.S. Treasuries and keep American interest rates down. The low rates here keep American consumers buying imported goods.”
[386] Report: “China’s Holdings of U.S. Securities: Implications for the U.S. Economy.” By Wayne M. Morrison and Marc Labonte. Congressional Research Service, January 9, 2008. <www.justfacts.com>
Page 9:
All else equal, Chinese government purchases of U.S. assets increases the demand for U.S. assets, which reduces U.S. interest rates.
If China attempted to reduce its holdings of U.S. securities, they would be sold to other investors (foreign and domestic), who would presumably require higher interest rates than those prevailing today to be enticed to buy them. … All else equal, the reduction in Chinese Treasury holdings would cause the overall foreign demand for U.S. assets to fall, and this would cause the dollar to depreciate. … The magnitude of these effects would depend on how many U.S. securities China sold; modest reductions would have negligible effects on the economy given the vastness of U.S. financial markets.
[387] Report: “China’s Holdings of U.S. Securities: Implications for the U.S. Economy.” By Wayne M. Morrison and Marc Labonte. Congressional Research Service, January 9, 2008. <www.justfacts.com>
Pages 10–11:
A potentially serious short-term problem would emerge if China decided to suddenly reduce their liquid U.S. financial assets significantly. The effect could be compounded if this action triggered a more general financial reaction (or panic), in which all foreigners responded by reducing their holdings of U.S. assets. The initial effect could be a sudden and large depreciation in the value of the dollar, as the supply of dollars on the foreign exchange market increased, and a sudden and large increase in U.S. interest rates, as an important funding source for investment and the budget deficit was withdrawn from the financial markets. The dollar depreciation would not cause a recession since it would ultimately lead to a trade surplus (or smaller deficit), which expands aggregate demand.28 (Empirical evidence suggests that the full effects of a change in the exchange rate on traded goods takes time, so the dollar may have to “overshoot” its eventual depreciation level in order to achieve a significant adjustment in trade flows in the short run.)29 However, a sudden increase in interest rates could swamp the trade effects and cause a recession. Large increases in interest rates could cause problems for the U.S. economy, as these increases reduce the market value of debt securities, cause prices on the stock market to fall, undermine efficient financial intermediation, and jeopardize the solvency of various debtors and creditors. Resources may not be able to shift quickly enough from interest-sensitive sectors to export sectors to make this transition fluid. The Federal Reserve could mitigate the interest rate spike by reducing short-term interest rates, although this reduction would influence long-term rates only indirectly, and could worsen the dollar depreciation and increase inflation.
Some U.S. officials have expressed doubts that a Chinese sell-off of U.S. securities would cause liquidity problems or have much of an impact on the U.S. economy. In January 2007, Secretary of Treasury Henry Paulson was asked at a Senate Banking Committee hearing whether or not he was concerned over China’s large ownership of U.S. debt. Paulson stated that the daily volume of trade in Treasury securities was larger than China’s total Treasury securities holdings and concluded: “given the size of our debt outstanding and the way it trades and the diversity and so on, that’s not at the top of the list.”30
28 A sharp decline in the value of the dollar would also reduce living standards, all else equal, because it would raise the price of imports to households. This effect, which is referred to as a decline in the terms of trade, would not be recorded directly in GDP [gross domestic product], however.
29 Since the decline in the dollar would raise import prices, this could temporarily increase inflationary pressures. The effect would likely be modest, however, since imports are small as a share of GDP and import prices would only gradually rise in response to the fall in the dollar.
[388] Report: “China’s Holdings of U.S. Securities: Implications for the U.S. Economy.” By Wayne M. Morrison and Marc Labonte. Congressional Research Service, January 9, 2008. <www.justfacts.com>
Pages 11–12:
The likelihood that China would suddenly reduce its holdings of U.S. securities is questionable because it is unlikely that doing so would be in China’s economic interests. First, a large sell-off of China’s U.S. holdings could diminish the value of these securities in international markets, which would lead to large losses on the sale, and would, in turn, decrease the value of China’s remaining dollar-denominated assets. This would also occur if the value of the dollar were greatly diminished in international currency markets due to China’s sell-off.34
Second, such a move would diminish U.S. demand for Chinese imports, either through a rise in the value of the yuan against the dollar or a reduction in U.S. economic growth (especially if other foreign investors sold their U.S. asset holdings, and the United States was forced to raise interest rates in response).35 The United States purchases about 30% of China’s total merchandise exports. A sharp reduction of U.S. imports from China could have a significant impact on China’s economy, which heavily depends on exports for its economic growth (and is viewed by the government as a vital source of political stability).36
[389] Article: “Clinton Wraps Asia Trip by Asking China to Buy U.S. Debt.” By Lachlan Carmichael. Sydney Morning Herald, February 22, 2009. <www.smh.com.au>
“By continuing to support American Treasury instruments the Chinese are recognising our interconnection. We are truly going to rise or fall together,” Clinton said at the US embassy here. …
“We have to incur more debt. It would not be in China’s interest if we were unable to get our economy moving again.” …
Clinton added: “The US needs the investment in Treasury bonds to shore up its economy to continue to buy Chinese products.”
[390] Article: “China Threatens ‘Nuclear Option’ of Dollar Sales.” By Ambrose Evans-Pritchard. London Telegraph, August 8, 2007. <www.telegraph.co.uk>
Two officials at leading Communist Party bodies have given interviews in recent days warning—for the first time—that Beijing may use its $1.33 trillion (£658bn) of foreign reserves as a political weapon to counter pressure from the US Congress. …
Xia Bin, finance chief at the Development Research Centre (which has cabinet rank), kicked off what now appears to be government policy with a comment last week that Beijing’s foreign reserves should be used as a “bargaining chip” in talks with the US. …
He Fan, an official at the Chinese Academy of Social Sciences, went even further today, letting it be known that Beijing had the power to set off a dollar collapse if it choose to do so.
“China has accumulated a large sum of US dollars. Such a big sum, of which a considerable portion is in US treasury bonds, contributes a great deal to maintaining the position of the dollar as a reserve currency. Russia, Switzerland, and several other countries have reduced the their [sic] dollar holdings.
“China is unlikely to follow suit as long as the yuan’s exchange rate is stable against the dollar. The Chinese central bank will be forced to sell dollars once the yuan appreciated dramatically, which might lead to a mass depreciation of the dollar,” he told China Daily.
[391] Article: “Chinese See U.S. Debt as Weapon in Taiwan Dispute.” By Bill Gertz. Washington Times, February 10, 2010. <washingtontimes.com>
Gen. Luo warned that China could attack the U.S. “by oblique means and stealthy feints,” and he called for retaliation for the arms sale.
“For example, we could sanction them using economic means, such as dumping some U.S. government bonds,” Gen. Luo said.
“Our retaliation should not be restricted to merely military matters, and we should adopt a strategic package of counterpunches covering politics, military affairs, diplomacy and economics to treat both the symptoms and root cause of this disease,” said Gen. Luo, a researcher at the Academy of Military Sciences.
[392] Article: “Beijing Vows Not to Use U.S. Debt for Political Gain.” Washington Times, March 10, 2010. <www.washingtontimes.com>
“The U.S. Treasury market is the world’s largest government bond market,” said Yi Gang, the head of the State Administration of Foreign Exchange. “Our foreign exchange reserves are huge, so you can imagine that the U.S. Treasury market is important to us,” he said during the annual session of China’s parliament.
Mr. Yi emphasized his hope that China’s investment in U.S. Treasury securities would not become a political football.
“This is purely market-driven investment behavior. I would hope not to see this matter politicized,” he said in response to a question about American concerns that Beijing’s holdings of U.S. debt posed a political threat.
[393] Calculated with data from the report: “Monthly Statement of the Public Debt of the United States.” U.S. Bureau of the Fiscal Service, September 30, 2022.
Page 1: “Table I—Summary of Treasury Securities Outstanding, September 30, 2022”
Pages 2–13: “Table III—Detail of Treasury Securities Outstanding, September 30, 2022”
NOTE: An Excel file containing the data and calculations is available upon request.
[394] Article: “Congress Approves Budget Bill, Sends to Obama.” Associated Press, April 14, 2011. <www.mprnews.org>
“Congress sent President Barack Obama hard-fought legislation cutting a record $38 billion from domestic spending on Thursday, bestowing bipartisan support on the first major compromise between the White House and newly empowered Republicans in Congress.”
[395] Article: “Budget Deal to Cut $38 Billion Averts Shutdown.” By Carl Hulse. New York Times, April 8, 2011. <www.nytimes.com>
“Although both sides compromised, Republicans were able to force significant spending concessions from Democrats in exchange for putting to rest some of the vexing social policy fights that had held up the agreement.”
[396] Article: “New Cuts Detailed in Federal Budget Compromise.” By Lisa Mascaro. Los Angeles Times, April 12, 2011. <www.latimes.com>
“Democrats and White House officials acceded to Deep cuts in programs for the poor, law enforcement, the environment and civic projects to reach a budget deal that averted a federal government shutdown, according to new details of the $38-billion spending cut package.”
[397] Calculated with data from the report: “H.R. 1473, the Department of Defense and Full-Year Continuing Appropriations Act of 2011 (Additional Information).” Congressional Budget Office, April 14, 2011. <www.cbo.gov>
The estimated range provided above is lower than the estimated net change in budget authority (the authority for federal agencies to enter into obligations) for 2011 that would result from enactment of H.R. 1473 [i.e., “the $38 billion budget cut”], compared with earlier continuing resolutions. For example, Public Law 111-322, which funded the government’s operations through March 4, provided (on an annualized basis) budget authority of $1,087.5 billion for nonemergency appropriations for fiscal year 2011—an amount that is relatively close to the funding level for 2010.‡ In contrast, H.R. 1473 would provide net new budget authority of $1,049.8 billion, producing a difference of $37.7 billion. That difference reflects reductions in budget authority for BOTH regularly appropriated discretionary programs and some mandatory programs.
NOTES:
† CALCULATION: $1,089.7 billion (enacted budget authority during 2010) – $1,049.8 billion (budget authority under the 2011 budget cut) = $39.9 billion differential
[398] Calculated with data from:
a) Report: “Fiscal Year 2012 Historical Tables, Budget of the U.S. Government.” White House Office of Management and Budget, 2011. <www.gpo.gov>
Pages 21–23: “Table 1.1—Summary of Receipts, Outlays, and Surpluses or Deficits, 1789–2016”
Pages 211–212: “Table 10.1—Gross Domestic Product and Deflators used in the Historical Tables, 1940–2016”
b) Report: “An Analysis of the President’s Budgetary Proposals for Fiscal Year 2012.” Congressional Budget Office, April 2011. <www.cbo.gov>
Page 2: “Table 1-1. Comparison of Projected Revenues, Outlays, and Deficits Under CBO’s [Congressional Budget Office’s] March 2011 Baseline and CBO’s Estimate of the President’s Budget (Billions of dollars) … 2011 … Revenues [=] 2,230 … Outlays [=] 3,629 … Total Deficit = –1,399.”
Page 4: “Table 1-2. CBO’s Estimate of the President’s Budget … Gross Domestic Product … 2011 [=] 15,034 [billions $]”
NOTE: An Excel file containing the data and calculations is available upon request.
[399] Calculated with data from:
a) Report: “Fiscal Year 2012 Historical Tables, Budget of the U.S. Government.” White House Office of Management and Budget, 2011. <www.gpo.gov>
Page 21: “Table 1.1—Summary of Receipts, Outlays, and Surpluses or Deficits, 1789–2016”
Page 211: “Table 10.1—Gross Domestic Product and Deflators used in the Historical Tables, 1940–2016”
b) Report: “An Analysis of the President’s Budgetary Proposals for Fiscal Year 2012.” Congressional Budget Office, April 2011. <www.cbo.gov>
Page 2: “Table 1-1. Comparison of Projected Revenues, Outlays, and Deficits Under CBO’s [Congressional Budget Office] March 2011 Baseline and CBO’s Estimate of the President’s Budget (Billions of dollars) … 2011 … Revenues [=] 2,230 … Outlays [=] 3,629 … Total Deficit = –1,399.”
Page 4: “Table 1-2. CBO’s Estimate of the President’s Budget … Gross Domestic Product … 2011 [=] 15,034 [billions $]”
NOTE: An Excel file containing the data and calculations is available upon request.
[400] Commentary: “The Graph All Budget Discussions Should Start With.” By Ezra Klein. Washington Post, April 11, 2011. <www.washingtonpost.com>
“That’s Austin Frakt’s graph, which uses the Congressional Budget Office’s September numbers, and it shows what happens if we do … nothing. The answer, as you can see, is that the budget comes roughly into balance.”
NOTES:
[401] Report: “The Long-Term Budget Outlook.” Congressional Budget Office, June 2010. Revised August 2010. <www.cbo.gov>
Page x: “The first long-term budget scenario used in this analysis, the extended-baseline scenario, adheres closely to current law.”
[402] Commentary: “The Graph All Budget Discussions Should Start With.” By Ezra Klein. Washington Post, April 11, 2011. <www.washingtonpost.com>
Except for No. 3, this isn’t the Obama administration’s plan. They want to extend most of the Bush tax cuts, and they don’t have a doc fix. But this is, nevertheless, a pretty good plan. For one thing, it doesn’t require 60 votes in the Senate. What requires 60 votes in the Senate, rather, is stopping it from happening. For another, it’s a balanced mix of revenues, through returning tax rates to Clinton-era levels and implementing the taxes in the Affordable Care Act, and program cuts, through however we handle doctor payments in Medicare and the various cuts included in the Affordable Care Act.
[403] Report: “The Long-Term Budget Outlook.” Congressional Budget Office, June 2010 (Revised August 2010). <www.cbo.gov>
Page x: “The first long-term budget scenario used in this analysis, the extended-baseline scenario, adheres closely to current law.”
[404] “Supplemental Data for the Congressional Budget Office’s Long-Term Budget Outlook.” Congressional Budget Office, June 2010. <www.cbo.gov>
Tab: “Summary Data for the Extended-Baseline Scenario”
Tab: “Figure 1-2. Federal Debt Held by the Public Under CBO’s [Congressional Budget Office] Long-Term Budget Scenarios”
[405] Commentary: “The Graph All Budget Discussions Should Start With.” By Ezra Klein. Washington Post, April 11, 2011. <www.washingtonpost.com>
Except for No. 3, this isn’t the Obama administration’s plan. They want to extend most of the Bush tax cuts, and they don’t have a doc fix. But this is, nevertheless, a pretty good plan. For one thing, it doesn’t require 60 votes in the Senate. What requires 60 votes in the Senate, rather, is stopping it from happening. For another, it’s a balanced mix of revenues, through returning tax rates to Clinton-era levels and implementing the taxes in the Affordable Care Act, and program cuts, through however we handle doctor payments in Medicare and the various cuts included in the Affordable Care Act.
[406] Report: “The Long-Term Budget Outlook.” Congressional Budget Office, June 2010. Revised August 2010. <www.cbo.gov>
Page 59:
Rising real incomes, however, cause an ever-larger proportion of income to be subject to higher tax rates, a phenomenon known as “real bracket creep.” Rising real incomes also increase taxes by reducing taxpayers’ eligibility for various credits, such as the earned income tax credit and the child tax credit. In addition, some provisions of the tax code are not indexed for inflation, so cumulative inflation would generate some increase in receipts relative to GDP [gross domestic product].
[407] Report: “The Long-Term Budget Outlook.” Congressional Budget Office, June 2010. Revised August 2010. <www.cbo.gov>
Page 6: “Revenues would also rise considerably under current law; by the 2020s, they would reach higher levels relative to the size of the economy than ever recorded in the nation’s history.”
[408] Report: “The Long-Term Budget Outlook.” Congressional Budget Office, June 2010. Revised August 2010. <www.cbo.gov>
Page x: “The first long-term budget scenario used in this analysis, the extended-baseline scenario, adheres closely to current law.”
Page 12: “Federal revenues have fluctuated between 15 percent and 21 percent of GDP [gross domestic product] over the past 40 years, averaging about 18 percent.”
[409] Dataset: “The Long-Term Budget Outlook.” Congressional Budget Office, June 2010. <www.cbo.gov>
Tab: “Summary Data for the Extended-Baseline Scenario”
Tab: “Fig 1-1. Revenues and Primary Spending, by Category, Under CBO’s [Congressional Budget Office’s] Long-Term Budget Scenarios”
[410] Transcript: “Fareed Zakaria GPS: Interview with Paul Volcker.” CNN, February 14, 2010. <transcripts.cnn.com>
Fareed Zakaria, Host: This is GPS, the Global Public Square. … Now, please understand that the Bush tax cuts are the single largest part of the black hole that is the federal budget deficit. Letting them expire would take rates back to where they were under Bill Clinton, when the economy grew very robustly. And cutting the deficit without any tax increases would require massive cuts in middle class programs that would never pass.
NOTE: Credit for bringing this fact to our attention belongs to NewsBusters [“Fareed Zakaria: Bush Tax Cuts Are Largest Cause of Budget Deficit.” By Noel Sheppard. February 14, 2010. <www.newsbusters.org>].
[411] Letter: “From Peter R. Orszag (Director, Congressional Budget Office) to John M. Spratt, Jr. (Chairman, U.S. House Budget Committee).” Congressional Budget Office, July 20, 2007. <www.cbo.gov>
Page 1:
JCT [the Joint Committee on Taxation] estimated the revenue effects of EGTRRA [Economic Growth and Taxpayer Relief Act of 2001] and JGTRRA [Jobs and Growth Tax Relief Reconciliation Act of 2003] at the time the acts were considered in 2001 and 2003, respectively. Taken together, those estimates imply a loss of revenues totaling $165 billion in 2007. As you requested, CBO [Congressional Budget Office] has calculated the debt-service costs that would result in 2007 from the legislation under an assumption that they were financed in full by additional debt rather than offset elsewhere in the budget. On that basis, CBO estimates that the revenue loss in JCT’s projections would lead to additional debt-service costs of $46 billion in 2007, for a total budgetary cost of $211 billion. On the same basis, the agency estimates the total budgetary costs, including interest, for 2008 through 2011 to be $233 billion, $245 billion, $269 billion, and $215 billion, respectively.
NOTES:
[412] In 2011, Just Facts conducted a thorough search of all federal agencies for a later source than the previous footnote and found that it provided the most current federal source for this data. On April 11, 2011, Just Facts contacted the Congressional Budget Office, White House Office of Management and Budget, and Joint Committee on Taxation to ask if they had later data. The Joint Committee on Taxation and White House Office of Management and Budget replied negatively, and the Congressional Budget Office did not respond. Just Facts located several estimates by non-federal organizations but found their methodologies to be dubious. In 2016, Just Facts conducted another search of Congressional Budget Office data and found nothing more recent than the previous footnote.
[413] Calculated with data from the report: “Analytical Perspectives: Budget of the U.S. Government, Fiscal Year 2012.” White House Office of Management and Budget. <www.gpo.gov>
Page 120: “Table 12–1. Totals For the Budget and the Federal Government (In billions of dollars) … 2010 Actual … Outlays (Unified) [=] 3,456 … Deficit (Unified) [=] 1,293”
CALCULATIONS:
[414] Report: “The 2014 Long-Term Budget Outlook.” Congressional Budget Office, July 15, 2014. <www.cbo.gov>
Page 56: “CBO’s [Congressional Budget Office’s] baseline and extended baseline are meant to be benchmarks for measuring the budgetary effects of legislation, so they mostly reflect the assumption that current laws remain unchanged.”
Page 66:
Most parameters of the tax code are not indexed for real income growth, and some are not indexed for inflation. As a result, the personal exemption, the standard deduction, the amount of the child tax credit, and the thresholds for taxing income at different rates all would tend to decline relative to income over time under current law. One consequence is that, under the extended baseline, average federal tax rates would increase in the long run.
NOTE: For more details about this phenomenon, which is known as “bracket creep,” see Just Facts’ research on taxes.
[415] Webpage: “Past Inaugural Ceremonies.” Joint Congressional Committee on Inaugural Ceremonies. Accessed April 5, 2022 at <www.inaugural.senate.gov>
“President George W. Bush … January 20, 2001”
[416] Report: “The Budget and Economic Outlook: An Update.” Congressional Budget Office, August 2011. <www.cbo.gov>
Page 85:
Economic Growth and Tax Relief Reconciliation Act of 2001 (EGTRRA): This legislation (Public Law 107-16) significantly reduced tax liabilities (the amount of tax owed) between 2001 and 2010 by cutting individual income tax rates, increasing the child tax credit, repealing estate taxes, raising deductions for married couples who file joint returns, increasing tax benefits for pensions and individual retirement accounts, and creating additional tax benefits for education. EGTRRA phased in many of those changes, including some that did not become fully effective until 2010. For legislation that modified or extended provisions of EGTRRA, see Jobs and Growth Tax Relief Reconciliation Act of 2003 and Tax Relief, Unemployment Insurance Reauthorization, and Job Creation Act of 2010.
Page 87:
Jobs and Growth Tax Relief Reconciliation Act of 2003 (JGTRRA): This legislation (Public Law 108-27) reduced taxes by advancing to 2003 the effective date of several tax reductions previously enacted in the Economic Growth and Tax Relief Reconciliation Act of 2001. JGTRRA also increased the exemption amount for the individual alternative minimum tax, reduced the tax rates for income from dividends and capital gains, and expanded the portion of capital purchases that businesses could immediately deduct through 2004. Those tax provisions were set to expire on various dates. (The law also provided roughly $20 billion for fiscal relief to states.)
[417] Report: “Major Tax Issues in the 111th Congress.” By James M. Bickley and Andrew Hanna. Congressional Research Service, December 11, 2009. <www.everycrsreport.com>
Pages 19–20:
The Economic Growth and Tax Relief Reconciliation Act of 2001 (EGTRRA; P.L. 107-16) provided a substantial tax cut that it scheduled to be phased in over the 10 years following its enactment. However, to comply with a Senate procedural rule for legislation affecting the budget (the “Byrd rule”), the act contained language “sunsetting” its provisions after calendar year 2010. Thus, all of EGTRRA’s tax cuts expire at the end of 2010.
The most prominent provisions EGTRRA scheduled for phase-in were
• reduction in statutory individual income tax rates;
• creation of a new 10% tax bracket;
• an increase in the per-child tax credit;
• tax cuts for married couples designed to alleviate the “marriage tax penalty”; and
• repeal of the estate tax.
In addition, EGTRRA provided for a temporary reduction in the individual alternative minimum tax (AMT) by increasing the AMT’s exemption amount, but scheduled the AMT relief to expire at the end of 2004.
The Jobs and Growth Tax Relief and Reconciliation Act of 2003 (JGTRRA; P.L. 108-27) provided for the “acceleration” of most of EGTRRA’s scheduled tax cuts—that is, it moved up the effective dates of most of the tax cuts EGTRRA had scheduled to phase-in gradually, generally making them effective in 2003. (The phased-in repeal of the estate tax was not accelerated by JGTRRA.) Many of JGTRRA’s accelerations, however, were themselves temporary and were scheduled to expire at the end of 2004. Also, JGTRRA temporarily implemented a reduction in the maximum tax rate on dividends and capital gains, reducing the rates to 15% (5% for individuals in the 10% and 15% marginal income tax brackets). The reduction was initially scheduled to expire at the end of 2008.
In 2004, Congress thus faced two “expiration” issues related to EGTRRA and JGTRRA. One was a question for the longer term: the scheduled expiration of EGTRRA’s tax cuts at the end of 2010. The second was the expiration of JGTRRA’s accelerations at the end of 2004. In September, Congress addressed the second of these with enactment of the Working Families Tax Relief Act (WFTRA; P.L. 108-311). WFTRA generally extended JGTRRA’s accelerations of EGTRRA’s tax cuts through 2010—that is, up to the point at which EGTRRA’s cuts are scheduled to expire. WFTRA also extended EGTRRA’s increased AMT exemption for one year.
In 2005, TIPRA [Tax Increase Prevention and Reconciliation Act] extended JGTRRA’s dividend and capitals gains rate cuts along with its AMT reduction. The dividend and capital gains cuts were extended through 2010; the increased AMT exemption through 2006.
Notwithstanding the various extensions and accelerations, the issue of EGTRRA’s scheduled expiration at the end of 2010 remains and was debated in Congress throughout 2008. The debate over extension of the tax cuts has centered on three broad issues: its likely impact on the federal budget deficit, its possible effect on long-term economic growth, and its results for the fairness of the tax system.
Page 26:
Congress has enacted tax cuts in the recent past partly to provide a fiscal stimulus. The Economic Growth and Tax Reconciliation Act of 2001 (EGTRRA; P.L. 107-16) was enacted partly as a means of boosting an economy that entered recession in March 2001. EGTRRA contained a broad range of tax cuts, but was designed partly to deliver an immediate stimulus, and thus included a rate-reduction tax credit that was mailed to individuals in 2001 as checks from the U.S. Treasury.53
Following the September 11, 2001, attacks and in the midst of increased certainty that the economy was in recession, Congress considered additional fiscal stimulus proposals that initially included a tax rebate for individuals. The final stimulus package that was adopted (the Job Creation and Worker Assistance Act of 2002; P.L. 107-147), however, did not contain a rebate. The act did include temporary “bonus” accelerated depreciation that was aimed at boosting business investment as well as a temporary extension of net operating loss (NOL) carrybacks for businesses.
53 U.S. Congress, Joint Committee on Taxation, General Explanation of Tax Legislation Enacted in the 107th Congress, committee print, 107th Cong., 2nd sess. (Washington: GPO [Government Publishing Office], 2003), p. 8. For an explanation of the credit, see CRS [Congressional Research Service] Report RS21171, The Rate Reduction Tax Credit—“The Tax Rebate”—in the Economic Growth and Tax Relief Reconciliation Act of 2001: A Brief Explanation, by Steven Maguire.
[418] Transcript: “Inside the Dot.Com Crash.” CNN Moneyline, December 26, 2000. <www.cnn.com>
“One year ago at this time, Internet stocks were in the midst of an astonishing rally, and their future seemed limitless. But since then, investors have been facing a brutal reality check, watching their shares fall 70, 80, 90 percent from their highs and in some cases disappear completely.”
[419] Report: “Major Tax Issues in the 111th Congress.” By James M. Bickley and Andrew Hanna. Congressional Research Service, December 11, 2009. <www.everycrsreport.com>
Page 4:
In part, the fluctuations [in federal receipts] were a result of the business cycle; the long economic boom of the 1990s helped push receipts to their record level in FY2000, while the ensuing recession and sluggish recovery helped reduce the level of revenues in subsequent years. However, policy changes, too, were responsible: significant tax cuts in 2001, 2002, and 2003 each contributed to the decline in taxes.
[420] Webpage: “US Business Cycle Expansions and Contractions.” National Bureau of Economic Research. Last updated March 14, 2023. <www.nber.org>
“Contractions (recessions) start at the peak of a business cycle and end at the trough. … Peak Month (Peak Quarter) [=] December 2007 (2007Q4) … Trough Month (Trough Quarter) [=] June 2009 (2009Q2)”
[421] Report: “Major Tax Issues in the 111th Congress.” By James M. Bickley and Andrew Hanna. Congressional Research Service, May 6, 2009. <www.everycrsreport.com>
Page 2: “Prior to the recent downturns, the economy performed relatively strongly through the first half of 2007, yielding 22 consecutive quarters of real growth.”
NOTE: The federal government often revises its official figures for GDP [gross domestic product]. Per the next footnote, real GDP growth was positive for 25 consecutive quarters from 2001 Q4 through 2007 Q4. This however, may change with future revisions.
[422] Calculated with the dataset: “Table 1.1.1. Percent Change From Preceding Period in Real Gross Domestic Product, [Percent] Seasonally Adjusted at Annual Rates.” United States Department of Commerce, Bureau of Economic Analysis. Last revised March 30, 2023. <apps.bea.gov>
NOTE: An Excel file containing the data and calculations is available upon request.
[423] Report: “Major Tax Issues in the 111th Congress.” By James M. Bickley and Andrew Hanna. Congressional Research Service, December 11, 2009. <www.everycrsreport.com>
Page 2:
As 2007 progressed, however, signs of economic weakness surfaced in a number of areas. One prominent area was housing, where prices stopped rising after years of growth and drops occurred in house sales and residential investment. Second, financial markets came under strain as investor concerns about the credit quality of mortgages (especially “subprime mortgages”) had a damping effect on credit flows. Further, banks began reporting large losses resulting from declines in the market value of mortgages and other assets, leading them to become more restrictive in their lending to firms and households.3 The Federal Reserve Board responded by taking actions to ease monetary policy beginning in the second part of 2007. Additional interest rate cuts continued in March, April, and October 2008.
[424] Webpage: “US Business Cycle Expansions and Contractions.” National Bureau of Economic Research. Last updated March 14, 2023. <www.nber.org>
“Contractions (recessions) start at the peak of a business cycle and end at the trough. … Peak Month (Peak Quarter) [=] December 2007 (2007Q4) … Trough Month (Trough Quarter) [=] June 2009 (2009Q2)”
[425] Dataset: “Unemployment Rate, Civilian Labor Force, LNS14000000.” Bureau of Labor Statistics, U.S. Department of Labor. Accessed October 5, 2019 at <data.bls.gov>
“Labor Force Statistics From the Current Population Survey … Unemployment Rate … Year 2008 … Jan [=] 5.0 … Year 2009 … Dec [=] 9.9”
[426] Report: “Major Tax Issues in the 111th Congress.” By James M. Bickley and Andrew Hanna. Congressional Research Service, December 11, 2009. <www.everycrsreport.com>
Pages 23–24:
As noted above (see “The State of the Economy”), developments in late 2007 led prominent economic policymakers to call for legislation that would provide an economic stimulus. Support for a stimulus package came from both the Administration and Congress. In addition, in testimony before Congress, Federal Reserve Board chairman Ben Bernanke stated that legislation providing fiscal stimulus (i.e., tax cuts or spending increases) would be helpful if implemented quickly and did not compromise “fiscal discipline in the longer term.”48
On February 7, both the House and Senate approved a version of the stimulus plan that had been passed earlier in the House. The final bill’s main elements were a tax rebate in the form of a two-part credit, and an increased expensing tax benefit and enhanced depreciation for business investment in 2008. The bill is estimated to reduce tax revenue by $151.7 billion in FY2008 and by $134.0 billion over FY2008–FY2013. The smaller revenue loss over the five-year period compared to the first year is due to the shifting of tax deductions into the present from depreciation.
The tax rebates were equal to a “basic” tax credit plus a per-child tax credit. The credits were refundable. Under the basic credit, individuals received a tax credit equal to the greater of two amounts that depended, respectively, on their pre-credit tax liability and their earned income. First, a taxpayer could claim a credit equal to their income tax liability, but not to exceed $600 ($1,200 for a joint return). For the earned income amount, a taxpayer could claim a $300 tax credit ($600 for a joint return) if the individual has at least $3,000 in qualified income (generally, income from salaries and wages, plus Social Security and veterans’ disability payments) or an income tax liability of at least $1 and gross income exceeding the sum of the applicable standard deduction and one personal exemption (two, for joint returns). The child tax credit was $300 for each qualifying child.
The tax credit was ultimately based on individuals’ 2008 tax and income, and was issued from the U.S. Treasury during the 2008 calendar year, with the Treasury basing its distributions on individuals’ 2007 tax returns. When filing their 2008 tax returns (in 2009), individuals will recalculate the credit based on 2008 information, and can claim an additional credit if the 2008 information increases the amount of the credit. If the 2008 credit is less than that actually received, individuals will not be required to pay the difference. According to the Treasury Department, the checks began to be issued in May 2008.49
The plan phased out the combined child and basic credit for individuals earning a threshold amount of more than $75,000 ($150,000 for joint returns). It reduced the credit by 5% of the individual’s income in excess of the threshold phase-out threshold.
Business Tax Benefits
Under current law, businesses are allowed to “expense” (i.e., deduct immediately) the acquisition cost of a limited amount of new investment in machines and equipment rather than depreciating it over a period of years. Expensing thus provides a postponement (deferral) of taxes which constitutes a tax benefit because of the economic principle of discounting—the idea that a given amount of funds is worth more, the sooner it is received. Prior to the stimulus act, for 2008 firms were permitted to expense up to $128,000 of investment; the allowance was gradually reduced (“phased out”) for firms whose investment exceeds a $510,000 threshold. The $128,000 amount was a temporary increase over a permanent cap of $25,000 that is set to apply in 2011 and thereafter. (The permanent phase-out threshold is $200,000.) The stimulus bill provided a one-year (for 2008) additional increase in the expensing cap and threshold, to $250,000 and $800,000, respectively.
When not eligible for expensing, outlays for tangible business property—that is, machines and equipment and commercial structures—are required to be deducted gradually (i.e. depreciated) over a number of years. For 2008, the stimulus plan provided temporarily more generous depreciation rules for machines and equipment under which 50% of the asset’s cost could be deducted in its first year. Like expensing, this provision provided a tax benefit in the form of a deferral, although it was not as large.
[427] Calculated with data from:
a) Dataset: “Table 1.1.5. Gross Domestic Product.” United States Department of Commerce, Bureau of Economic Analysis. Last revised March 30, 2023. <apps.bea.gov>
b) Dataset: “Table 3.2. Federal Government Current Receipts and Expenditures [Billions of Dollars].” U.S. Bureau of Economic Analysis. Last revised March 30, 2023. <apps.bea.gov>
NOTE: An Excel file containing the data and calculations is available upon request.
[428] Constitution of the United States. Signed September 17, 1787. <www.justfacts.com>
Article I, Section 7:
[Clause 1] All Bills for raising Revenue shall originate in the House of Representatives; but the Senate may propose or concur with Amendments as on other Bills.
[Clause 2] Every Bill which shall have passed the House of Representatives and the Senate, shall, before it become a Law, be presented to the President of the United States; If he approve he shall sign it, but if not he shall return it, with his Objections to that House in which it shall have originated, who shall enter the Objections at large on their Journal, and proceed to reconsider it. If after such Reconsideration two thirds of that House shall agree to pass the Bill, it shall be sent, together with the Objections, to the other House, by which it shall likewise be reconsidered, and if approved by two thirds of that House, it shall become a Law. But in all such Cases the Votes of both Houses shall be determined by yeas and Nays, and the Names of the Persons voting for and against the Bill shall be entered on the Journal of each House respectively. If any Bill shall not be returned by the President within ten Days (Sundays excepted) after it shall have been presented to him, the Same shall be a Law, in like Manner as if he had signed it, unless the Congress by their Adjournment prevent its Return, in which Case it shall not be a Law.
Article I, Section 8, Clause 1: “The Congress shall have Power To lay and collect Taxes, Duties, Imposts and Excises, to pay the Debts and provide for the common Defence and general Welfare of the United States….”
[429] Report: “The Debt Limit: History and Recent Increases.” By D. Andrew Austin. Congressional Research Service, November 2, 2015. <fas.org>
Page 4:
The debt limit also provides Congress with the strings to control the federal purse, allowing Congress to assert its constitutional prerogatives to control spending.21 The debt limit also imposes a form of fiscal accountability that compels Congress and the President to take visible action to allow further federal borrowing when the federal government spends more than it collects in revenues.
[430] Article: “$5 Trillion Added to National Debt Under Bush.” By Angie Drobnic Holan. PolitiFact, January 22, 2009. <www.politifact.com>
At the end of the Clinton administration, there were several years of budget surpluses. …
When Bush took office, the national debt was $5.73 trillion. When he left, it was $10.7 trillion. …
So even though he [Rahm Emanuel] is off by about 20 percent, the fact that the number has been surging lately supports his point that the debt increased greatly under Bush. So we rate his statement Mostly True.
[431] Calculated with data from:
a) Dataset: “Table 1.1.5. Gross Domestic Product.” U.S. Department of Commerce, Bureau of Economic Analysis. Last revised March 30, 2023. <apps.bea.gov>
b) Webpage: “Dates of Sessions of the Congress.” Accessed April 7, 2022 at <www.senate.gov>
c) Webpage: “Past Inauguration Ceremonies.” Joint Congressional Committee on Inaugural Ceremonies. Accessed April 7, 2022 at <www.inaugural.senate.gov>
d) Webpage: “Party Divisions of the House of Representatives (1789–Present).” U.S. House of Representatives, Office of the Clerk. Accessed April 7, 2022 at
e) Webpage: “Party Division in the Senate, 1789–Present.” U.S. Senate Historical Office. Accessed April 7, 2022 at
f) Webpage: “Debt to the Penny.” U.S. Department of the Treasury, Bureau of the Fiscal Service. Accessed April 15, 2022 and April 7, 2022 at <fiscaldata.treasury.gov>
NOTES:
[432] Book: This Time is Different: Eight Centuries of Financial Folly. By Carmen M. Reinhart (University of Maryland) and Kenneth S. Rogoff (Harvard University). Princeton University Press, 2009.
Page 65: “Governments can also default on domestic public debt through high and unanticipated inflation, as the United States and many European countries famously did in the 1970s.”
Page 175:
[I]nflation has long been the weapon of choice in sovereign defaults on domestic debt and, where possible, on international debt. … [G]overnments engage in massive monetary expansion, in part because they can thereby gain a seigniorage tax on real money balances (by inflating down the value of citizens’ currency and issuing more to meet demand). But they also want to reduce, or even wipe out, the real value of public debts outstanding.
Page 400: “Seigniorage is simply the real income a government can realize by exercising its monopoly on printing currency. The revenue can be broken down into the quantity of currency needed to meet the growing transactions demand at constant prices and the remaining growth, which causes inflation, thereby lowering the purchasing power of existing currency.”
[433] Article: “Inflation and the Real Value of Debt: A Double-Edged Sword.” By Christopher J. Neely. Federal Reserve Bank of St. Louis, On the Economy, August 1, 2022. <www.stlouisfed.org>
An increase in the price level directly reduces the real value of government debt, as well as the ratio of debt to GDP [gross domestic product], because—holding other things constant—higher prices increase nominal GDP. Thus, surprise inflation transfers wealth from holders of U.S. government debt—who include both Americans and non-Americans—to U.S. taxpayers.3
This transfer is not an unalloyed good even for U.S. taxpayers, however, because unexpected inflation will tend to raise the cost of servicing future U.S. debt—i.e., nominal yields—by increasing the expected rate of inflation and the risk premium associated with inflation.
[434] Report: “A Citizen’s Guide to the Federal Budget: Fiscal Year 2000.” White House Office of Management and Budget, January 1999. <www.gpo.gov>
Pages 18–19:
• Discretionary spending, which accounts for one-third of all Federal spending, is what the President and Congress must decide to spend for the next year through the 13 annual appropriations bills. It includes money for such activities as the FBI and the Coast Guard, for housing and education, for space exploration and highway construction, and for defense and foreign aid.
• Mandatory spending, which accounts for two-thirds of all spending, is authorized by permanent laws, not by the 13 annual appropriations bills. It includes entitlements—such as Social Security, Medicare, veterans’ benefits, and Food Stamps—through which individuals receive benefits because they are eligible based on their age, income, or other criteria. It also includes interest on the national debt, which the Government pays to individuals and institutions that hold Treasury bonds and other Government securities. The President and Congress can change the law in order to change the spending on entitlements and other mandatory programs—but they don’t have to.
[435] Report: “GAO Strategic Plan [Government Accountability Office], 2007–2012.” U.S. Government Accountability Office, March 2007. <www.gao.gov>
Page 15:
Table 2: Forces Shaping the United States and Its Place in the World
Changing security threats: The world has changed dramatically in overall security, from the conventional threats posed during the Cold War era to more unconventional and asymmetric threats. Providing for people’s safety and security requires attention to threats as diverse as terrorism, violent crime, natural disasters, and infectious diseases. The response to many of these threats depends not only on the action of the U.S. government but also on the cooperation of other nations and multilateral organizations, as well as on state and local governments and the private and independent sectors. Complicating such efforts are a number of failed states allowing the trade of arms, drugs, or other illegal goods; the spread of infectious diseases; and the accommodation of terrorist groups. …
Economic growth and competitiveness: Economic growth and competition are also affected by the skills and behavior of U.S. citizens, the policies of the U.S. government, and the ability of the private and public sectors to innovate and manage change. … Importantly, the saving and investment behavior of U.S. citizens affects the capital available to invest in research, development, and productivity enhancement. …
Global interdependency: Economies as well as governments and societies are becoming increasingly interdependent as more people, information, goods, and capital flow across increasingly porous borders. …
Societal change: The U.S. population is aging and becoming more diverse. As U.S. society ages and the ratio of elderly persons and children to persons of working age increases, the sustainability of social insurance systems will be further threatened. Specifically, according to the 2000 census, the median age of the U.S. population is now the highest it has ever been, and the baby boomer age group—people born from 1946 to 1964, inclusive—was a significant part of the population.
[436] Report: “The Effects of Pandemic-Related Legislation on Output.” Congressional Budget Office, September 2020. <www.cbo.gov>
Page 2 (of PDF):
In March and April of 2020, four major federal laws were enacted to address the public health emergency and the economic distress created by the 2020 coronavirus pandemic. … By increasing debt as a percentage of GDP [gross domestic product], the legislation is expected to raise borrowing costs, lower economic output, and reduce national income in the longer term.
Pages 3–4:
In the longer term, the legislation is projected to increase the ratio of federal debt to GDP. High and rising federal debt makes the economy more vulnerable to rising interest rates and also to rising inflation, depending on how that debt is financed. The growing debt burden also raises borrowing costs, slowing the growth of the economy and national income, and it could increase the risk of a fiscal crisis or a gradual decline in the value of Treasury securities.
[437] Blog post: “State Economies Hit Hardest by the Pandemic Are Still Playing Catch-Up.” By Levi Bognar and Thomas Walstrum. Federal Reserve Bank of Chicago, May 12, 2022. <www.chicagofed.org>
The Covid-19 pandemic caused a massive worldwide economic shock. Within the United States, no region was spared. The state with the smallest employment decline at the beginning of the pandemic—Wyoming—still lost 9% of its workers from January through April of 2020. Moreover, there were six states—Hawaii, Michigan, Nevada, New York, Rhode Island, and Vermont—that saw employment drop by over 20% during the same span. While the economic rebound commenced quickly across the U.S., two years later the pandemic’s impact on states’ employment numbers endures. And just as the pandemic-induced declines in employment varied in size across states, so have their jobs recoveries. About a quarter of states had higher employment in March 2022 than they did in January 2020, but others still have sizable holes to refill. …
Because of the continuing significance of the pandemic employment shock for current employment levels, it is natural to ask, what can account for the differences in the sizes of the initial declines? There are a couple of clear predictors of initial decline size, but we must emphasize that they are merely predictors (or correlates) and not necessarily causal channels. The first clear predictor is the relative size of the first national wave of Covid deaths in the state: By July 1, 2020, the states with the highest number of Covid deaths per capita were Connecticut, Massachusetts, New Jersey, New York, and Rhode Island—all states that experienced large initial declines. A second clear predictor is industry mix. Leisure and hospitality experienced the largest employment loss of any industry, and the two states with the highest concentrations of leisure and hospitality employment,3 Hawaii and Nevada, saw some of the largest initial employment declines (although in Florida, another state with a lot of tourism, the decline was relatively small). A third factor that may also have played a role was lockdown stringency during the first Covid wave, which varied by state (see this Philadelphia Fed study for details). Determining the relative importance of these three explanations (and potentially others) remains an active area of research. The task is not simple because the explanations are not independent of each other. For example, states with industry mixes (second factor) that include a large share of essential workers may have had larger outbreaks and more Covid deaths per capita (first factor) because a greater share of the population remained at work in person. Another potential complication in determining the relative importance of the first and third factors is that greater lockdown stringency may have limited outbreak size, while at the same time bigger outbreaks may also have led to stricter lockdowns.