Please wait as we load hundreds of rigorously documented facts for you.
Please wait as we load hundreds of rigorously documented facts for you.

For example:

A major source of information for this research is the 2023 Social Security Trustees Report.[1] This report was published in March 2023 and uses data from 2022 as a baseline. Unless otherwise stated, all dollar figures in this research are indexed for inflation to keep the data consistent with 2022/2023 dollars.[2] [3]
Whenever the word “projections” is used, this refers to projections made by the United States Social Security Administration. The process of making projections is not an exact science, and actual outcomes often differ from those predicted (see Accuracy of Projections). The Social Security Trustees Report contains high, low, and intermediate projections. Unless otherwise stated, this research cites the intermediate figures, because these “reflect the Trustees’ best estimates of future experience.”[4]
* In 1935, Congress passed and Democratic President Franklin D. Roosevelt signed into law the “Social Security Act.” This law created “a system of Federal old-age benefits” for workers and their families. In 1956, the law was amended to also provide disability benefits.[5] [6]
* Social Security is composed of two separate entities: the “Old-Age and Survivors Insurance” program and the “Disability Insurance” program. Each program has separate finances handled through two separate trust funds. For the purpose of simplicity, the figures shown below reflect the combination of both programs unless otherwise stated.[7] [8]
* The Supplemental Security Income (SSI) program provides benefits for aged, blind, and disabled people without regard to prior workforce participation. It is administered by the Social Security Administration, but it is not funded by Social Security taxes. Unless otherwise stated, this program is not covered in this research.[9]
* As of June 30, 2022, 65.6 million people or 20% of the U.S. population were receiving monthly Social Security benefits.[10]
* Certain groups of workers were originally exempt from Social Security, including government employees, railroad workers, the self-employed, farm workers, domestic help, and employees of nonprofit organizations. In 1950 and 1983, the law was changed to require most of these individuals to participate in the program, although about 25% of state and local government workers are still exempted.[11] [12] [13] [14] [15]
* Under certain conditions, some members of the clergy and religious groups are not required to participate in Social Security.[16]
* Social Security is the largest government program in the world.[17] Relative to other U.S. federal programs, Social Security outlays in 2022 were:
* Payroll taxes are taxes that are levied on the wages of workers.[19] [20]
* From the inception of the Social Security program through 2022, payroll taxes have supplied 97% of the program’s direct tax revenues.[21]
* Social Security and Medicare payroll taxes are sometimes called FICA taxes or SECA taxes. The acronym FICA stands for the “Federal Insurance Contributions Act,” and SECA stands for the “Self-Employment Contributions Act.”[22]
* The typical SECA tax rates for people who are self-employed are as follows:
|
Social Security Tax |
12.4% |
|
Medicare Tax |
2.9% |
|
Total |
15.3% |
* The typical FICA tax rates for people who are employees are as follows:
|
Social Security Tax |
Medicare Tax |
FICA Tax (Total) |
|
|
Employee tax |
6.2% |
1.45% |
7.65% |
|
Employer tax |
6.2% |
1.45% |
7.65% |
|
Totals |
12.4% |
2.9% |
15.3% |
* For both employees and the self-employed, the Affordable Care Act (a.k.a. Obamacare) levies an additional 0.9% Medicare payroll tax on earnings above $200,000 for singles and $250,000 for couples.[25] [26]
* The payroll tax amounts shown on paychecks generally do not account for the taxes that employers pay.[27] Payroll taxes levied on employers are mainly borne by employees in the form of reduced wages (for more detail, see Just Facts’ research on the Distribution of Tax Burdens).[28] [29] [30] [31] [32] [33]
* Social Security payroll taxes are restricted to a “taxable maximum.” Annual earnings above the maximum are not subject to these taxes. For 2023, the taxable maximum is $160,200.[34]
* Previously, Medicare payroll taxes were restricted to the same taxable maximum as Social Security. In 1993, the 103rd Congress and Democratic President Bill Clinton passed a law removing the taxable maximum for Medicare, thus making all earnings subject to these Medicare taxes.[35] [36] [37]
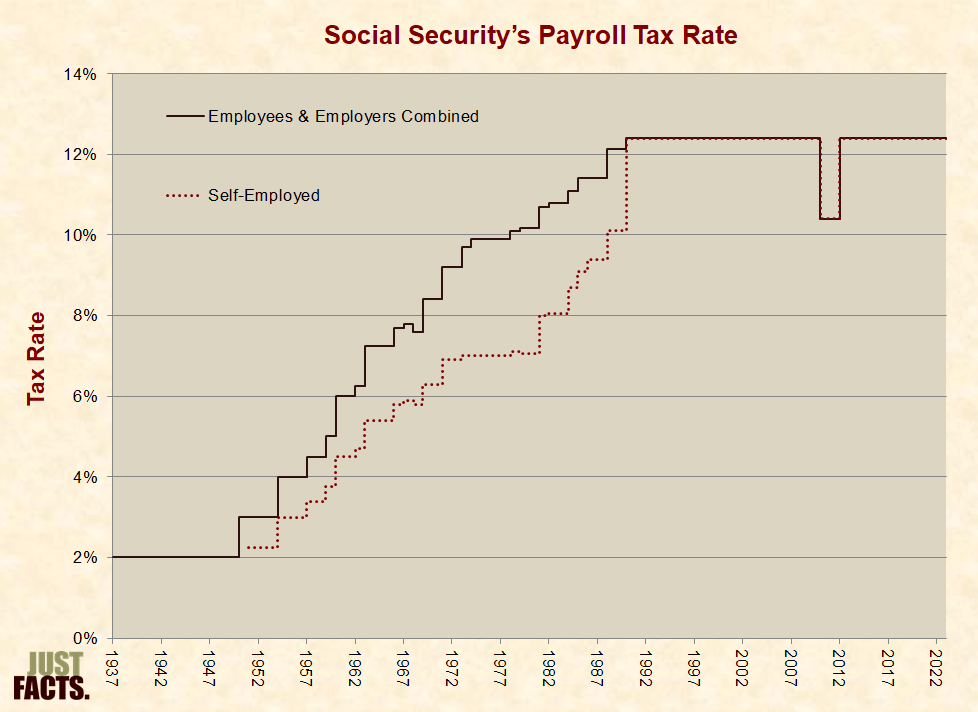
* The Social Security Act of 1935 set the initial payroll tax rate at 2% (employee and employer combined) and specified increases that would bring this rate to 6% by 1949.[38]
* Various Congresses and presidents postponed the tax rate increases scheduled in the original Social Security Act so that the 6% rate planned for 1949 did not take effect until 1960.[39] [40]
* Between 1950 and 1977, various Congresses and presidents passed ten laws increasing the Social Security payroll tax rate above the 6% level specified in the original Social Security Act.[41]
* In 1983, the 98th Congress and Republican President Ronald Reagan accelerated the timeframe for previously enacted payroll tax rate hikes and increased the rate for “the self-employed to equal the combined employee/employer rate but with partially offsetting credits and deductions.”[42]
* In 2010 and 2011, the 111th and 112th Congresses and Democratic President Barack Obama passed three laws that temporarily decreased the Social Security payroll tax during 2011 and 2012 by two percentage points (from 12.4% to 10.4%). These laws also required that monies equivalent to the decreased payroll taxes be transferred to the Social Security program from the general fund of the U.S. Treasury—which is funded by personal income taxes, corporate income taxes, excise taxes, estate and gift taxes, and other miscellaneous receipts.[43] [44] [45] [46] [47] [48]
* Social Security’s payroll tax rate has risen by 6.2 times since the outset of the program:
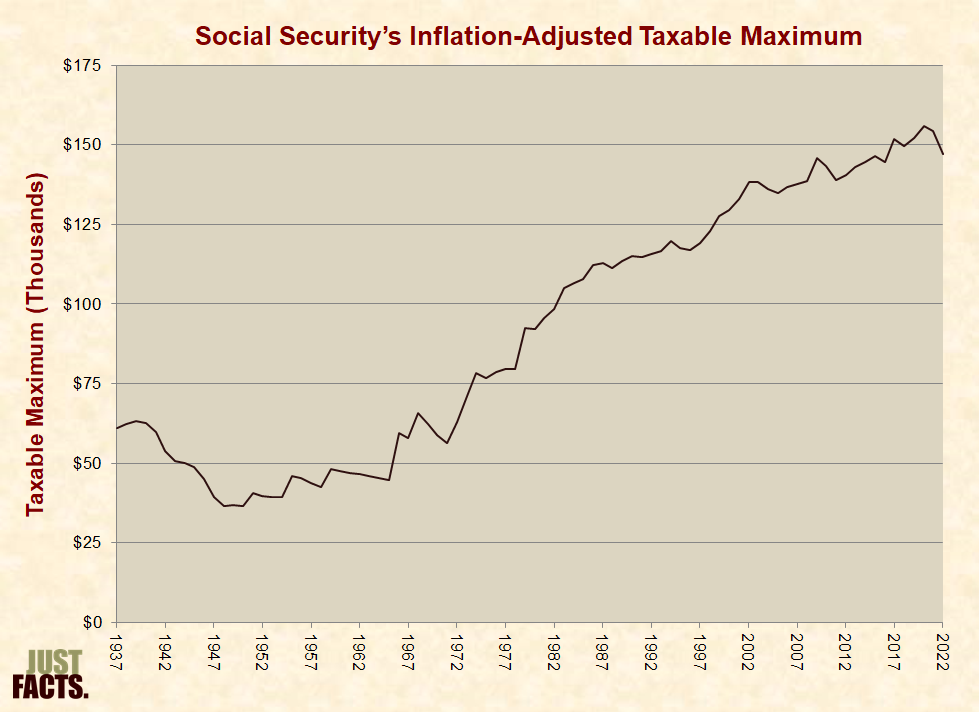
* The Social Security Act of 1935 initially set the annual taxable maximum at $3,000. Income earned above this amount was not subject to Social Security taxes. This threshold was a fixed amount that was not indexed for inflation or wage levels.[50] [51]
* From 1950 to 1971, various Congresses and presidents passed six laws increasing the taxable maximum by a total of 200%—or by 77% above the rate of inflation during this period.[52]
* In 1972 and 1973, the 92nd and 93rd Congresses and Republican President Richard Nixon passed laws:
* In 1977, the 95th Congress and Democratic President Jimmy Carter passed a law increasing the taxable maximum faster than average wage levels in 1979, 1980, and 1981 by a total of 68%.[54] [55]
* Since 1982, the taxable maximum has been annually indexed based roughly upon average worker compensation levels.[56] [57]
* From 1990 to 2021, the inflation-adjusted:
* Adjusted for inflation, Social Security’s taxable maximum has increased by 2.6 times since the outset of the program:
* Since the start of Social Security in 1937, the portion of all covered earnings subject to Social Security payroll taxes has ranged from 71% to 92%, with an average of 84% and a median of 84%. In 2021, this figure was 81%:

* At the outset of the Social Security program, the federal government published an informational pamphlet that stated the following about Social Security taxes:
* Accounting for inflation, the figures above equate to a maximum tax collection of $2,244 per person in 2023 dollars.[64]
* In 2023, the maximum payroll tax collection per person is $19,865 or 8.6 times the promised maximum.[65]
* Some politicians have called for raising the maximum payroll tax to infinity. This includes but is not limited to:
* The taxes above don’t include other taxes that politicians have used to fund Social Security. This includes but is not limited to:
* At the outset of the Social Security program, the federal government published an informational pamphlet that stated the following with regard to old-age benefits:
* Recipients of old-age benefits with incomes of more than $25,000/year and couples with incomes of more than $32,000/year must now pay income taxes on up to 50% of their old-age benefits. Half of an individual’s or couple’s old-age benefits are counted as income when determining if they meet these $25,000 and $32,000 thresholds.[69] [70] These income taxes on Social Security benefits are used to fund Social Security.[71]
* Recipients of old-age benefits with incomes of more than $34,000/year and couples with incomes of more than $44,000/year must also pay income taxes on up to 85% of their old-age benefits. Half of an individual’s or couple’s old-age benefits are counted as income when determining if they meet these $34,000 and $44,000 thresholds.[72]
* The thresholds at which people are required to pay income taxes on their old-age benefits are not automatically indexed to account for inflation or wage growth.[73]
The following projections are based upon what the current law specifies. This does not imply that the Social Security program will have enough money to pay for these benefits. Information concerning the financial stability of the Social Security program is contained in the section below on Financial Status.
* In general, to qualify for old-age benefits, a person must work for ten years while earning at least $6,560 per year.[74]
* Old-age benefit amounts are generally related to the amount of Social Security payroll taxes paid by workers over the course their lifetimes.[75] The Social Security Administration has an Online Calculator that provides an estimate of monthly old-age benefits based upon your earnings, birth date, and expected retirement age. The results can be delivered in either today’s dollars or in future (inflated) dollars.[76]
* People with lower incomes receive higher ratios of annual benefits to taxes.[77] The graph below compares annual old-age benefits to lifetime payroll taxes for 23-year-olds who will work until the age of 67 while earning constant incomes:

* Examples from the graph above:
* Low-income workers receive an effective refund of most of their Social Security taxes through the “earned income tax credit.” This program was established in 1975 to “offset the Social Security taxes of low-income workers with children and to provide those taxpayers with an increased incentive to work.”[80] [81] [82] In 2022, this program spent $64 billion.[83]
* Accounting for interest, people born in 1900 received about seven times more in Social Security benefits than they paid in payroll taxes.[84]
* For workers who earned average wages and retired at the age of 65 in 1980, it took 2.8 years of receiving old-age benefits to recover the value of their payroll taxes (including interest). For workers who retired in 2003, it took 17.4 years. For workers who retired in 2020, it will take 21.6 years.[85] This assumes Social Security will have enough money to pay scheduled benefits for this entire period, which it is not projected to have.[86]
* The federal government adjusts old-age benefits each December based upon the rate of inflation in the previous year. This is called a “cost-of-living adjustment” or “COLA.” The COLAs for recent years were as follows:
|
Year |
COLA |
Year |
COLA |
|
|
2005 |
4.1% |
2014 |
1.7% |
|
|
2006 |
3.3% |
2015 |
0.0% |
|
|
2007 |
2.3% |
2016 |
0.3% |
|
|
2008 |
5.8% |
2017 |
2.0% |
|
|
2009 |
0.0% |
2018 |
2.8% |
|
|
2010 |
0.0% |
2019 |
1.6% |
|
|
2011 |
3.6% |
2020 |
1.3% |
|
|
2012 |
1.7% |
2021 |
5.9% |
|
|
2013 |
1.5% |
2022 |
8.7% |
* The age at which a worker receives full Social Security old-age benefits is referred to as the “full retirement age.” A person’s full retirement age can range from 65 to 67 years old, depending upon his or her year of birth. For those born after 1959, the full retirement age is 67 (more details in footnote).[88]
* Workers have the option to start receiving Social Security benefits at the age of 62, but the benefits are reduced (more details in footnote).[89] Workers also have the option to start receiving benefits later than their full retirement age, and the benefits are increased (more details in footnote).[90]
* Family members of workers who are receiving old-age benefits may also be eligible for benefits, even if they have not worked (more details in footnote).[91]
* When Social Security first began, beneficiaries could take their benefits as a lump sum.[92] The earliest reported applicant for a lump sum Social Security benefit was Ernest Ackerman of Cleveland, OH. Mr. Ackerman retired one day after the program began and paid $0.05 in Social Security taxes. He received a lump sum payment of $0.17, a 240% return.[93]
* Per the Social Security Administration:
* According to the Social Security Administration:
* As of 2023, Social Security pays an average of $21,924/year to retired individuals.[96] In 2022, the U.S. Census Bureau’s poverty threshold for individuals over 65 years of age was $14,036.[97]
* As of 2023, Social Security pays an average of $35,664/year to retired couples.[98] In 2022, the U.S. Census Bureau’s poverty threshold for couples over 65 years of age was $17,689.[99]
* In 2019, the Congressional Budget Office analyzed “whether Social Security benefits enable retired workers to meet their basic needs and the extent to which benefits replace preretirement earnings.” The study focused on “workers with long careers, who generally have higher average earnings than all workers….” Among these people:[100]
* Among elderly Social Security beneficiaries:
* Family members of workers who are receiving old-age benefits may also be eligible for benefits, even if they have not worked (more details in footnote).[108]
* Social Security pays benefits to the families of workers who die and leave behind spouses, children under the age of 20, and sometimes other relations such as parents and ex-spouses (more details in footnote).[109]
* Each dependent receives about 75% to 100% of the deceased worker’s basic Social Security benefit. However, per the Social Security Administration, “there is a limit to the amount of money that can be paid each month to a family. The limit varies, but is generally equal to about 150 to 180 percent of your benefit rate.”[110]
* To qualify for disability benefits, workers generally must first meet two basic tests:
* The federal law that governs Social Security defines “disability” as:
* In general, recipients begin to receive disability benefits after they have been disabled for five full months.[113]
* Disability benefits are calculated based upon a formula that takes into account the Social Security payroll taxes paid over the course of workers’ lifetimes.[114]
* Disability benefits are generally increased once per year based upon the rate of inflation.[115]
* Family members of workers who are receiving disability benefits may also be eligible for benefits, even if they have not worked.[116]
* In December 2021:
* People who received disability payments in December 2021 were awarded benefits for the following primary reasons:
* Distribution of benefits in 2022 were as follows:
|
Category |
Amount (billions) |
Portion of Total Social Security Benefits |
|
Retired workers and their families |
$947 |
77% |
|
Disabled workers and their families |
$143 |
12% |
|
Survivors of deceased workers |
$141 |
11% |
* The Social Security Administration’s website enables individuals to set up an account that provides them with estimates of their benefits and a list of their lifetime earnings according to Social Security’s records. This web-based utility replaces the paper statements that Social Security used to send to individuals each year.
* The Social Security Administration still sends paper statements only to people age 60 and over who are not receiving benefits and don’t have an online Social Security account.[124]
* All financial operations of the Social Security program are legally separated from other operations of the U.S. Treasury.[125] [126]
* Social Security’s expenses include its benefit payments and administrative overhead.[127] [128]
* Social Security’s sources of income include:
* In 2022, Social Security had $1,222 billion in income and $1,244 billion in expenses.[133]
* When Social Security’s sources of income exceed its expenses, federal law requires that the resultant surpluses be loaned to the general fund of the U.S. Treasury. Federal law also requires that the Treasury pay this money back to the Social Security program with interest.[134] [135] [136] [137]
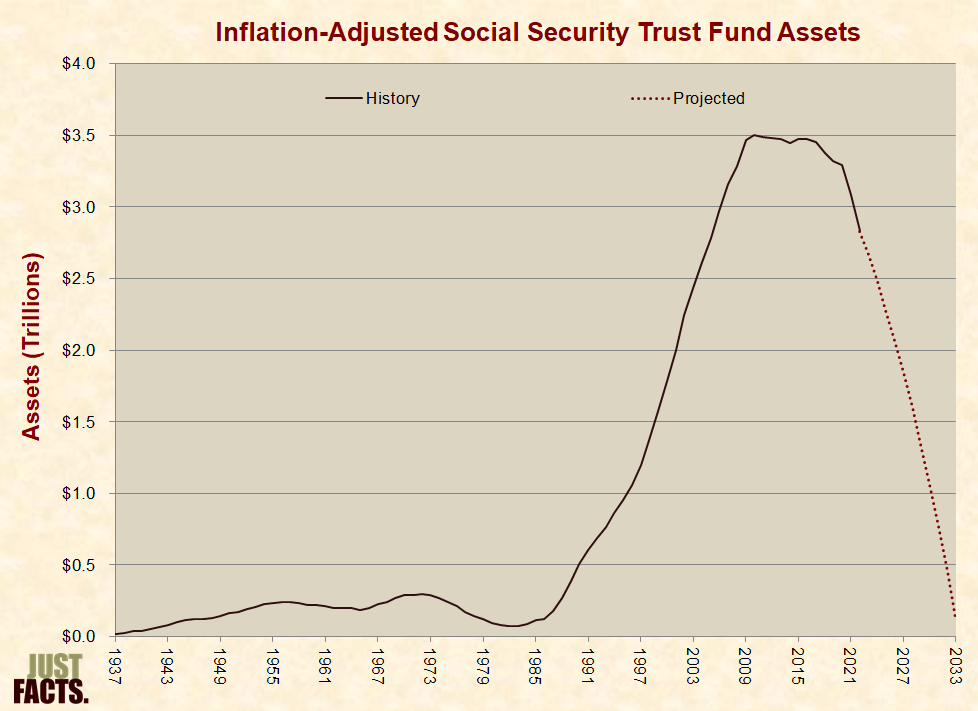
* The money owed by the Treasury to the Social Security program is called the “Social Security Trust Fund,” and at the close of 2022, it had a balance of $2.8 trillion.[138]
* The $2.8 trillion debt that the Treasury owes to Social Security amounts to $8,470 for every person living in the U.S. or $21,569 for every household in the U.S.[139] (Facts about the ability of the Treasury to pay this debt are detailed below in the section below entitled Impact on National Debt.)
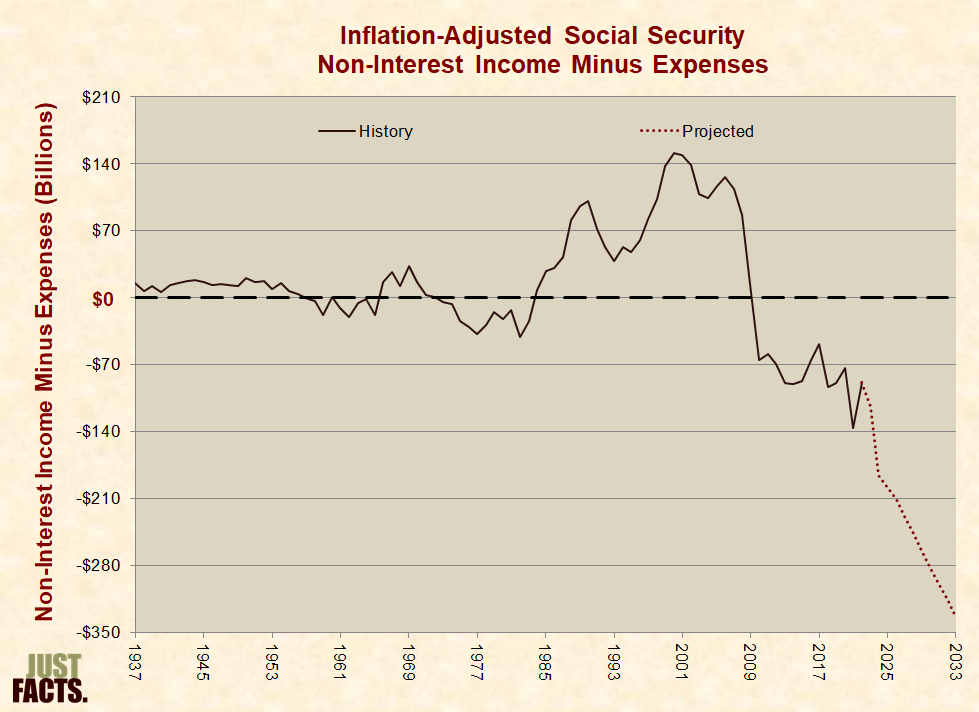
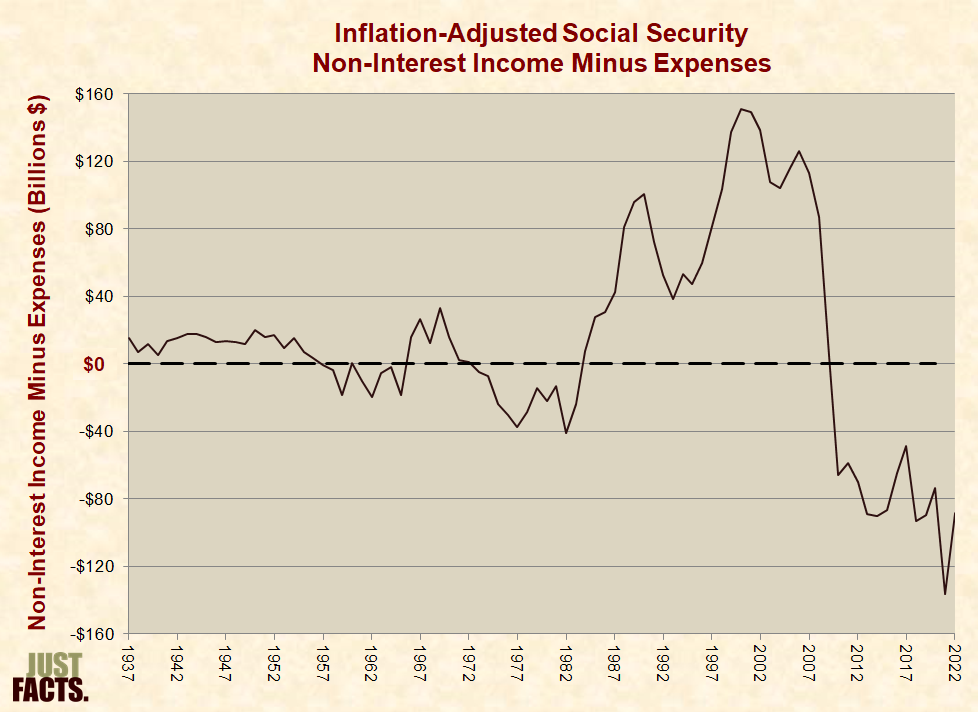
* From 1984 through 2009, Social Security’s non-interest income exceeded its expenses. In 2010, this situation reversed, and the program’s expenses began exceeding its non-interest income. This state of affairs continued through 2022 and is projected to continue every year into the foreseeable future:[140] [141]
* Despite the interest payments that Social Security receives on the Trust Fund, the Trust Fund began declining in inflation-adjusted value in 2011.[143] [144] [145] [146] This decline began 10 years earlier than the Social Security Administration projected in 2010.[147]
* The Social Security Trust Fund continued to decline in 2012–2014, rose in 2015, and resumed declining in 2016.[148] This state of affairs is projected to continue until the Trust Fund is exhausted in 2034:[149]
* After 2033, Social Security is projected to run deficits every year into the foreseeable future.[151] To cover these deficits, payroll taxes would need to be increased by 25% starting in 2034, rising to a 35% increase by 2097.[152] These shortfalls could also be covered by reducing benefits by 19% starting in 2034, rising to a 25% reduction by 2097.[153]
* There are several other ways to quantify Social Security’s projected deficits. The measure commonly cited by the Social Security Administration and the press involves calculating how much money must be immediately added to the Trust Fund so that the principle and interest would cover projected shortfalls for the next 75 years.[154] [155] This is referred to as the “75-year open group unfunded obligation.” As of January 1, 2023, this amounts to:
* The U.S. Treasury’s “Financial Report of the United States Government” explains that Social Security’s 75-year open group unfunded obligation “understates the total financial needs by capturing relatively more of the revenues from current and future workers and not capturing all the benefits that are scheduled to be paid to them.”[160] A measure that accounts for these financial needs is called the “closed group unfunded obligation.” This measure:
* As of January 1, 2023, Social Security’s closed group unfunded obligation amounts to:
* Another way to quantify Social Security’s projected deficits is to calculate the total debt the program will accumulate if corrective action is not taken and money is borrowed to cover the shortfalls of the next 75 years. This debt (including interest) would amount to $103.6 trillion or an additional $434,842 (in 2023 dollars) for every person expected to be paying Social Security taxes in 2097.[173] [174]
* According to the Social Security Trustees report, relying too heavily on a 75-year projection “can lead to incorrect perceptions and to policy prescriptions that do not achieve sustainable solvency.” To address this shortcoming, the Trustees Report calculates how much money must be placed in the Social Security Trust Fund right now in order to finance projected deficits for the infinite horizon. This amounts to $65.9 trillion, which is comprised of $22.4 trillion to cover the shortfalls during 2022–2097 and another $43.4 trillion to cover the shortfalls for 2097 and beyond.[175]
* The Social Security Administration’s intermediate projections yield the following results:
|
Time Period |
Financial Status |
|
2023–2033 |
The Trust Fund declines in value every year. The federal government pays back the money that the Social Security program has loaned to it with interest, and the Trust Fund is depleted. |
|
2034–2097 |
The Social Security program runs deficits that accumulate to $103.6 trillion, which could be covered by (a) adding $22.4 trillion to the Trust Fund today, or (b) increasing payroll taxes by 25% starting in 2034, rising to a 35% increase by 2097, or (c) reducing benefits by 19% starting in 2034, rising to a 25% reduction by 2097. |
|
2098 and beyond |
The Social Security Program runs deficits that could be covered by adding $43.4 trillion to the Trust Fund today. |
* The primary cause of Social Security’s financial problems is a falling ratio of taxpayers to benefit recipients:[176]

* Three major factors contributing to the falling ratio of taxpayers to benefit recipients are:
1) increases in life expectancy without comparable increases in the retirement age:
2) the higher birth rate of the baby boom generation compared to other generations:
3) the increasing number of people receiving disability benefits:
|
Year |
Population in U.S. |
Number of People Receiving Disability Benefits |
|
1965 |
204,018,000 |
1,739,000 |
|
2023 |
335,997,000 |
8,842,000 |
* The Social Security Trustees Report states that the finances of the program depend upon:
* The report also states that “significant uncertainty” surrounds the “best estimates” of future circumstances.[194]
* The chart below compares Social Security’s yearly incomes to costs. The starting point of each curve is an actual outcome. The rest of each curve shows projections using data from various Trustees Reports.

* Examples from the chart above:
* The chart below shows how much Social Security payroll taxes would need to be decreased or increased to make total taxes plus transfers from the Treasury equal to the costs of the program. The starting point of each curve is an actual outcome, and the rest are based on projections. Note that the values on the vertical axis are inverted so that upward signifies improving finances, and downward signifies declining finances.
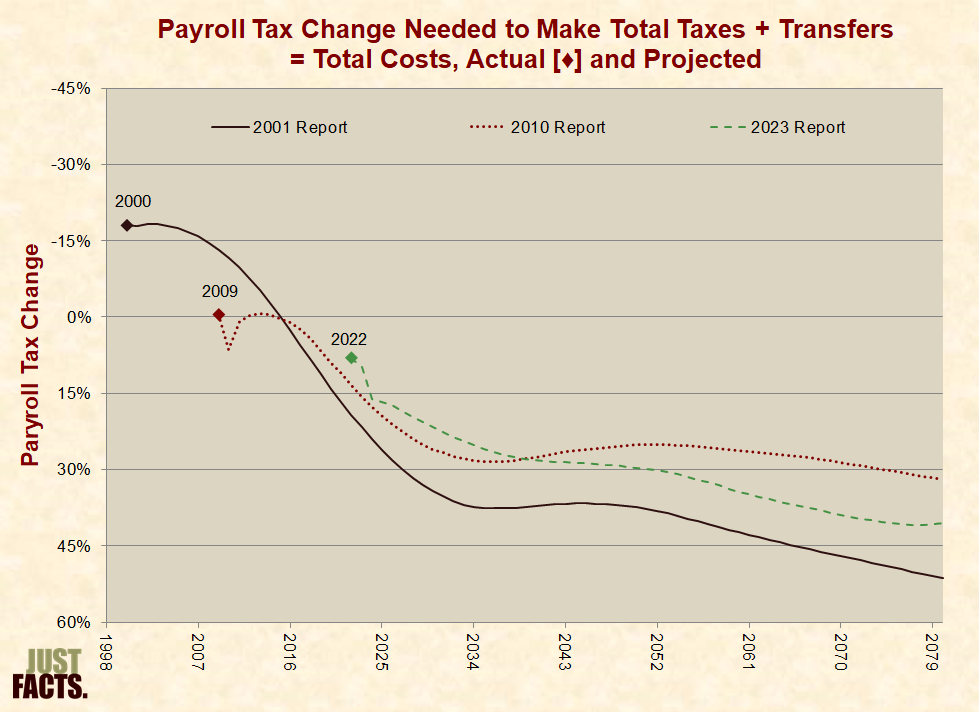
* Examples from the chart above:
* In 2012, the journal Demography published research that found the Social Security Administration is using an antiquated method to project life expectancies, and as a result, the program “may be in a considerably more precarious position than officially thought.”[197]
* From 1972 to 1976, the Social Security Trust Fund declined in value every year.[198] In 1977, the 95th U.S. Congress and Democratic President Jimmy Carter passed a bill that increased Social Security taxes and changed the formula governing benefit increases.[199] At the signing ceremony, Carter stated that this law was “the most important Social Security legislation since the program was established” and:
* The bill became law on December 20, 1977,[201] and the Trust Fund continued to decline every year for the next six years.[202] In 1983, the 98th U.S. Congress and Republican President Ronald Reagan increased Social Security taxes, raised the retirement age, and made other changes to help keep the program solvent.[203]
* Six days after the 2010 Social Security Trustees Report was published,[204] Nobel Prize-winning economist Paul Krugman wrote in his New York Times column that Social Security:
* In addition to “intermediate” projections predicting that the Trust Fund will be depleted in 2037, the 2010 Trustees Report included “high-cost” projections predicting that the Trust Fund will be depleted in 2029 and “low-cost” projections predicting that the program will “be able to cover cost for the foreseeable future.”[206]
* Regarding these projections, the report states:
* The report also states that:
* In an appendix to this report, there is an analysis that “estimates a probability distribution of future outcomes” that “should be interpreted with caution and with an understanding of the inherent limitations.” According to this analysis, there is a 97.5% chance that the Trust Fund will be depleted no later than 2055 and the same chance that the Trust Fund won’t be depleted any earlier than 2030.[209]
* In 2022, the administrative costs of the Social Security program were $6.7 billion. This was equal to 0.54% of all Social Security outlays for the year, or enough to pay 307,699 retired workers the average annual old-age benefit of $21,924 for 2023.[210] [211]
* The figures above do not include the administrative costs borne by employers, which, according to Congressional Budget Office, are “probably substantial” but “difficult to assess.” The same report states that employers “bear the burden of the collection costs” of Social Security taxes and “are also responsible for transmitting substantial amounts of information to the SSA [Social Security Administration] and the IRS.”[212]
* From January 2004 to April 2007, the Social Security Administration made 44,000 corrections for instances in which it had falsely listed individuals as deceased. This required face-to-face interviews with each person and the processing of “resurrection transactions” to remove individuals from the “death master file.”[213]
* Under the 2009 American Recovery and Reinvestment Act (a.k.a., Obama “stimulus”), the Social Security Administration was required to administer the payment of $250 checks to Social Security and Supplemental Security Income beneficiaries. The Administration identified and certified about 52 million people as eligible for the checks, to whom the U.S. Treasury sent a total of $13 billion.[214]
* A 2010 report by the Inspector General of the Social Security Administration found that 71,688 of these checks (totaling $18 million) were sent to people who were deceased and thus ineligible to receive the payments. This included:
* A random audit of 50 such cases found that 26 of the payments had been returned. The stimulus act did not provide authority to reclaim payments issued to the deceased, and thus, the Social Security Administration or Treasury did not pursue collection of unreturned payments.[220]
* In 2022, Social Security made roughly $2.0 billion in improper overpayments. This was equal to 0.17% of all Social Security benefit payments for the year, or enough to pay 89,947 retired workers the average annual old-age benefit of $21,924 for 2023.[221] [222] [223]
* In 2009, President Obama issued Executive Order 13520 “to reduce improper payments by intensifying efforts to eliminate payment error.”[224] In 2010, Congress passed and Obama signed the Improper Payments Elimination and Recovery Act. This law requires federal agencies to report on their actions to reduce and recover improper payments and meet targeted payment accuracy rates.[225] [226]
* Per a 2016 report by the Social Security Administration’s Office of the Inspector General [OIG]:
* Once the Social Security Administration mistakenly overpays a beneficiary for more than four years, it does not recover past overpayments and deliberately continues to make future overpayments, except in cases of fraud.[228] [229] This policy is called “administrative finality,” and it is governed by regulations issued by the Commissioner of Social Security,[230] who is appointed by the U.S. President once every six years.[231]
* In 2007, the Inspector General of the Social Security Administration released the results of an audit that found 77,969 Social Security beneficiaries “whose benefit records indicated that administrative finality was involved.”[232]
* In a random sample of 275 of these beneficiaries,[233] the investigators found that:
* Based on the overpayment amounts of this survey group, the Office of the Inspector General estimated that as of June 2005, 44,230 active beneficiaries had their benefits:
* In the “Conclusion and Recommendation” section of its report, the Inspector General wrote that Social Security:
* The Commissioner of Social Security rejected this suggestion and responded in part:
* In 2012, an audit by the Inspector General of the Social Security Administration recommended that the Social Security Administration “evaluate its administrative finality policies and regulations and consider revising the rules to allow for the collection of more debt.” The Social Security Administration responded, “We agree.”[238]
* As of September 2023, the Social Security Administration’s regulations on administrative finality continue to require overpayments if an error is not corrected within four years.[239] [240]
* In 2010, the Government Accountability Office released the results of an investigation of federal employees and commercial drivers who were receiving disability benefits administered by the Social Security Administration [SSA].[241] The investigators reported that:
* Out of the cases identified above, the Government Accountability Office selected and investigated a nonrandom sample of 20 individuals based upon factors such as “higher overpayment amounts, the types of employment, and the locations of employment.”[246] The investigators found that:
* A common perception about Social Security benefits is:
* Social Security is mainly a “pay-as-you-go” program, which means that it pays most of its benefits by taxing people who are currently working.[256] [257] [258] Per the Social Security Administration:
* From the start of the Social Security program in 1937 through the end of 2022:
* Per the Social Security Administration:
* After the federal government pays back with interest all of the money it has borrowed from Social Security, the program’s current claim against the earnings of future generations is $48.4 trillion.[262] [263] This is larger than the national debt and amounts to an average of $196,731 for every person now receiving Social Security benefits or paying Social Security payroll taxes.[264] [265]
* Per the Social Security Administration:
* In 1960, the U.S. Supreme Court ruled (5 to 4) that entitlement to Social Security benefits is not a contractual right.[267]
* A common perception about Social Security finances is:
* No money has been taken from the Social Security program.[272] [273] [274] By law, Social Security surpluses must be loaned to the federal government.[275] [276] [277] This requirement was established in the original Social Security Act of 1935.[278] [279] [280] [281]
* The federal government is legally required to pay back with interest all money it has borrowed from Social Security, and it has never failed to do so throughout the program’s history.[282] [283] [284]
* Since 2010, Social Security has been using interest received from the federal government to cover the shortfalls between its expenses and non-interest income:
* The assets of the Social Security program include all of the money it has loaned to the federal government.[287] [288] After this money is fully repaid with interest, the program’s trustees project that the:
* If congresses and presidents had not added extra money to the Social Security program by increasing its payroll tax rates above the levels specified in the original Social Security Act, the program would have become insolvent before 1980.[291]
* All finances of the Social Security program are conducted through two dedicated trust funds in the U.S. Treasury: one for the old-age program and another for the disability program.[292]
* When Social Security collects more in taxes than it spends, it generates surplus money. By law, the only thing the program can do with its surplus money is loan it to the federal government.[293] [294] This has been the law since the original Social Security Act of 1935 and has not changed since then.[295] [296] [297] (For facts about the common claim that Social Security has been looted, click here.)
* Federal law requires the government to pay back any money it borrows from Social Security with interest. This money becomes a part of the national debt.[298] [299] [300] [301]
* Increases in the national debt are mainly borne by future workers and taxpayers.[302] [303]
* The national debt and interest on it are paid back with taxes from the general fund of the U.S. Treasury—not taxes that are restricted by law to fund specific programs like Social Security.[304] [305]
* Overall, general fund taxes are progressive so that higher-income households pay higher effective tax rates.[306] [307] [308] [309] [310] [311] These taxes are comprised of:
* The U.S. Treasury Department publishes a “Monthly Statement of the Public Debt” that details the components of the national debt, including the amounts owed to the Social Security program.[313]
* At the end of 2022, the U.S. government owed $2.8 trillion to the Social Security Trust Fund.[314] This equates to $8,470 for every man, woman, and child living in the United States, or $21,569 per household.[315]
* The Social Security program began drawing money from the Trust Fund in 2010 and is projected to keep drawing this money every year until the Fund is exhausted in 2034.[316] [317] [318]
* The U.S. Government Accountability Office explains that the Social Security Trust Fund represents “a claim on future resources” that must be funded “either through increased taxes, spending cuts, increased borrowing from the public, retiring less debt (if the unified budget is in surplus), or some combination thereof.”[319]
* The Clinton administration’s 2000 budget proposal explains that the Social Security Trust Fund does:
* A Congressional Budget Office report on “Debt and Interest Costs” explains that the money needed to pay back the Social Security Trust Fund:
* At the close of the federal government’s 2022 fiscal year, the federal government had $135.5 trillion in debts, liabilities, and unfunded obligations. This shortfall equates to $405,882 for every person living in the United States, or $1,032,660 per household.[322]
* From the outset of Social Security in 1937 through 2022, the U.S. government paid an annual average interest rate of 5.1% on the debt that it owed to Social Security. During this period, annual inflation as measured by the Consumer Price Index averaged 3.7%:
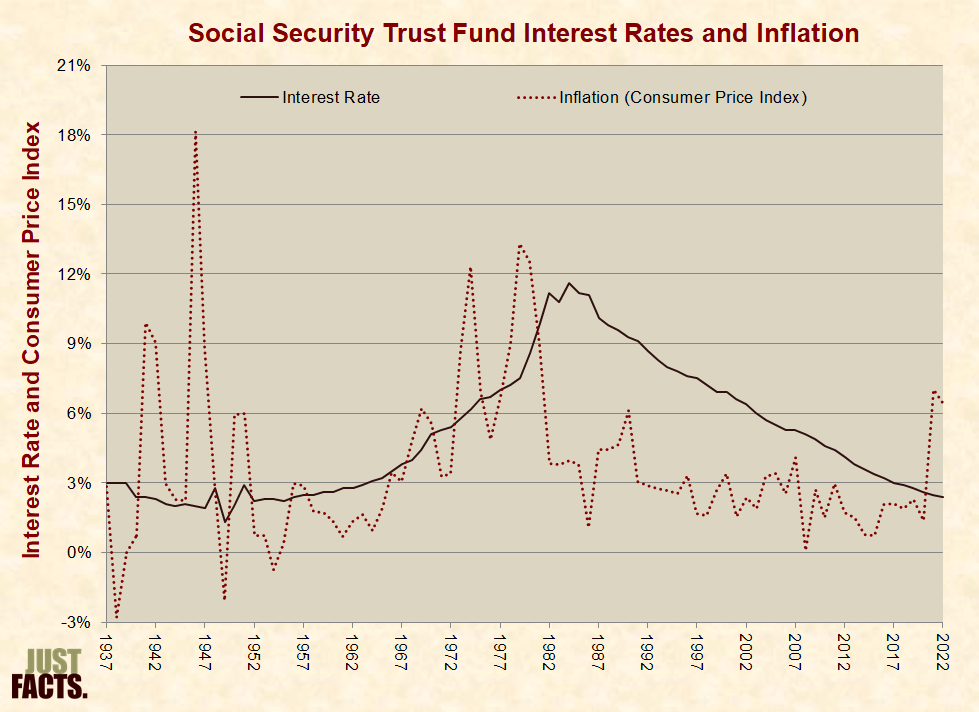
* The interest rates on the Social Security Trust Fund are driven by the same factors that affect the interest rates on other government debt.[325] These include but are not limited to inflation, economic growth, Federal Reserve policies, and investors’ assessments of risks and rewards.[326]
* The interest rates on the Social Security Trust Fund are determined by the average interest rates on long-term government debt. This applies regardless of whether Social Security holds short-term or long-term debt.[327]
* Because long-term debts generally have higher interest rates than short-term debts, the interest rates received by Social Security tend to be higher than interest rates on other government debt.[328] [329] [330] [331]
* The Social Security Trust Fund starts all new investments as short-term debt scheduled to mature on the upcoming June 30th. On June 30th, the matured debt and its interest are rolled into new debts of different maturities ranging from 1 to 15 years.[332] [333]
* Regardless of the maturity of a debt, Social Security can demand repayment with interest at any time if it needs money to cover expenses. This feature makes the Social Security Trust Fund similar to cash from a liquidity perspective.[334] [335] [336]
* The money that the federal government owes to Social Security is held in the form of securities issued by the United States Treasury. These securities are analogous to U.S. savings bonds, except that they can be redeemed before maturity without suffering a loss or enjoying a gain due to market forces. These securities cannot be purchased by the general public.[337]
* Bonds that represent the debt that the U.S. government owes to Social Security are located in a file cabinet at the Bureau of the Fiscal Service in Parkersburg, West Virginia. Below is a photo of President George W. Bush inspecting the documents along with Susan Chapman of the Office of Public Debt Accounting.[338] [339]

* The federal government divides the national debt into two main categories:[340]
* At the close of the federal government’s 2022 fiscal year,[345] the $30.9 trillion national debt was comprised of:
* The federal law that governs the repayment of the national debt draws no distinction between publicly held debt and intergovernmental debt. Both must be repaid with interest.[347]
* When the Social Security program loans money to the U.S. government, the government can use this money to pay down the debt that it owes to other entities. This leaves the national debt unchanged because the government must still pay back this money to the Social Security program. Some politicians have referred to this action as, “putting Social Security into a lockbox.”[348] [349]
* When the Social Security program loans money to the U.S. government, the government can also spend this money on other government programs. This increases the national debt because the government has spent the money it has borrowed from Social Security. Some politicians have referred to this action as, “raiding the Social Security Trust Fund.”[350] [351]
* When the U.S. government takes either of the above actions, the finances of the Social Security program are not affected. In both cases, the law requires the government to pay back the money to the Social Security program with interest.[352] [353]
* The impact of one action as opposed to the other is whether or not the national debt increases.[354] [355] [356] The national debt is not paid for with Social Security taxes but with money from the general fund of the U.S. Treasury.[357] [358] [359]
* In 1999, Republican Congressman Wally Herger sponsored a “lockbox” bill in the House of Representatives. This legislation would have restricted Congress from using money borrowed from the Social Security program to spend on other government programs.[360] It passed the House by a vote of 416 to 12.[361]
* In the Senate, Republicans attempted to bring this bill up for a vote, and Democrats blocked it with a filibuster. All 55 Republicans voted to allow the bill to move forward, 44 Democrats voted to block the bill, and one Democrat did not vote.[362] [363] [364]
* During his 2000 presidential campaign, Democratic nominee Al Gore stated:
* Regarding this statement:
* In 2001, while addressing Congress, Republican President George W. Bush stated:
* The $2 trillion in debt that President Bush referred to in this statement excluded the debt that is owed to federal entities such as Social Security.[377]
* Bush did not include the following information in his speech to Congress that appeared on page 201 of his budget proposal:
* The Social Security Administration states:
* At the outset of the Social Security program, the federal government published an informational pamphlet that stated the following with regard to Social Security benefits:
* Three years later in 1939, Congress and Democratic President Franklin D. Roosevelt eliminated a lump-sum benefit payment for the survivors of workers who died before the age of 65.[382]
* The original Social Security Act of 1935 states:
* The Social Security Administration’s website states:
* For those planning to collect Social Security after 2034, the program’s trustees project that the Trust Fund will be depleted and all benefits will be paid solely by workers who pay Social Security taxes at that time.[385] [386] It is also projected that Social Security taxes will be sufficient to pay 81% of scheduled benefits at that time.[387]
* Proposals have been made to give workers the option to change part of their Social Security involvement from a benefit program to a savings plan. These savings would be the personal property of each person who chose to participate. In turn, their Social Security benefits would be reduced to correspond with the amount of taxes they paid to the program.[388]
* Proposals to give Social Security an element of personal ownership are generally structured to improve the program’s finances. Typically, there are transition costs to cover the lowered taxes of those who opt to have personal accounts, but these costs are more than offset by the savings of not paying these individuals full benefits. For example, a proposal made in 2008 would eliminate $4.3 trillion in deficits but add $4.1 trillion in transition costs, thus equating to about $200 billion in savings.[389] [390]
* A scientific, nationally representative survey commissioned in 2019 by Just Facts found that 70% of voters believe personal ownership plans generally harm the finances of the Social Security program.[391] [392]
* To restrict speculation, personal ownership plans typically regulate the types of investments that can be made. Examples include restricting investments to broad-based funds or requiring that assets be moved to lower-risk investments as individuals approach retirement age. For instance, a personal ownership bill introduced by Republican Senator Jim DeMint restricts investments to federal bonds and private investment funds similar to those in the federal Thrift Savings Plan (described next).[393] [394] [395]
* Federal employees have access to a program called the Thrift Savings Plan in which the federal government and its employees invest part of their compensation in funds with varying mixes of investments.[396] At the end of 2022, approximately 6.8 million federal employees were enrolled,[397] and the plan had $737 billion in net assets.[398] This program has the following attributes:
* From 1926 through 2022, large company stocks (i.e., the S&P 500) appreciated by an average of 7.0% per year above the rate of inflation.[404] This figure is called the total annual real geometric mean return (hereafter referred to as “annual real return”).[405] From 1926 through 2022, the lowest annual real return for any 45-year period in the S&P 500 was 4.6%, and the highest was 8.7%.[406]
* For other classes of investments, the annual real returns from 1926 through 2022 were as follows:
|
Investment |
Average |
Lowest of Any 45-Year Period |
Highest of Any 45-Year Period |
|
Small Company Stocks |
8.6% |
6.8% |
12.8% |
|
Long-Term Corporate Bonds |
2.7% |
–1.5% |
5.2% |
|
Long-Term Government Bonds |
2.1% |
–1.8% |
4.9% |
|
Intermediate-Term Government Bonds |
1.9% |
–0.7% |
3.3% |
|
U.S. Treasury Bills |
0.3% |
–1.1% |
1.4% |
* The administrative costs associated with pension plans include “collecting funds, keeping records, managing assets, calculating and paying benefits, overseeing and enforcing rules, and (in some cases) marketing and selling the plans.”[409] [410]
* Factors affecting administrative costs include the number of individual accounts, the variety of services provided, the range of investments from which individuals are able to choose, the degree to which the system is centralized, and the amount of competition involved.[411] [412]
* Administrative overhead in pension systems is often expressed in terms of annual administrative costs divided by total assets.[413] [414] Hence, for a personal ownership system with annual administrative costs of $5 billion and total assets of $1 trillion, the annual administrative overhead would be $5/$1,000 or 0.50%.[415]
* In the context of Social Security personal ownership proposals, total administrative costs are typically unaffected by account balances. This is because the administrative cost per account is about the same, regardless of its value. Thus, proposals that allow individuals to save more of their payroll taxes generally have lower administrative costs as a percentage of assets.[416] [417] [418]
* In 2003, the chief actuary of the Social Security Administration estimated that the annual administrative costs of a personal ownership proposal that would allow individuals to save half of their payroll taxes would be about 0.25% of assets.[419]
* In 2004, Democratic Congressman Charles Stenholm and Republican Congressman Jim Kolbe introduced a personal ownership bill that would require individuals to save 19% of their payroll taxes. This bill duplicates features of the personal accounts in the federal Thrift Savings Plan,[420] [421] which in 2022 had total administrative costs ranging from 0.057% to 0.090% of assets.[422] [423] [424]
* Under the current system, a 22-year-old who works for the next 45 years earning $50,000/year will pay $279,000 in taxes to Social Security.[425] The program’s trustees project that all of this money will be spent before she turns 67 years old. Hence, any old-age benefits she receives will be derived from taxpayers who contribute to Social Security at that time.[426] [427]
* If this same person were allowed to save and invest 25% of her payroll taxes in the S&P 500, and the rates of return and administrative costs varied based upon the facts above, she would accumulate the following assets:
|
Scenario |
Annual Real Return (%) |
Administrative Costs (%) |
Assets by Age 67 |
|
“Bad” |
4.6% |
0.50% |
$198,957 |
|
“Average” |
7.0% |
0.25% |
$435,028 |
|
“Good” |
8.7% |
0.12% |
$764,314 |
* If this same person were allowed to save and invest 50% of her payroll taxes in the S&P 500, and the rates of return and administrative costs varied based upon the facts above, she would accumulate the following assets:
|
Scenario |
Annual Real Return (%) |
Administrative Costs (%) |
Assets by Age 67 |
|
“Bad” |
4.6% |
0.25% |
$428,049 |
|
“Average” |
7.0% |
0.12% |
$907,667 |
|
“Good” |
8.7% |
0.06% |
$1,560,468 |
* If this same person were allowed to save and invest 75% of her payroll taxes in the S&P 500 for the first 30 years and then progressively move all of these assets into intermediate-term government bonds over the last 15 years, and the rates of return and administrative costs varied based upon the facts above, she would accumulate the following assets:
|
Scenario |
S&P 500 Annual Real Return (%) |
Bonds Annual Real Return (%) |
Administrative Costs (%) |
Assets by Age 67 |
|
“Bad” |
4.6% |
–0.7% |
0.12% |
$451,836 |
|
“Average” |
7.0% |
1.9% |
0.08% |
$946,105 |
|
“Good” |
8.7% |
3.3% |
0.03% |
$1,596,842 |
* In general, for Social Security participants who are single and have no children under the age of 20, their benefits (or projected benefits) terminate when they die regardless of how much they have paid in Social Security taxes. There is no heritability in these cases except for a one-time death payment of $255 under certain circumstances.[431] [432] [433] [434]
* For workers who are currently 40 years old, their full retirement age is 67.[435] Their life expectancies beyond this age vary from 15.5 for Hispanic females to 5.0 for black males:
|
Race/Sex |
Years of Expected Life Beyond the Age of 67 |
|
Hispanic females |
15.5 |
|
White females |
13.8 |
|
Black females |
10.7 |
|
Hispanic males |
10.3 |
|
White males |
9.5 |
|
Black males |
5.0 |
* Personal ownership allows individuals to pass their Social Security savings to their heirs upon death.[437]
* During 2007–2010, various members of Congress introduced at least three bills that would have given workers the option to save and invest a portion of their Social Security payroll taxes. They also introduced a bill that would have made this mandatory for all workers below 66 years of age and another bill that would have made this optional for workers aged 22–54 and mandatory for younger workers. All of these bills were sponsored by Republicans. No Congressional action was taken on any of them.[438] [439]
* The 2008 and 2012 Republican Party Platforms supported giving workers “control over, and a sound return on” their Social Security contributions.[440] [441] The Republican Party 2016 Platform states that “we oppose tax increases and believe in the power of markets to create wealth and to help secure the future of our Social Security system.”[442] The Republican Party didn’t adopt a new platform in 2020.[443]
* The 2008, 2012, and 2016 Democratic Party Platforms opposed “privatization” of Social Security.[444] [445] [446] The 2020 Democratic Party Platform states that “Democrats will reject every effort to cut, privatize, or weaken Social Security, including attempts to raise the retirement age, diminish benefits by cutting cost-of-living adjustments, or reduce earned benefits.”[447]
* Since 1980, at least 27 countries have added an element of personal ownership to their Social Security systems.[448] The image below shows these nations and years when they adopted these reforms. This interactive website provides an overview of the system in each of these countries:

* At a news conference on March 16, 2005, NBC reporter David Gregory said to President George W. Bush:
* On the day before this news conference, the Washington Post released the results of a poll that included the following question:
* The poll found that 56% of Americans supported this plan, 41% opposed it, and 3% had no opinion.[452] In eight previous Washington Post polls in which this question was asked, the range of support varied from 52% to 64%.[453]
* The Washington Post summarized the results of its latest poll in a front-page article entitled “Skepticism of Bush’s Social Security Plan Is Growing.” The article, written by Jonathan Weisman, did not report the results of the question above.[454]
* In February 2001, the New York Times published an article written by Robert Pear entitled:
* The article stated:
* This study compared the disability benefits produced by several personal ownership proposals to the disability benefits specified by current law. To pay the disability benefits specified by current law, the Social Security tax rate needed to be increased over time by 49%.[457]
* This information appeared on page 44 of the General Accounting Office study and nowhere in the New York Times article.[458] [459]
* When this study compared the personal ownership proposals to the current Social Security system using the same tax rate for both plans, in the majority of cases, the personal ownership systems produced higher disability benefits than the current Social Security system.[460]
* This information appeared on page 36 of the General Accounting Office study and nowhere in the New York Times article.[461] [462]
* The New York Times article also stated that George W. Bush “has championed the rights of people with disabilities,” yet he “wants to let workers put some of their Social Security payroll taxes into personal investment accounts,” which “would reduce benefits for people with disabilities.”[463]
* Bush’s then-current plan did not propose any changes to the disability component of Social Security.[464] When Bush’s Social Security commission released a formal report later that year, it stated:
* Starting in 1946, Social Security cards had the following sentence imprinted on them:
* In 1961, the Social Security Administration issued new Social Security cards attached to a pamphlet that stated:
* Since 1961, various Congresses and presidential administrations have enacted more than 40 laws, regulations, and policies requiring the use of Social Security numbers for identity-related functions.[468]
* Starting in 1972, the sentence reading “For Social Security Purposes—Not For Identification” was removed from all newly issued Social Security cards.[469]
* In 1994, Democratic Congressman Dick Gephardt sponsored a law called the “Uruguay Round Agreements Act” that passed Congress with 67% of Democrats and 70% of Republicans voting for it. Democratic President Bill Clinton signed it into law. This legislation contains a section entitled:
* The law requires that parents submit Social Security numbers for their children with their tax return in order to obtain a tax exemption for their children.[471]
* Per the U.S. Social Security Administration:
[1] “2023 Annual Report of the Board of Trustees of the Federal Old-Age and Survivors Insurance and Disability Insurance Trust Funds.” United States Social Security Administration, March 28, 2023. <www.ssa.gov>
[2] Textbook: Cost Accounting: Principles And Practice. By Manash Dutta. Pearson Education, 2004.
Page 23.2: “Inflation accounting presents a true and correct view of the financial state of affairs of a firm, leads to the maintenance of physical capital and enables the business entity to make rational financial decisions.”
[3] Book: Quantitative Investing for the Global Markets: Strategies, Tactics, and Advanced Analytical Techniques. Edited by Peter Carman. Fitzroy Dearborn Publishers, 1997.
Pages 25–26: “World stock and bond markets can be expected to continue to grow, although not at the explosive pace of the past few decades. Some of the past growth has been due to rises in nominal asset prices that merely compensate for inflation; such rises are likely to be at lower rates in the future. But we should be concerned not with nominal quantities but with real [inflation-adjusted] ones.”
[4] “2023 Annual Report of the Board of Trustees of the Federal Old-Age and Survivors Insurance and Disability Insurance Trust Funds.” United States Social Security Administration, March 28, 2023. <www.ssa.gov>
Page 9:
The Trustees set key demographic, economic, and programmatic assumptions for three alternative scenarios. The intermediate assumptions reflect the Trustees’ best estimates of future experience. Therefore, most of the results presented in this overview indicate outcomes under the intermediate assumptions only. Any projection of the future is, of course, uncertain. For this reason, results are also presented under low-cost and high-cost alternatives to provide a range of possible future experience. The actual future costs are unlikely to be as extreme as those portrayed by the low-cost or high-cost projections.
Page 19: “Uncertainty of the Projections … Significant uncertainty surrounds the intermediate assumptions.”
[5] Webpage: “The Social Security Act of 1935.” United States Social Security Administration. Accessed September 16, 2021 at <www.ssa.gov>
The Social Security Act (Act of August 14, 1935) [House Resolution 7260]
An act to provide for the general welfare by establishing a system of Federal old-age benefits, and by enabling the several States to make more adequate provision for aged persons, blind persons, dependent and crippled children, maternal and child welfare, public health, and the administration of their unemployment compensation laws; to establish a Social Security Board; to raise revenue; and for other purposes.
[6] Report: “Major Decisions in the House and Senate on Social Security.” By Geoffrey Kollmann and Carmen Solomon-Fears. Domestic Social Policy Division, U.S. Social Security Administration, March 26, 2001. <www.ssa.gov>
H.R. [House Resolution] 7225, the Social Security Amendments of 1956, was signed by President Eisenhower on August 1, 1956. The amendments provided benefits, after a 6-month waiting period, for permanently and totally disabled workers aged 50 to 64 who were fully insured and had at least 5 years of coverage in the 10-year period before becoming disabled; to a dependent child 18 and older of a deceased or retired insured worker if the child became disabled before age 18; to women workers and wives at the age of 62, instead of 65, with actuarially reduced benefits; reduced from 65 to 62 the age at which benefits were payable to widows or parents, with no reduction; extended coverage to lawyers, dentists, veterinarians, optometrists, and all other self-employed professionals except doctors99 increased the tax rate by 0.25% on employer and employee each (0.375% for self-employed people) to finance disability benefits (thereby raising the aggregate tax rate ultimately to 4.25%); and created a separate disability insurance (DI) trust fund. The Social Security program now consisted of old-age, survivors, and disability insurance (OASDI).
[7] “2008 Annual Report of the Board of Trustees of the Federal Old-Age and Survivors Insurance and Disability Insurance Trust Funds.” United States Social Security Administration, March 28, 2008. <www.ssa.gov>
Page 131:
The Federal Old-Age and Survivors Insurance (OASI) Trust Fund was established on January 1, 1940 as a separate account in the United States Treasury. The Federal Disability Insurance (DI) Trust Fund, another separate account in the United States Treasury, was established on August 1, 1956. All the financial operations of the OASI and DI programs are handled through these respective funds.
[8] Report: “Social Security Policy Options.” Congressional Budget Office, July 2010. <www.cbo.gov>
Page 3:
Revenues from payroll taxes and from taxes on benefits, along with intragovernmental interest payments, are credited to the two Social Security trust funds—one for OASI [Old-Age and Survivor’s Insurance] and one for DI [Disability Insurance]. The program’s benefits and administrative costs are paid from those funds. Legally, the two funds are separate, but they often are described collectively as the OASDI trust funds.
[9] Report: “Charting the Future of Social Security’s Disability Programs: The Need for Fundamental Change.” Social Security Advisory Board, January 2001. <www.ssab.gov>
Page 2 (of PDF): “[The] Social Security Advisory Board [is] an independent, bipartisan Board created by the Congress and appointed by the President and the Congress to advise the President, the Congress, and the Commissioner of Social Security on matters related to the Social Security and Supplemental Security Income programs.”
Page ii: “Supplemental Security Income (SSI) is a means-tested income assistance program for aged, blind, and disabled individuals (regardless of prior workforce participation) and is funded from general revenues of the Treasury.”
[10] Calculated with data from:
a) “2023 Annual Report of the Board of Trustees of the Federal Old-Age and Survivors Insurance and Disability Insurance Trust Funds.” United States Social Security Administration, March 28, 2023. <www.ssa.gov>
Pages 63–64: “Table IV.B3.—Covered Workers and Beneficiaries, Calendar Years 1945–2100 … Historical data: … 2022 Beneficiariesb (in thousands) … OASDIc [=] 65,614 … b Beneficiaries with monthly benefits in current-payment status as of June 30. c This column is the sum of OASI [Old-Age & Survivors Insurance] and DI [Disability Insurance] beneficiaries. A small number of beneficiaries receive benefits from both funds.”
b) Dataset: “Monthly Population Estimates for the United States: April 1, 2020 to December 1, 2023.” U.S. Census Bureau, Population Division, December 2022. <www2.census.gov>
“Resident Population … June 1, 2022 [=] 333,133,413”
CALCULATION: 65,614,000 beneficiaries / 333,133,413 people = 20%
[11] Report: “Summary of Major Changes in the Social Security Cash Benefits Program: 1935–1996.” By Geoffrey Kollmann. Library of Congress, Congressional Research Service. Updated December 20, 1996. <www.ssa.gov>
Pages 1–2: “The Social Security Act of 1935 … Nearly all workers in commerce and industry under age 65, or about 60% of the work force, were required to participate in the Old-Age Insurance program. Principal groups excluded from the program were government workers, railroad employees, the self-employed, farm and domestic workers, and employees of nonprofit organizations.”
Page 4:
1950 Amendments
The 1950 amendments substantially expanded the scope of the Old-Age and Survivors Insurance (OASI) program by extending coverage to about 10 million additional workers. …
• Covered regularly employed farm and domestic workers, self-employed workers (except farmers and professionals), federal civilian employees not under a federal civil service retirement system ([for example] temporary employees), Americans employed outside the United States by American employers, and workers in Puerto Rico and the Virgin Islands. Not-for-profit organizations could elect coverage for their employees (except ministers). State and local governments could elect coverage for their employees not under public employee retirement systems.
Pages 16–17:
1983 Amendments …
• Coverage of federal civilian employees hired after December 31, 1983, and most current executive level political appointees and elected officials (including Members of Congress, the President, and the Vice President) and Federal judges, effective January 1984.
• Compulsory coverage of all employees of nonprofit organizations effective in January 1984 and a ban on the termination of coverage of nonprofit organization and state and local government employment after 1982.
[12] Report: “Annual Statistical Supplement to the Social Security Bulletin, 2013.” Social Security Administration, Office of Research, Evaluation, and Statistics, February 2014. <www.ssa.gov>
NOTE: Table 2.A1 in this report provides detailed information on “Covered Employment and Self-Employment Provisions, by Year Enacted.” This table is available at <www.ssa.gov>
[13] Report: “Reducing the Deficit: Spending and Revenue Options.” Congressional Budget Office, March 2011. <www.cbo.gov>
Page 171: “Unlike nearly all private-sector workers and federal employees, some workers employed by state and local governments—about 25 percent—are not covered by Social Security.”
[14] Article: “The Illusion of Pension Savings.” By Mary Williams Walsh. New York Times, September 17, 2010. <www.nytimes.com>
“Illinois’s pension funds are more fragile than most, but their survival is essential to thousands of people. The state’s teachers and certain other workers do not participate in Social Security, so for them, the pension fund is their only source of retirement income.”
[15] Webpage: “Social Security Coverage.” National Association of State Retirement Administrators. Accessed August 15, 2023 at <www.nasra.org>
Approximately one-fourth of employees of state and local government participate in a public retirement system in lieu of Social Security. This includes approximately 40 percent of public school teachers and over two-thirds of firefighters, police officers, and other first responders. Every state has groups of public employees that do not participate in Social Security. Most to substantially all of the public employees in Alaska, Colorado, Louisiana, Maine, Massachusetts, Nevada, and Ohio are not in Social Security.
[16] Webpage: “Are Members of Religious Groups Exempt From Paying Social Security Taxes?” United States Social Security Administration. Last modified October 7, 2022. <faq.ssa.gov>
Members of certain religious groups (including the Amish and Mennonites) may be exempt from paying Social Security taxes. To become exempt, they must:
• Waive their rights to all benefits under the Social Security Act, including hospital insurance benefits; and
• Meet the following requirements:
• Be a member of a recognized religious sect conscientiously opposed to accepting benefits under a private plan or system that makes payments in the event of death, disability or retirement, or which makes payments towards the costs of or provides for medical care (including the benefits of any insurance system established by social security);
• Be a member of a religious sect that makes a reasonable provision of food, shelter and medical care for its dependent members and has done so continuously since December 31, 1950; and
• Have never received or been entitled to any benefits payable under Social Security programs.
[17] Article: “The Great Depression and Wall Street Crash.” By Quentin R. Skrabec Jr. Economics: The Definitive Encyclopedia from Theory to Practice. Edited by David A. Dieterle. Greenwood, March 2017. Pages 192–195.
Page 194: “Today Social Security stands as the largest government program in the world and the single greatest expenditure in the U.S. federal budget.”
[18] Calculated with data from:
a) Dataset: “Table 3.16. Government Current Expenditures by Function [Billions of Dollars].” U.S. Department of Commerce, Bureau of Economic Analysis. Last revised November 17, 2023. <apps.bea.gov>
b) Report: “Fiscal Year 2024 Historical Tables: Budget Of The U.S. Government.” White House Office of Management and Budget, March 2023. <www.whitehouse.gov>
“Table 3.1—Outlays by Superfunction and Function: 1940–2028.” <www.whitehouse.gov>
NOTES:
[19] “2010 Annual Report of the Board of Trustees of the Federal Old-Age and Survivors Insurance and Disability Insurance Trust Funds.” United States Social Security Administration, August 5, 2010. <www.ssa.gov>
Page 216: “Payroll Taxes. A tax levied on the gross wages of workers.”
[20] Article: “Payroll Tax, Federal.” By Edward W. Harris. Encyclopedia of Taxation & Tax Policy (2nd edition). Edited by Joseph J. Cordes and others. Urban Institute Press, 2005. Pages 293–295.
Page 293:
A group of taxes levied on the earnings of employees and self-employed persons.
Payroll taxes have grown substantially in past decades and are now the second largest source of federal revenues. As a share of total receipts, payroll taxes increased from 10 percent in 1937 to 40 percent in 2003. Over the same period, payroll taxes grew from 1 percent to almost 7 percent of gross domestic product.
Page 295:
Incidence of Federal Payroll Taxes
Unemployment taxes are statutorily levied on employers only, while Social Security and Medicare taxes are levied on both the employer and the employee. Economists generally believe that the burden of payroll taxes is borne by workers in the form of lower wages, regardless of whether the tax is levied on the employer or the employee.
Payroll taxes are less progressive than individual income taxes because payroll taxes tax only earned income, and most payroll taxes include a maximum taxable earnings base. Effective or average federal payroll taxes rates increase across the bottom of the income distribution, since the lowest-income people generally have little income from wages. Average rates are virtually flat across the broad middle of the income distribution and decline at the top of the income scale, where people often have earnings above the taxable level. (Including both payroll taxes and the benefits financed by those taxes would show a more progressive system.) In an effort to increase the progressivity of payroll taxes and to create incentive to entering the labor force, the earned income tax credit (EITC) was introduced in 1975 to lighten the burden on working people below certain incomes. Since then, the EITC has been expanded several times, including the Omnibus Budget Reconciliation Acts in 1990 and 1993.
[21] Calculated with data from:
a) Dataset: “Old-Age and Survivors Insurance Trust Fund, 1937–2022.” United States Social Security Administration, Office of the Chief Actuary. Accessed August 15, 2023 at <www.ssa.gov>
b) Dataset: “Disability Insurance Trust Fund, 1957–2022.” United States Social Security Administration, Office of the Chief Actuary. Accessed August 15, 2023 at <www.ssa.gov>
c) Dataset: “CPI—All Urban Consumers (Current Series).” U.S. Department of Labor, Bureau of Labor Statistics. Accessed January 27, 2023 at <www.bls.gov>
“Series Id: CUUR0000SA0; Series Title: All Items in U.S. City Average, All Urban Consumers, Not Seasonally Adjusted; Area: U.S. City Average; Item: All Items; Base Period: 1982–84=100”
NOTES:
[22] Report: “Overview of the Federal Tax System as in Effect for 2014.” U.S. Congress, Joint Committee on Taxation, March 28, 2014. <www.jct.gov>
Page 25:
Social Security benefits and certain Medicare benefits are financed primarily by payroll taxes on covered wages. The Federal Insurance Contributions Act (“FICA”) imposes tax on employers and employees based on the amount of wages paid to an employee during the year. The tax imposed is composed of two parts: (1) the old age, survivors, and disability insurance (“OASDI”) tax equal to 6.2 percent of covered wages up to the taxable wage base ($142,800 in 2021); and (2) the Medicare hospital insurance (“HI”) tax amount equal to 1.45 percent of covered wages with no wage cap.92 In addition to the tax on employers, each employee’s wages are subject to FICA taxes equal to the amount of tax imposed on the employer. The employee FICA taxes generally must be withheld and, along with employer FICA taxes, remitted to the Federal government by the employer.93 …
As a parallel to FICA taxes, the Self-Employment Contributions Act (“SECA”) imposes taxes on the net income from self-employment of self-employed individuals. The rate of the OASDI portion of SECA taxes is equal to the combined employee and employer OASDI tax rates and applies to self-employment income up to the FICA taxable wage base. Similarly, the rate of the HI portion is the sum of the combined employer and employee HI rates, and there is no cap on the amount of self-employment income to which the rate applies.94
92 FICA taxes also includes an additional hospital insurance tax. Sec. 3101(b)(2).
93 Instead of FICA taxes, railroad employers, employees, and employee representatives are subject, under the Railroad Retirement Tax Act (“RRTA”), to taxes equivalent to the OASDI and HI taxes under FICA. Under RRTA, employers and employees are also subject to an additional tax, referred to as the “tier 2” tax, on compensation up to a certain amount.
94 For purposes of computing net earnings from self-employment, taxpayers are permitted a deduction equal to the product of the taxpayer’s earnings (determined without regard to this deduction) and one-half of the sum of the rates for OASDI (12.4 percent) and HI (2.9 percent), [that is] 7.65 percent of net earnings. This deduction reflects the fact that the FICA rates apply to an employee’s wages, which do not include FICA taxes paid by the employer, whereas a self-employed individual’s net earnings are economically equivalent to an employee’s wages plus the employer share of FICA taxes.
[23] Calculated with data from the: “2023 Annual Report of the Board of Trustees of the Federal Old-Age and Survivors Insurance and Disability Insurance Trust Funds.” United States Social Security Administration, March 28, 2023. <www.ssa.gov>
Page 213:
Table VI.G1.—Payroll Tax Contribution Rates for the OASDI [Social Security] and HI [Medicare Hospital Insurance] Programs [In percent] …
2013 and later … Self employedb … OASDI up to basec [=] 12.40% … HI all earningsd [=] 2.90% … HI over limite [=] 0.90% …
b Beginning in 1990, self-employed persons receive a deduction, for purposes of computing their net earnings, equal to half of the combined OASDI and HI contributions that would be payable without regard to the contribution and benefit base. The OASDI contribution rate then applies to net earnings after this deduction, but subject to the OASDI base.
c The payroll tax on earnings for the OASDI program applies to annual earnings up to a contribution and benefit base indexed to the average wage level. The base is $160,200 for 2023.
d Prior to 1994, the payroll tax on earnings for the HI program applied to annual earnings up to a contribution base. The HI contribution base was eliminated beginning in 1994.
e Starting with Federal personal income tax returns for tax year 2013, earned income exceeding $200,000 for individual filers and $250,000 for married couples filing jointly is subject to an additional HI tax of 0.9 percent. These income limits are not indexed after 2013.
Page 212: “This appendix does not include estimates for the Supplementary Medical Insurance (SMI) program because adequate financing is guaranteed in the law and because the SMI program is not financed through a payroll tax.”
Page 247: “Medicare consists of two separate but coordinated trust funds—Hospital Insurance (HI, Part A) and Supplementary Medical Insurance (SMI).”
CALCULATION: 12.4% + 2.9% = 15.3%
[24] Calculated with data from the: “2023 Annual Report of the Board of Trustees of the Federal Old-Age and Survivors Insurance and Disability Insurance Trust Funds.” United States Social Security Administration, March 28, 2023. <www.ssa.gov>
Page 213:
Table VI.G1.—Payroll Tax Contribution Rates for the OASDI [Social Security] and HI [Medicare Hospital Insurance] Programs [In percent] …
2013 and later … Employees and employers, combineda … OASDI up to basec [=] 12.40% … HI all earningsd [=] 2.90% … HI over limite [=] 0.90% …
a Except as noted below, the combined employee/employer rate is divided equally between employees and employers.
c The payroll tax on earnings for the OASDI program applies to annual earnings up to a contribution and benefit base indexed to the average wage level. The base is $160,200 for 2023.
d Prior to 1994, the payroll tax on earnings for the HI program applied to annual earnings up to a contribution base. The HI contribution base was eliminated beginning in 1994.
e Starting with Federal personal income tax returns for tax year 2013, earned income exceeding $200,000 for individual filers and $250,000 for married couples filing jointly is subject to an additional HI tax of 0.9 percent. These income limits are not indexed after 2013.
Page 212: “This appendix does not include estimates for the Supplementary Medical Insurance (SMI) program because adequate financing is guaranteed in the law and because the SMI program is not financed through a payroll tax.”
Page 247: “Medicare consists of two separate but coordinated trust funds—Hospital Insurance (HI, Part A) and Supplementary Medical Insurance (SMI).”
CALCULATIONS:
[25] “2023 Annual Report of the Board of Trustees of the Federal Hospital Insurance and Federal Supplementary Medical Insurance Trust Funds.” United States Department of Health and Human Services, Centers for Medicare and Medicaid Services, April 6, 2023. <www.cms.gov>
Page 31: “In addition, starting in 2013, high-income workers pay an additional 0.9 percent of their earnings above $200,000 (for single workers) or $250,000 (for married couples filing joint income tax returns).”
[26] Report: “Overview of the Federal Tax System as in Effect for 2023.” U.S. Congress, Joint Committee on Taxation, May 11, 2023. <www.jct.gov>
Page 26:
Additional Hospital Insurance Tax on Certain High-Income Individuals
The employee portion of the HI [Medicare Hospital Insurance] tax is increased by an additional tax of 0.9 percent on wages received in excess of a specific threshold amount.140 Employers are required to withhold the additional 0.9 percent on wages of the employee in excess of $200,000. However, unlike the general 1.45 percent HI tax on wages, this additional tax is on the combined wages of the employee and the employee’s spouse, in the case of a joint return. The threshold amount is $250,000 in the case of married filing jointly, $125,000 in the case of married filing separately, and $200,000 in any other case (unmarried individual, head of household or surviving spouse).141 Any difference between the amount withheld on wages in excess of $200,000 and the applicable tax based on the thresholds is reconciled on the individual’s personal income tax return.
The same additional HI tax applies to the HI portion of SECA [Self-Employment Contributions Act] tax on self-employment income in excess of the threshold amount. Thus, an additional tax of 0.9 percent is imposed on every self-employed individual on self-employment income in excess of the applicable threshold amount.142
114 These threshold amounts are not indexed for inflation.
[27] Determined by examining varied paychecks.
[28] Report: “Historical Effective Federal Tax Rates: 1979 to 2005.” Congressional Budget Office, December 2007. <www.cbo.gov>
Page 3:
Who Pays Taxes?
CBO’s [Congressional Budget Office’s] analysis of effective tax rates … assumes—as do most economists—that employers’ share of payroll taxes is passed on to employees in the form of lower wages than would otherwise be paid. Therefore, the amount of those taxes is included in employees’ income, and the taxes are counted as part of employees’ tax burden.
[29] Report: “Understanding the Tax Reform Debate: Background, Criteria, & Questions.” Prepared under the direction of James R. White (Director, Strategic Issues, Tax Policy and Administration Issues). United States Government Accountability Office, September 2005. <www.gao.gov>
Page 48:
Transparent tax systems include the following elements: …
• Taxpayers know their own tax burden and the tax burden of others: Irrespective of who actually writes a check to the government, taxpayers can identify who actually bears the burden of a tax. For example, the payroll tax is not transparent to the extent that taxpayers in general are unaware of the incidence of the tax. Even though payroll taxes are divided equally between employees and employers, economists generally agree that employees bear the entire burden of payroll taxes in the form of reduced wages.
Page 68: “Payroll Taxes Often synonymous with social insurance taxes. However, in some cases the term ‘payroll taxes’ may be used more generally to include all tax withholding. For the purposes of this report, payroll taxes are synonymous with social insurance taxes.”
Page 69: “Social Insurance Taxes Tax payments to the federal government for Social Security, Medicare, and unemployment compensation. While employees and employers pay equal amounts in social insurance taxes, economists generally agree that employees bear the entire burden of social insurance taxes in the form of reduced wages.”
[30] “2010 Annual Report of the Board of Trustees of the Federal Old-Age and Survivors Insurance and Disability Insurance Trust Funds.” United States Social Security Administration, August 9, 2010. <www.ssa.gov>
Page 34:
[U]nder these new laws, a combination of federal subsidies for individual insurance through the health benefit exchanges, penalties for being uninsured or not offering coverage, an excise tax on employer-sponsored group health insurance cost, and anticipated competitive premiums from health benefit exchanges are expected to slow the rate of growth in the total cost of employer-sponsored group health insurance. Most of this cost reduction is assumed to result in an increase in the share of employee compensation that will be provided in wages that will be subject to the Social Security payroll tax.
NOTE: To summarize the above, because the cost of health insurance is part of employers’ cost of compensating employees, if the cost of health insurance is decreased, “most” of the cost savings will be redirected to other forms of employee compensation such as salary. This is because employee compensation is generally driven by laws of supply and demand (with the notable exception of minimum wage laws). Likewise, because employer payroll taxes are a direct outcome of employers paying employees, most of this cost is redirected from other forms of employee compensation.
[31] Letter from Congressional Budget Office Director Douglas W. Elmendorf to U.S. Senator Charles E. Grassley, March 4, 2010. <www.gpo.gov>
Page 124:
The President proposes to assess an annual fee [i.e., tax] on liabilities of banks, thrifts, bank and thrift holding companies, brokers, and security dealers, as well as U.S. holding companies controlling such entities. …
… However, the ultimate cost of a tax or fee is not necessarily borne by the entity that writes the check to the government. The cost of the proposed fee would ultimately be borne to varying degrees by an institution’s customers, employees, and investors, but the precise incidence among those groups is uncertain. Customers would probably absorb some of the cost in the form of higher borrowing rates and other charges, although competition from financial institutions not subject to the fee would limit the extent to which the cost could be passed through to borrowers. Employees might bear some of the cost by accepting some reduction in their compensation, including income from bonuses, if they did not have better employment opportunities available to them. Investors could bear some of the cost in the form of lower prices of their stock if the fee reduced the institution’s future profits.
[32] Textbook: Public Finance (2nd edition). By John E. Anderson. South-Western, Cengage Learning, 2012.
Page 397:
When we consider the burden of a tax, we must distinguish between the burden as it is specified in the tax law and the true economic burden. Statutory incidence refers to tax incidence required by legal statutes. Of course, it is not possible to specify true economic incidence in law, but that does not stop lawmakers from trying. Consider a simple example. The U.S. Social Security payroll tax requires that employers and employees split the tax, each paying one-half of the total. Hence, the statutory incidence of the tax is that half the tax falls on the employer and half falls on the employee. … But, the true economic incidence of the payroll tax is quite different. The employer has some ability to adjust the employee’s wage and pass the employer’s half of the tax on to the employee. In fact, the employee may bear the entire tax. Of course, the extent to which the employer can pass the tax on to the employee depends on the labor supply elasticity of the employee; that is, the willingness of the employee to accept a lower wage and supply the same, or nearly the same, quantity of labor. Recent evidence in Gruber (1997), based on the Chilean payroll tax, for example, suggests that workers bear most of the burden of any increase in the tax rate.
[33] Webpage: “Current Law Distribution of Taxes.” Tax Policy Center (a joint project of the Urban Institute and Brookings Institution), October 26, 2013. <www.taxpolicycenter.org>
“A key insight from economics is that taxes are not always borne by the individual or business that writes the check to the IRS. Sometimes taxes are shifted. For example, most economists believe that the employer portion of payroll taxes translate into lower wages and are thus ultimately borne by workers.”
[34] Webpage: “Contribution and Benefit Base.” United States Social Security Administration, Office of the Chief Actuary. Accessed August 16, 2023 at <www.ssa.gov>
Social Security’s Old-Age, Survivors, and Disability Insurance (OASDI) program limits the amount of earnings subject to taxation for a given year. The same annual limit also applies when those earnings are used in a benefit computation. This limit changes each year with changes in the national average wage index. We call this annual limit the contribution and benefit base. This amount is also commonly referred to as the taxable maximum. For earnings in 2023, this base is $160,200.
[35] Webpage: “History of SSA-Related Legislation: 103rd Congress.” United States Social Security Administration. Accessed September 21, 2021 at <www.ssa.gov>
“PL 103-66 The Omnibus Budget Reconciliation Act of 1993 (enacted 8/10/93). Section 13207 repeals the limitation on the amount of earnings subject to the HI [Medicare Hospital Insurance] tax beginning in 1994.”
[36] Public Law 103-66: “Omnibus Budget Reconciliation Act of 1993.” 103rd U.S. Congress. Signed into law by Bill Clinton on August 10, 1993. <www.gpo.gov>
Title XIII, Chapter 1, Subchapter B, Part I, Subpart B:
Sec. 13207. Repeal of Limitation on Amount of Wages Subject to Health Insurance Employment Tax.
(a) Hospital Insurance Tax.—
(1) Paragraph (1) of section 3121(a) (defining wages) is amended—
(A) by inserting “in the case of the taxes imposed by sections 3101(a) and 3111(3)” after “(1)”,
(B) by striking “applicable contribution base (as determined under subsection (x))” each place it appears and inserting “contribution and benefit base (as determined under section 230 of the Social Security Act)”, and
(C) by striking “such applicable contribution base” and inserting “such contribution and benefit base”.
(2) Section 3121 is amended by striking subsection (x).
(b) Self-Employment Tax.—
(1) Subsection (b) of section 1402 is amended—
(A) by striking “that part of the net” in paragraph (1) and inserting “in the case of the tax imposed by section 1401(a), that part of the net”,
(B) by striking “applicable contribution base (as determined under subsection (k))” in paragraph (1) and inserting “contribution and benefit base (as determined under section 230 of the Social Security Act)”,
(C) by inserting “and” after “section 3121(b),”, and
(D) by striking “and (C) includes” and all that follows through “3111(b)”.
(2) Section 1402 is amended by striking subsection (k).
(c) Railroad Retirement Tax.—
(1) Subparagraph (A) of section 3231(eX2) is amended by adding at the end thereof the following new clause:
“(iii) Hospital Insurance Taxes.—Clause (i) shall not apply to—
“(I) so much of the rate applicable under section 3201(a) or 3221(a) as does not exceed the rate of tax in effect under section 3101(b), and
“(II) so much of the rate applicable under section 3211(a)(l) as does not exceed the rate of tax in effect under section 1401(b).”
(2) Clause (i) of section 3231(e)(2)(B) is amended to read as follows:
“(i) Tier 1 Taxes.—Except as provided in clause (ii), the term ‘applicable base’ means for any calendar year the contribution and benefit base determined under section 230 of the Social Security Act for such calendar year.”
(d) Technical Amendments.—
(1) Paragraph (1) of section 6413(c) is amended by striking “section 3101 or section 3201” and inserting “section 3101(a) or section 3201(a) (to the extent of so much of the rate applicable under section 3201(a) as does not exceed the rate of tax in effect under section 3101(a))”.
(2) Subparagraphs (B) and (C) of section 6413(cX2) are each amended by striking “section 3101” each place it appears and inserting “section 3101(a)”.
(3) Subsection (c) of section 6413 is amended by striking paragraph (3).
(4) Sections 3122 and 3125 are each amended by striking “applicable contribution base limitation” and inserting “contribution and benefit base limitation”.
(e) Effective Date.—The amendments made by this section 26 use 1402 shall apply to 1994 and later calendar years.
[37] Webpage: “Contribution and Benefit Base.” United States Social Security Administration, Office of the Chief Actuary. Accessed August 16, 2023 at <www.ssa.gov>
“For Medicare’s Hospital Insurance (HI) program, the taxable maximum was the same as that for the OASDI [Social Security] program for 1966–1990. Separate HI taxable maximums of $125,000, $130,200, and $135,000 were applicable in 1991–93, respectively. After 1993, there has been no limitation on HI-taxable earnings.”
[38] “Social Security Act of 1935.” United States Social Security Administration. Accessed October 4, 2021 at <www.ssa.gov>
Section 801. In addition to other taxes, there shall be levied, collected, and paid upon the income of every individual a tax equal to the following percentages of the wages (as defined in section 811) received by him after December 31, 1936, with respect to employment (as defined in section 811) after such date:
(1) With respect to employment during the calendar years 1937, 1938, and 1939, the rate shall be 1 per centum.
(2) With respect to employment during the calendar years 1940, 1941, and 1942, the rate shall be 1 1/2 per centum.
(3) With respect to employment during the calendar years 1943, 1944, and 1945, the rate shall be 2 per centum.
(4) With respect to employment during the calendar years 1946, 1947, and 1948, the rate shall be 2 1/2 per centum.
(5) With respect to employment after December 31, 1948, the rate shall be 3 per centum. …
Sec. 804. In addition to other taxes, every employer shall pay an excise tax, with respect to having individuals in his employ, equal to the following percentages of the wages (as defined in section 811) paid by him after December 31, 1936, with respect to employment (as defined in section 811) after such date:
(1) With respect to employment during the calendar years 1937, 1938, and 1939, the rate shall be 1 per centum.
(2) With respect to employment during the calendar years 1940, 1941, and 1942, the rate shall be 1 1/2 per centum.
(3) With respect to employment during the calendar years 1943, 1944, and 1945, the rate shall be 2 per centum.
(4) With respect to employment during the calendar years 1946, 1947, and 1948, the rate shall be 2 1/2 per centum.
(5) With respect to employment after December 31, 1948, the rate shall be 3 per centum.
[39] Report: “Summary of Major Changes in the Social Security Cash Benefits Program: 1935–1996.” By Geoffrey Kollmann. Library of Congress, Congressional Research Service. Updated December 20, 1996. <www.ssa.gov>
Pages 2–4: “1939 Amendments … Postponed the increase in the tax rate, scheduled for 1940, until 1943. (Subsequent amendments during the 1940s kept postponing the increase….)”
[40] Webpage: “Social Security & Medicare Tax Rates.” United States Social Security Administration, Office of the Chief Actuary. Accessed September 11, 2019 at <www.ssa.gov>
“Tax rates as a percent of taxable earnings … 1960–61 … Rate for employees and employers, each … OASDI [Social Security] [=] 3.000%”
[41] Report: “Summary of Major Changes in the Social Security Cash Benefits Program: 1935–1996.” By Geoffrey Kollmann. Library of Congress, Congressional Research Service. Updated December 20, 1996. <www.ssa.gov>
Pages 4–5: “1950 Amendments … Raised payroll taxes, so that the employee/employer share would gradually rise to an ultimate rate of 3.25% in 1970. The tax for the self-employed was set at 1 & 1/2 times the employee rate.”
Pages 5–6: “1954 Amendments … Raised … the ultimate tax rate to 4.0% for employers and employees, each, effective in 1975.”
Pages 6–7: “1956 Amendments … To finance the new benefits, the legislation established a Disability Insurance (DI) trust fund to which an additional .25% of contributions from employers and employees and .375% from the self-employed were allocated, raising the total employee/employer tax rate to 2.25% in 1957 and ultimately to 4.25% in 1975.”
Pages 8–9: “1961 Amendments … Increased the tax on employers and employees by one-eighth of 1% and by three-sixteenths of 1% for the self-employed.”
Page 9: “1965 Amendments … In addition, the contribution schedule for OASDI [Social Security] was increased, raising the tax rate on employers and employees from 3.625% to 3.85%, and on self-employed persons from 5.4% to 5.8% beginning in 1966.”
Pages 10–11: “1967 Amendments … The tax rates were increased, rising from an ultimate rate of 5.65% in 1987 to 5.9% for employees and employers, each, and from 7.8% to 7.9% for the self-employed.”
Page 11: “1971 Amendments … The tax rate was increased, rising from 5.9 to 6.05% in 1987 for employers and employees, each. The self-employed tax rate was not changed.”
Pages 11–12: “1972 Amendments … Raised payroll taxes, effective in 1978….”
Pages 12–13: “1973 Amendments … raised payroll taxes, effective in 1981….”
Pages 13–14: “1977 Amendments … Increased tax rates slightly in 1979 and 1980, and more significantly in 1981 and later….”
[42] Report: “Summary of Major Changes in the Social Security Cash Benefits Program: 1935–1996.” By Geoffrey Kollmann. Library of Congress, Congressional Research Service. Updated December 20, 1996. <www.ssa.gov>
Pages 16–17: “1983 Amendments … Acceleration of scheduled tax increases for employees and employers, with an offsetting tax credit for employees for 1984; increase in the rates for the self-employed to equal the combined employee/employer rate but with partially offsetting credits and deductions.”
[43] Public Law 111-312: “Tax Relief, Unemployment Insurance Reauthorization, and Job Creation Act of 2010.” 111th U.S. Congress. Signed into law by Barack Obama on December 17, 2010. <www.gpo.gov>
Title VI, Section 601:
Temporary Employee Payroll Tax Cut.
(a) In General.—Notwithstanding any other provision of law—
(1) with respect to any taxable year which begins in the payroll tax holiday period, the rate of tax under section 1401(a) of the Internal Revenue Code of 1986 shall be 10.40 percent, and
(2) with respect to remuneration received during the payroll tax holiday period, the rate of tax under 3101(a) of such Code shall be 4.2 percent (including for purposes of determining the applicable percentage under sections 3201(a) and 3211(a)(1) of such Code)….
(c) Payroll Tax Holiday Period—The term “payroll tax holiday period” means calendar year 2011. …
(e) Transfers of Funds.—
(1) Transfers to Federal Old-Age and Survivors Insurance Trust Fund.—There are hereby appropriated to the Federal Old-Age and Survivors Trust Fund and the Federal Disability Insurance Trust Fund established under section 201 of the Social Security Act (42 U.S.C. 401) amounts equal to the reduction in revenues to the Treasury by reason of the application of subsection (a). Amounts appropriated by the preceding sentence shall be transferred from the general fund at such times and in such manner as to replicate to the extent possible the transfers which would have occurred to such Trust Fund had such amendments not been enacted.
[44] Public Law 112-078: “Temporary Payroll Tax Cut Continuation Act of 2011.” 111th U.S. Congress. Signed into law by Barack Obama on December 23, 2011. <www.gpo.gov>
Sec. 101. Extension of Payroll Tax Holiday.
(a) In General.—Subsection (c) of section 601 of the Tax Relief, Unemployment Insurance Reauthorization, and Job Creation Act of 2010 (26 U.S.C. 1401 note) is amended to read as follows:
“(c) Payroll Tax Holiday Period.—The term ‘payroll tax holiday period’ means—
“(1) in the case of the tax described in subsection (a)(1), calendar years 2011 and 2012, and
“(2) in the case of the taxes described in subsection (a)(2), the period beginning January 1, 2011, and ending February 29, 2012.”
[45] Public Law 112-96: “Middle Class Tax Relief and Job Creation Act of 2012.” 112th U.S. Congress. Signed into law by Barack Obama on February 22, 2012. <www.gpo.gov>
Sec. 1001. Extension of Payroll Tax Reduction.
(a) In General.—Subsection (c) of section 601 of the Tax Relief, Unemployment Insurance Reauthorization, and Job Creation Act of 2010 (26 U.S.C. 1401 note) is amended to read as follows:
“(c) Payroll Tax Holiday Period.—The term ‘payroll tax holiday
period’ means calendar years 2011 and 2012.”
[46] Report: “Analytical Perspectives: Budget of the United States Government, Fiscal Year 2005.” White House Office of Management and Budget, February 2004. <fraser.stlouisfed.org>
Page 339: “The main financing component of the Federal funds group is the general fund, which is used to carry out the general purposes of Government rather than being restricted by law to a specific program. It consists of all collections not earmarked by law to finance other funds, including virtually all income taxes and many excise taxes….”
[47] Article: “Ways and Means Committee.” By Albert Buckberg. Encyclopedia of Taxation & Tax Policy. Edited by Joseph J. Cordes and others. Urban Institute Press, 2005.
Page 469: “Spending from the general fund is financed by general revenues, which include the individual and corporation income taxes, some excise taxes, estate and gift taxes, tariffs, and miscellaneous receipts.”
[48] Beginning in 2011 and continuing through 2022, monies equivalent to the decreased payroll taxes have been repaid to the trust fund, as can be seen with data from:
a) “2012 Annual Report of the Board of Trustees of the Federal Old-Age and Survivors Insurance and Disability Insurance Trust Funds.” United States Social Security Administration, April 23, 2012. <www.ssa.gov>
Page 23: “Reimbursements from the General Fund of the Treasury amounted to $87.8 billion in 2011. As shown in the table, Public Law 111-312, the Tax Relief, Unemployment Insurance Reauthorization, and Job Creation Act of 2010, accounts for almost all of the reimbursement for the year, or about $87.6 billion. This act specified general fund reimbursement for temporary reductions in employee payroll taxes.”
b) “2013 Annual Report of the Board of Trustees of the Federal Old-Age and Survivors Insurance and Disability Insurance Trust Funds.” United States Social Security Administration, May 31, 2013. <www.ssa.gov>
Page 25: “Net reimbursements from the General Fund of the Treasury amounted to $97.7 billion in 2012. As shown in the table, Public Law 111-312, the Tax Relief, Unemployment Insurance Reauthorization, and Job Creation Act of 2010, Public Law 112-78, the Temporary Payroll Tax Cut Continuation Act of 2011, and Public Law 112-96, the Middle Class Tax Relief and Job Creation Act of 2012, account for almost all of the reimbursement for the year, or about $97.6 billion. These acts specified general fund reimbursement for temporary reductions in employee payroll taxes.”
c) “2014 Annual Report of the Board of Trustees of the Federal Old-Age and Survivors Insurance and Disability Insurance Trust Funds.” United States Social Security Administration, July 28, 2014. <www.ssa.gov>
Page 26: “Net reimbursements from the General Fund of the Treasury amounted to $4.2 billion in 2013. As shown in the table, Public Law 111-312, the Tax Relief, Unemployment Insurance Reauthorization, and Job Creation Act of 2010, Public Law 112-78, the Temporary Payroll Tax Cut Continuation Act of 2011, and Public Law 112-96, the Middle Class Tax Relief and Job Creation Act of 2012, account for almost all of the reimbursement for the year, or about $4.1 billion. These acts specified general fund reimbursement for temporary reductions in employee and self-employment payroll taxes.2 … 2 Amounts transferred include adjustments to estimated initial appropriations to reflect actual tax receipts in prior periods.
d) “2015 Annual Report of the Board of Trustees of the Federal Old-Age and Survivors Insurance and Disability Insurance Trust Funds.” United States Social Security Administration, July 22, 2015. <www.ssa.gov>
Page 27: “Net reimbursements from the General Fund of the Treasury amounted to $0.4 billion in 2014. As shown in the table, adjustments to prior year receipts based on Public Law 111-312, the Tax Relief, Unemployment Insurance Reauthorization, and Job Creation Act of 2010, Public Law 112-78, the Temporary Payroll Tax Cut Continuation Act of 2011, and Public Law 112-96, the Middle Class Tax Relief and Job Creation Act of 2012, account for almost all of the reimbursement for the year. These acts specified general fund reimbursement for temporary reductions in employee and self-employment payroll taxes for earnings in 2011 and 2012.”
e) “2016 Annual Report of the Board of Trustees of the Federal Old-Age and Survivors Insurance and Disability Insurance Trust Funds.” United States Social Security Administration, June 22, 2016. <www.ssa.gov>
Pages 26–27: “Net reimbursements from the General Fund of the Treasury amounted to $0.3 billion in 2015. As shown in the table, adjustments to prior year receipts based on Public Law 111-312, the Tax Relief, Unemployment Insurance Reauthorization, and Job Creation Act of 2010, Public Law 112-78, the Temporary Payroll Tax Cut Continuation Act of 2011, and Public Law 112-96, the Middle Class Tax Relief and Job Creation Act of 2012, account for almost all of the reimbursement for the year, or about $266 million. These acts specified General Fund reimbursement for temporary reductions in employee and self-employment payroll taxes for earnings in 2011 and 2012.”
f) “2017 Annual Report of the Board of Trustees of the Federal Old-Age and Survivors Insurance and Disability Insurance Trust Funds.” United States Social Security Administration, July 13, 2017. <www.ssa.gov>
Pages 26–27: “Net reimbursements from the General Fund of the Treasury amounted to $0.1 billion in 2016. As shown in the table, adjustments to prior year receipts based on Public Law 111-312, the Tax Relief, Unemployment Insurance Reauthorization, and Job Creation Act of 2010, Public Law 112-78, the Temporary Payroll Tax Cut Continuation Act of 2011, and Public Law 112-96, the Middle Class Tax Relief and Job Creation Act of 2012, account for almost all of the reimbursement for the year, or about $87.2 million. These acts specified General Fund reimbursement for temporary reductions in employee and self-employment payroll taxes for earnings in 2011 and 2012.”
g) “2018 Annual Report of the Board of Trustees of the Federal Old-Age and Survivors Insurance and Disability Insurance Trust Funds.” United States Social Security Administration, June 5, 2018. <www.ssa.gov>
Pages 25–26: “Net reimbursements from the General Fund of the Treasury amounted to $17 million in 2017. As shown in the table, adjustments to prior year receipts based on Public Law 111-312, the Tax Relief, Unemployment Insurance Reauthorization, and Job Creation Act of 2010, Public Law 112-78, the Temporary Payroll Tax Cut Continuation Act of 2011, and Public Law 112-96, the Middle Class Tax Relief and Job Creation Act of 2012, account for most of the reimbursement for the year, or about $11 million. These acts specified General Fund reimbursement for temporary reductions in employee and self-employment payroll taxes for earnings in 2011 and 2012. … The remaining $6 million of the reimbursements from the General Fund in 2017 was almost entirely due to the provisions of Public Law 110-246, the Food, Conservation, and Energy Act of 2008. This act specified General Fund reimbursement for reductions in self-employment payroll taxes.”
h) “2019 Annual Report of the Board of Trustees of the Federal Old-Age and Survivors Insurance and Disability Insurance Trust Funds.” United States Social Security Administration, April 22, 2019. <www.ssa.gov>
Page 24: “Net reimbursements from the General Fund of the Treasury amounted to $18 million in 2018. As shown in the table, almost all of that amount came from adjustments to prior year reimbursements based on Public Law 111-312, the Tax Relief, Unemployment Insurance Reauthorization, and Job Creation Act of 2010, Public Law 112-78, the Temporary Payroll Tax Cut Continuation Act of 2011, and Public Law 112-96, the Middle Class Tax Relief and Job Creation Act of 2012. These acts specified General Fund reimbursement for temporary reductions in employee and self-employment payroll taxes for earnings in 2011 and 2012.”
i) “2020 Annual Report of the Board of Trustees of the Federal Old-Age and Survivors Insurance and Disability Insurance Trust Funds.” United States Social Security Administration, April 22, 2020. <www.ssa.gov>
Page 25: “Net reimbursements from the General Fund of the Treasury amounted to $11 million in 2019. As shown in the table, almost all of that amount came from adjustments to prior year reimbursements based on Public Law 111-312, the Tax Relief, Unemployment Insurance Reauthorization, and Job Creation Act of 2010, Public Law 112-78, the Temporary Payroll Tax Cut Continuation Act of 2011, and Public Law 112-96, the Middle Class Tax Relief and Job Creation Act of 2012. These acts specified General Fund reimbursement for temporary reductions in employee and self-employment payroll taxes for earnings in 2011 and 2012.”
j) “2021 Annual Report of the Board of Trustees of the Federal Old-Age and Survivors Insurance and Disability Insurance Trust Funds.” United States Social Security Administration, August 31, 2021. <www.ssa.gov>
Page 28: “Net reimbursements from the General Fund of the Treasury amounted to $1 million in 2020. As shown in the table, almost all of that amount came from adjustments to prior year reimbursements based on Public Law 111-312, the Tax Relief, Unemployment Insurance Reauthorization, and Job Creation Act of 2010, Public Law 112-78, the Temporary Payroll Tax Cut Continuation Act of 2011, and Public Law 112-96, the Middle Class Tax Relief and Job Creation Act of 2012. These acts specified General Fund reimbursement for temporary reductions in employee and self-employment payroll taxes for earnings in 2011 and 2012.”
k) “2022 Annual Report of the Board of Trustees of the Federal Old-Age and Survivors Insurance and Disability Insurance Trust Funds.” United States Social Security Administration, June 7, 2022. <www.ssa.gov>
Pages 28–29: “Net reimbursements from the General Fund of the Treasury amounted to $1 million in 2021. As shown in the table, almost all of that amount came from adjustments to prior year reimbursements based on Public Law 111-312, the Tax Relief, Unemployment Insurance Reauthorization, and Job Creation Act of 2010, Public Law 112-78, the Temporary Payroll Tax Cut Continuation Act of 2011, and Public Law 112-96, the Middle Class Tax Relief and Job Creation Act of 2012. These acts specified General Fund reimbursement for temporary reductions in employee and self-employment payroll taxes for earnings in 2011 and 2012.”
l) “2023 Annual Report of the Board of Trustees of the Federal Old-Age and Survivors Insurance and Disability Insurance Trust Funds.” United States Social Security Administration, March 28, 2023. <www.ssa.gov>
Page 244: “General Fund reimbursements. Payments from the General Fund of the Treasury to the trust funds for specific purposes defined in the law, including: … Payroll tax revenue forgone under the provisions of Public Laws 111-147, 111-312, 112-78, and 112-96.”
[49] Calculated with data from the webpage: “Social Security & Medicare Tax Rates.” United States Social Security Administration, Office of the Chief Actuary. Accessed August 16, 2023 at <www.ssa.gov>
NOTE: An Excel file containing the data and calculations is available upon request.
[50] “Social Security Act of 1935.” United States Social Security Administration. Accessed September 19, 2019 at <www.ssa.gov>
Sec. 811. When used in this title– (a) The term wages means all remuneration for employment, including the cash value of all remuneration paid in any medium other than cash; except that such term shall not include that part of the remuneration which, after remuneration equal to $3,000 has been paid to an individual by an employer with respect to employment during any calendar year, is paid to such individual by such employer with respect to employment during such calendar year.
[51] Textbook: Microeconomics (2nd edition). By Paul Krugman and Robin Wells. Worth Publishers, 2008.
Page 185:
The Social Security system was set up to resemble a private insurance program: people pay into the system during their working years, then receive benefits based on their payments. And the tax more or less reflects the benefits principle: because the benefits of Social Security are mainly intended to assist lower- and middle-income people, and don’t increase substantially for the rich, the Social Security tax is levied only on incomes up to a maximum level—$102,000 in 2008. (The Medicare portion of the payroll tax continues to be levied on incomes over $102,000.) As a result, a high-income family doesn’t pay much more in payroll taxes than a middle-income family.
[52] Calculated with data from:
a) Report: “Summary of Major Changes in the Social Security Cash Benefits Program: 1935–1996.” By Geoffrey Kollmann. Library of Congress, Congressional Research Service. Updated December 20, 1996. <www.ssa.gov>
Pages 4–5: “1950 Amendments … Set the earnings base (the minimum yearly amount of earnings on which Social Security taxes are paid and which is creditable for benefits) at $3,600 for 1951 and thereafter.”
Pages 5–6: “1954 Amendments … Raised the earnings base from $3,600 to $4,200 a year, effective in 1955….”
Page 7: “1958 Amendments … Raised the earnings base from $4,200 to $4,800.”
Page 9: “1965 Amendments … Increased the earnings base from $4,800 to $6,600, beginning in 1966.”
Pages 10–11: “1967 Amendments … Increased the earnings base from $6,600 to $7,800, beginning in 1968.
Page 11: “The 1971 amendments increased … the earnings base to $9,000, effective January 1972.”
b) Webpage: “CPI Inflation Calculator.” United States Department of Labor, Bureau of Labor Statistics. Accessed January 1, 2018 at <www.bls.gov>
“3,000 in January 1950 has the same buying power as $5,080.85 in January 1971 … The CPI inflation calculator uses the Consumer Price Index for All Urban Consumers (CPI-U) U.S. city average series for all items, not seasonally adjusted. This data represents changes in the prices of all goods and services purchased for consumption by urban households.”
CALCULATIONS:
[53] Calculated with data from:
a) Report: “Summary of Major Changes in the Social Security Cash Benefits Program: 1935–1996.” By Geoffrey Kollmann. Library of Congress, Congressional Research Service. Updated December 20, 1996. <www.ssa.gov>
Page 11: “1972 Amendments … effective in 1975, the earnings base and the exempt amount under the earnings test would be adjusted automatically to keep pace with changes in wage levels. The base was increased in the meantime to $10,800 for 1973 and $12,000 for 1974.”
Pages 12–13: “1973 Amendments … [T]he amendments increased the earnings base in 1974 to $13,200….”
b) Webpage: “CPI Inflation Calculator.” United States Department of Labor, Bureau of Labor Statistics. Accessed January 1, 2018 at <www.bls.gov>
“9,000 in January 1972 has the same buying power as $11,364.96 in December 1974 … The CPI inflation calculator uses the Consumer Price Index for All Urban Consumers (CPI-U) U.S. city average series for all items, not seasonally adjusted. This data represents changes in the prices of all goods and services purchased for consumption by urban households.”
CALCULATIONS:
[54] Report: “Summary of Major Changes in the Social Security Cash Benefits Program: 1935–1996.” By Geoffrey Kollmann. Library of Congress, Congressional Research Service. Updated December 20, 1996. <www.ssa.gov>
Pages 13–14: “1977 Amendments … Increased the earnings base, on an ad hoc basis, to $22,900 in 1979, $25,900 in 1980, and $29,700 in 1981.”
[55] Calculated with data from the webpage: “Contribution and Benefit Base.” United States Social Security Administration, Office of the Chief Actuary. Accessed September 11, 2014 at <www.ssa.gov>
|
Year |
Contribution and Benefit Base |
|
1978 |
$17,700 |
|
1979 |
$22,900 |
|
1980 |
$25,900 |
|
1981 |
$29,700 |
CALCULATION: ($29,700 – $17,700) / $17,700 = 68%
[56] Report: “Summary of Major Changes in the Social Security Cash Benefits Program: 1935–1996.” By Geoffrey Kollmann. Library of Congress, Congressional Research Service. Updated December 20, 1996. <www.ssa.gov>
Pages 13–14: “1977 Amendments … After 1981, the base would be adjusted automatically to keep up with average wages as under the prior law.”
[57] Report: “Average Wages for Indexing Under the Social Security Act and the Automatic Determinations for 1979–81.” By Eli N. Donkar. United States Social Security Administration, Office of the Chief Actuary, May 1981. <www.ssa.gov>
“The amended Act requires the use of an average wage for indexing described in various sections of the law as ‘the average of the total wages (as defined in regulations of the Secretary…).’ Such general language leaves a wide range of possibilities for a definition of such a wage series.”
[58] Calculated with data from:
a) Webpage: “Contribution and Benefit Base.” United States Social Security Administration, Office of the Chief Actuary. Accessed August 16, 2023 at <www.ssa.gov>
“Contribution and Benefit Bases, 1937–2023 … Year [=] 1990 … Amount [=] $51,300 … Year [=] 2021 … Amount [=] $142,800”
b) ) Webpage: “CPI Inflation Calculator.” United States Department of Labor, Bureau of Labor Statistics. Accessed August 18, 2023. <www.bls.gov>
$51,300 in January 1990 has the same buying power as $120,466.41 in January 2023
$142,800 in January 2021 has the same buying power as $163,319.63 in January 2023
“The CPI inflation calculator uses the Consumer Price Index for All Urban Consumers (CPI-U) U.S. city average series for all items, not seasonally adjusted. This data represents changes in the prices of all goods and services purchased for consumption by urban households.”
CALCULATION: ($163,319.63 – $120,466.41) / $120,466.41 = 36%
[59] Calculated with data from:
a) Webpage: “Measures of Central Tendency for Wage Data.” United States Social Security Administration, Office of the Chief Actuary. Accessed August 18, 2023 at <bit.ly>
“Average net compensation … Amount … 1990 [=] $20,172.11”
b) Webpage: “Measures of Central Tendency for Wage Data.” United States Social Security Administration, Office of the Chief Actuary. Accessed August 18, 2023 at <www.ssa.gov>
“Average net compensation … Amount … 2021 [=] $58,129.99”
c) Webpage: “CPI Inflation Calculator.” United States Department of Labor, Bureau of Labor Statistics. Accessed August 18, 2023. <www.bls.gov>
$20,172.11 in January 1990 has the same buying power as $47,369.62 in January 2023
$58,129.99 in January 2021 has the same buying power as $66,482.97 in January 2023
“The CPI inflation calculator uses the Consumer Price Index for All Urban Consumers (CPI-U) U.S. city average series for all items, not seasonally adjusted. This data represents changes in the prices of all goods and services purchased for consumption by urban households.”
CALCULATION: ($66,482.97 – $47,369.62) / $47,369.62 = 40%
[60] Calculated with data from:
a) Webpage: “Measures of Central Tendency for Wage Data.” United States Social Security Administration, Office of the Chief Actuary. Accessed August 18, 2023 at <bit.ly>
“Median net compensation … Amount … 1990 [=] $14,498.74”
b) Webpage: “Measures of Central Tendency for Wage Data.” United States Social Security Administration, Office of the Chief Actuary. Accessed August 18, 2023 at <www.ssa.gov>
“Median net compensation … Amount … 2021 [=] $37,586.03”
c) Webpage: “CPI Inflation Calculator.” United States Department of Labor, Bureau of Labor Statistics. Accessed August 18, 2023. <www.bls.gov>
$14,498.74 in January 1990 has the same buying power as $34,047.00 in January 2023
$37,586.03 in January 2021 has the same buying power as $42,986.95 in January 2023
“The CPI inflation calculator uses the Consumer Price Index for All Urban Consumers (CPI-U) U.S. city average series for all items, not seasonally adjusted. This data represents changes in the prices of all goods and services purchased for consumption by urban households.”
CALCULATION: ($42,986.95 – $34,047.00) / $34,047.00 = 26%
[61] Calculated with data from:
a) Webpage: “Contribution and Benefit Base.” United States Social Security Administration, Office of the Chief Actuary. Accessed August 16, 2023 at <www.ssa.gov>
b) Dataset: “CPI—All Urban Consumers (Current Series).” U.S. Department of Labor, Bureau of Labor Statistics. Accessed January 27, 2023 at <www.bls.gov>
“Series Id: CUUR0000SA0; Series Title: All Items in U.S. City Average, All Urban Consumers, Not Seasonally Adjusted; Area: U.S. City Average; Item: All Items; Base Period: 1982–84=100”
NOTE: An Excel file containing the data and calculations is available upon request.
[62] Calculated with data from the report: “Annual Statistical Supplement to the Social Security Bulletin, 2022.” Social Security Administration, November 29, 2022. Modified 8/16/2023. <www.ssa.gov>
Pages 4.13–4.14: “(OASDI) Taxable Earnings, Amount of Earnings, and Social Security Numbers Issued, Selected Years 1937–2021”
NOTES:
[63] “The 1936 Government Pamphlet on Social Security.” United States Social Security Administration. <www.ssa.gov>
The taxes called for in this law will be paid both by your employer and by you. For the next 3 years you will pay maybe 15 cents a week, maybe 25 cents a week, maybe 30 cents or more, according to what you earn. That is to say, during the next 3 years, beginning January 1, 1937, you will pay 1 cent for every dollar you earn, and at the same time your employer will pay 1 cent for every dollar you earn, up to $3,000 a year. Twenty-six million other workers and their employers will be paying at the same time.
After the first 3 year—that is to say, beginning in 1940—you will pay, and your employer will pay, 1.5 cents for each dollar you earn, up to $3,000 a year. This will be the tax for 3 years, and then, beginning in 1943, you will pay 2 cents, and so will your employer, for every dollar you earn for the next 3 years. After that, you and your employer will each pay half a cent more for 3 years, and finally, beginning in 1949, twelve years from now, you and your employer will each pay 3 cents on each dollar you earn, up to $3,000 a year. That is the most you will ever pay.
[64] Calculated with data from the webpage: “CPI Inflation Calculator.” United States Department of Labor, Bureau of Labor Statistics. Accessed February 25, 2023 at <www.bls.gov>
“3,000 in January 1949 has the same buying power as $37,396.25 in January 2023 …
The CPI inflation calculator uses the Consumer Price Index for All Urban Consumers (CPI-U) U.S. city average series for all items, not seasonally adjusted. This data represents changes in the prices of all goods and services purchased for consumption by urban households.
CALCULATION: 6% combined employer and employee payroll tax rate × $37,396.25 inflation-adjusted taxable maximum = $2,243.775
[65] Calculated with data from:
a) Webpage: “Social Security & Medicare Tax Rates.” United States Social Security Administration, Office of the Chief Actuary. Accessed February 25, 2023 at <www.ssa.gov>
“Tax rates as a percent of taxable earnings … 1990 and later … Rates for employees and employers, each … OASDI [Social Security] [=] 6.2%”
b) Webpage: “Contribution and Benefit Base.” United States Social Security Administration, Office of the Chief Actuary. Accessed February 25, 2023 at <www.ssa.gov>
“Social Security’s Old-Age, Survivors, and Disability Insurance (OASDI) program limits the amount of earnings subject to taxation for a given year. The same annual limit also applies when those earnings are used in a benefit computation. This limit changes each year with changes in the national average wage index. We call this annual limit the contribution and benefit base. This amount is also commonly referred to as the taxable maximum. For earnings in 2023, this base is $160,200.”
CALCULATIONS:
[66] Twitter post: “Raising the Cap on Payroll Taxes for the Wealthy.” By Elizabeth Warren, February 25, 2023. <twitter.com>
Right now, someone making $160,000/year pays the same amount into Social Security as someone making $16,000,000,000. That doesn’t make ANY sense. By raising the cap on payroll taxes for the wealthy, we can increase Social Security by $200/month and fund the program through 2095.
[67] Twitter post: “Let’s Raise the Cap.” By Bernie Sanders, February 23, 2023. <twitter.com>
Here’s the crazy situation. Somebody making $10 million in a year is contributing the EXACT SAME AMOUNT into Social Security as somebody making $160,000. Let’s raise the cap and expand Social Security benefits, not cut them.
[68] “The 1936 Government Pamphlet on Social Security.” United States Social Security Administration. <www.ssa.gov>
“The checks will come to you as a right. You will get them regardless of the amount of property or income you may have. They are what the law calls ‘Old-Age Benefits’ under the Social Security Act.”
[69] Pamphlet: “Understanding the Benefits.” United States Social Security Administration, January 2023. <www.ssa.gov>
Pages 10–11:
Your Benefits May Be Taxable
Some people who get Social Security will have to pay taxes on their benefits. About 46% of our current beneficiaries pay taxes on their benefits.
You may have to pay taxes on your benefits if you file a federal tax return as an “individual” and your total income is more than $25,000. If you file a joint return, you may have to pay taxes if you and your spouse have a total income that is more than $32,000.
[70] Publication 915: “Social Security and Equivalent Railroad Retirement Benefits for Use in Preparing 2022 Returns.” United States Department of the Treasury, Internal Revenue Service, February 7, 2023. <www.irs.gov>
Page 3:
Are Any of Your Benefits Taxable?
To find out whether any of your benefits … may be taxable, compare the base amount (explained later) for your filing status with the total of:
1. One-half of your benefits; plus
2. All your other income, including tax-exempt interest.
Exclusions. When making this comparison, don’t reduce your other income by any exclusions for:
• Interest from qualified U.S. savings bonds,
• Employer-provided adoption benefits,
• Interest on education loans,
• Foreign earned income or foreign housing, or
• Income earned by bona fide residents of American Samoa or Puerto Rico.
Page 6:
How Much Is Taxable?
If part of your benefits are taxable, how much is taxable depends on the total amount of your benefits and other income. Generally, the higher that total amount, the greater the taxable part of your benefits.
Maximum Taxable Part. Generally, up to 50% of your benefits will be taxable. However, up to 85% of your benefits can be taxable if either of the following situations applies to you.
• The total of one-half of your benefits and all your other income is more than $34,000 ($44,000 if you are married filing jointly).
• You are married filing separately and lived with your spouse at any time during 2022.
[71] “2023 Annual Report of the Board of Trustees of the Federal Old-Age and Survivors Insurance and Disability Insurance Trust Funds.” United States Social Security Administration, March 28, 2023. <www.ssa.gov>
Page 152: “Under current law, the OASI [Old-Age and Survivors Insurance] and DI [Disability Insurance] Trust Funds are credited with income tax revenue from the taxation of up to the first 50 percent of taxpayers’ OASI and DI benefit payments. (The HI Trust Fund receives the remainder of the income tax revenue from the taxation of up to 85 percent of taxpayers’ OASI and DI benefit payments.)”
[72] See the three footnotes above.
[73] “2023 Annual Report of the Board of Trustees of the Federal Old-Age and Survivors Insurance and Disability Insurance Trust Funds.” United States Social Security Administration, March 28, 2023. <www.ssa.gov>
Page 153: “The Office of the Chief Actuary’s estimates reflect the following assumptions: (1) The income thresholds used for benefit taxation are specified in the Internal Revenue Code to be constant in the future, and have never been changed, while income and benefit levels continue to rise. Accordingly, projected ratios of income from taxation of benefits to the amount of benefits increase gradually.”
[74] Calculated with data from the pamphlet: “How You Earn Credits.” U.S. Social Security Administration, January 2023. <www.ssa.gov>
Page 1:
We base Social Security credits on the amount of your earnings. We use your earnings and work history to determine your eligibility for retirement or disability benefits or your family’s eligibility for survivors benefits when you die.
In 2023, you receive 1 credit for each $1,640 of earnings, up to the maximum of 4 credits per year.
Each year the amount of earnings needed for credits goes up slightly as average earnings levels increase. The credits you earn remain on your record even if you change jobs or have no earnings for a while.
Page 2:
How Long You Must Work to Qualify for Social Security
The number of credits you need to be eligible for benefits depends on your age and the type of benefit.
Retirement Benefits
Anyone born in 1929 or later needs 10 years of work (40 credits) to be eligible for retirement benefits.
CALCULATION: $1,640 per credit × 4 credits per year = $6,560
[75] Pamphlet: “Your Retirement Benefit: How It Is Figured.” United States Social Security Administration, January 2023. <www.ssa.gov>
Page 1 (of PDF):
Many people wonder how we figure their Social Security retirement benefit. We:
• Base Social Security benefits on your lifetime earnings.
• Adjust or “index” your actual earnings to account for changes in average wages since the year the earnings were received.
• Calculate your average indexed monthly earnings during the 35 years in which you earned the most.
• Apply a formula to these earnings and arrive at your basic benefit, or “primary insurance amount.”
This is how much you would receive at your full retirement age—65 or older, depending on your date of birth.
NOTES:
[76] Webpage: “Social Security Quick Calculator.” United States Social Security Administration. Accessed August 21, 2023 at <www.ssa.gov>
[77] Webpage: “Primary Insurance Amount.” United States Social Security Administration, Office of the Chief Actuary. Accessed August 21, 2023 at <www.ssa.gov>
PIA Definition
The “primary insurance amount” (PIA) is the benefit (before rounding down to next lower whole dollar) a person would receive if he/she elects to begin receiving retirement benefits at his/her normal retirement age. At this age, the benefit is neither reduced for early retirement nor increased for delayed retirement.
PIA Formula Bend Points
The PIA is the sum of three separate percentages of portions of average indexed monthly earnings. The portions depend on the year in which a worker attains age 62, becomes disabled before age 62, or dies before attaining age 62.
For 2023 these portions are the first $1,115, the amount between $1,115 and $6,721, and the amount over $6,721. These dollar amounts are the “bend points” of the 2023 PIA formula. A table shows bend points, for years beginning with 1979, for both the PIA and maximum family benefit formulas.
PIA Formula
For an individual who first becomes eligible for old-age insurance benefits or disability insurance benefits in 2023, or who dies in 2023 before becoming eligible for benefits, his/her PIA will be the sum of:
(a) 90 percent of the first $1,115 of his/her average indexed monthly earnings, plus
(b) 32 percent of his/her average indexed monthly earnings over $1,115 and through $6,721, plus
(c) 15 percent of his/her average indexed monthly earnings over $6,721.
NOTE: The above PIA formula weights lower earnings (and thus lower taxes paid) more than greater earnings (and thus higher taxes paid).
[78] Calculated with data from:
a) Webpage: “Social Security & Medicare Tax Rates.” United States Social Security Administration, Office of the Chief Actuary. Accessed August 16, 2023 at <www.ssa.gov>
b) Webpage: “Social Security Quick Calculator.” United States Social Security Administration. Accessed August 21, 2023 at <www.ssa.gov>
NOTES:
[79] See previous footnote.
[80] Article: “Earned Income Tax Credit.” By Jonathan Barry Forman. The Encyclopedia of Taxation & Tax Policy. Edited by Joseph J. Cordes, Robert D. Ebel, and Jane Gravelle. Urban Institute Press, 2005. Pages 91–93.
Page 92: “As originally adopted in 1975, the earned income credit was intended to offset the Social Security taxes of low-income workers with children and to provide those taxpayers with an increased incentive to work. “
[81] Testimony: “Federal Taxes: Information on Payroll Taxes and Earned Income Tax Credit Noncompliance.” By Michael Brostrek (director of Tax Issues, U.S. General Accounting Office). Committee on Finance, U.S. Senate, March 7, 2001. <www.govinfo.gov>
The EITC [earned income tax credit] is a refundable tax credit established by Congress in 1975. The EITC offsets much of the impact of Social Security taxes paid by low-income workers and is intended to encourage low-income persons to seek work rather than welfare. There are significant compliance problems associated with the EITC that have led to our listing the Internal Revenue Service’s (IRS) administration of the credit among the high risk areas for the federal government.
[82] For example, the average earned income tax credit is about $2,043,† and workers who earn $20,000/year pay $2,480/year in Social Security taxes.‡ Thurs, the earned income tax credit effectively reduces their Social Security taxes by 82%.
NOTES:
[83] Webpage: “Statistics for Tax Returns with EITC.” U.S. Internal Revenue Service. Last updated March 17, 2023. <www.eitc.irs.gov>
“As of December 2022, 31 million workers and families received about $64 billion in EITC [earned income tax credit]. The average amount of EITC received nationwide was about $2,043.”
[84] Report: “How Pension Financing Affects Returns to Different Generations.” Congressional Budget Office, September 22, 2004. <www.cbo.gov>
Page 1: “Present value adjusts for the fact that money is more valuable the earlier it is received because it can be invested and earn interest.”
Pages 2–3:
However, not all generations face constant tax and benefit rates, so not all lose from a pay-as-you-go system. Any particular generation can gain on average if payroll taxes and benefits are increased close to or after its retirement, because only working people pay the increased taxes. Similarly, a pay-as-you-go system provides gains to generations who retire near the inception of the program, because they receive benefits even if they paid little or nothing in taxes. By creating winners and losers in that way, the system shifts resources among generations.
For example, members of the generation born in 1900 received almost seven times as much in Social Security benefits as they paid in payroll taxes (in present value). Later generations also benefited from expansions of the program. Altogether, the generations born between 1876 and 1937 are projected to receive a total of $8.1 trillion more from the Social Security system than they paid in.6 Those gains are balanced by projected losses for generations born after 1937 because returns on contributions fall below market rates of return (see Figure 1).
[85] Report: “Social Security Reform: Current Issues and Legislation.” By Dawn Nuschler. Congressional Research Service, November 28, 2012. <fas.org>
Page 14:
Until recent years, Social Security beneficiaries received more, often far more, than the value of the Social Security taxes they paid. However, because Social Security payroll tax rates have increased over the years and the full retirement age (the age at which unreduced benefits are first payable) is being increased gradually, it is becoming more apparent that Social Security will be less of a good deal for many future retirees. For example, for workers who earned average wages and retired in 1980 at the age of 65, it took 2.8 years to recover the value of the retirement portion of the combined employee and employer shares of their Social Security taxes plus interest. For their counterparts who retired at the age of 65 in 2003, it will take 17.4 years. For those retiring in 2020, it will take 21.6 years.
[86] The Social Security Trustees project that the Trust Fund will be depleted in 2034, after which, the program will be unable to pay full benefits. For more information, see the section on Financial Status.
[87] Webpage: “Cost of Living Adjustments.” United States Social Security Administration. Accessed August 22, 2023 at <www.ssa.gov>
Since 1975, Social Security general benefit increases have been cost-of-living adjustments or COLAs. The 1975–82 COLAs were effective with Social Security benefits payable for June in each of those years; thereafter COLAs have been effective with benefits payable for December.
Prior to 1975, Social Security benefit increases were set by legislation. …
|
Year |
COLA |
Year |
COLA |
Year |
COLA |
||
|
1975 |
8.0% |
1991 |
3.7% |
2007 |
2.3% |
||
|
1976 |
6.4% |
1992 |
3.0% |
2008 |
5.8% |
||
|
1977 |
5.9% |
1993 |
2.6% |
2009 |
0.0% |
||
|
1978 |
6.5% |
1994 |
2.8% |
2010 |
0.0% |
||
|
1979 |
9.9% |
1995 |
2.6% |
2011 |
3.6% |
||
|
1980 |
14.3% |
1996 |
2.9% |
2012 |
1.7% |
||
|
1981 |
11.2% |
1997 |
2.1% |
2013 |
1.5% |
||
|
1982 |
7.4% |
1998 |
1.3% |
2014 |
1.7% |
||
|
1983 |
3.5% |
1999 a |
2.5% |
2015 |
0.0% |
||
|
1984 |
3.5% |
2000 |
3.5% |
2016 |
0.3% |
||
|
1985 |
3.1% |
2001 |
2.6% |
2017 |
2.0% |
||
|
1986 |
1.3% |
2002 |
1.4% |
2018 |
2.8% |
||
|
1987 |
4.2% |
2003 |
2.1% |
2019 |
1.6% |
||
|
1988 |
4.0% |
2004 |
2.7% |
2020 |
1.3% |
||
|
1989 |
4.7% |
2005 |
4.1% |
2021 |
5.9% |
||
|
1990 |
5.4% |
2006 |
3.3% |
2022 |
8.7% |
||
|
a The COLA for December 1999 was originally determined as 2.4 percent based on CPIs [Consumer Price Index] published by the Bureau of Labor Statistics. Pursuant to Public Law 106-554, however, this COLA is effectively now 2.5 percent. |
|||||||
The first COLA, for June 1975, was based on the increase in the Consumer Price Index for Urban Wage Earners and Clerical Workers (CPI-W) from the second quarter of 1974 to the first quarter of 1975. The 1976–83 COLAs were based on increases in the CPI-W from the first quarter of the prior year to the corresponding quarter of the current year in which the COLA became effective. After 1983, COLAs have been based on increases in the CPI-W from the third quarter of the prior year to the corresponding quarter of the current year in which the COLA became effective.
[88] Pamphlet: “Understanding the Benefits.” United States Social Security Administration, January 2023. <www.ssa.gov>
Page 7:
Full Retirement Age
If you were born from 1943 to 1960, the age at which full retirement benefits are payable increases gradually to age 67. In 2023, if your birth year is 1955 or earlier, you’re already eligible for your full Social Security benefit. Use the following chart to find out your full retirement age.
|
Year of Birth |
Full Retirement Age |
|
1943–1954 |
66 |
|
1955 |
66 and 2 months |
|
1956 |
66 and 4 months |
|
1957 |
66 and 6 months |
|
1958 |
66 and 8 months |
|
1959 |
66 and 10 months |
|
1960 or later |
67 |
[89] Pamphlet: “Understanding the Benefits.” United States Social Security Administration, January 2023. <www.ssa.gov>
Page 8:
Early Retirement
You may start receiving benefits as early as age 62. We reduce your benefits if you start early by about 0.5% for each month you start receiving benefits before your full retirement age. For example, if your full retirement age is 67, and you sign up for Social Security when you’re 62, you would only get about 70% of your full benefit.
[90] Pamphlet: “Understanding the Benefits.” United States Social Security Administration, January 2023. <www.ssa.gov>
Page 7:
Delayed Retirement
If you choose to delay receiving benefits beyond your full retirement age, we’ll increase your benefit a certain percentage, depending on the year of your birth. We’ll add the increase automatically each month from the time you reach full retirement age, until you start receiving benefits or reach age 70, whichever comes first.
[91] Pamphlet: “Understanding the Benefits.” United States Social Security Administration, January 2023. <www.ssa.gov>
Page 11:
Benefits for Your Family
When you start receiving Social Security retirement or disability benefits, other family members may also be eligible to receive benefits. For example, benefits can be paid to your spouse:
• If they’re age 62 or older.
• At any age if they’re caring for your child (the child must be younger than 16 or have a disability and entitled to Social Security benefits on your record).
Benefits can also be paid to your unmarried children if they’re:
• Younger than 18.
• Between 18 and 19 years old, but in elementary or secondary school as full-time students.
• Age 18 or older and have a qualifying disability (the disability must have started before age 22).
Under certain circumstances, we can also pay benefits to a stepchild, grandchild, step-grandchild, or an adopted child. If you become the parent of a child after you begin receiving benefits, let us know about the child, so we can decide if the child is eligible for benefits.
[92] Pamphlet: “Social Security: A Brief History.” United States Social Security Administration, August 2005. <www.ssa.gov>
Page 5: “Under the 1935 law, monthly benefits were to start in 1942. From 1937 until 1942, Social Security was to pay benefits to retirees in the form of a single, lump-sum refund payment.”
[93] Calculated with data from the pamphlet: “Social Security: A Brief History.” United States Social Security Administration, August 2005. <www.ssa.gov>
Page 5:
Under the 1935 law, monthly benefits were to start in 1942. From 1937 until 1942, Social Security was to pay benefits to retirees in the form of a single, lump-sum refund payment. The earliest reported applicant for a lump-sum refund was a retired Cleveland motorman named Ernest Ackerman, who retired one day after the Social Security program began. During his one day of participation in the program, a nickel was withheld from Mr. Ackerman’s pay for Social Security, and, upon retiring, he received a lump-sum payment of 17 cents.
CALCULATION: (17 – 5) / 5 = 240%
[94] Pamphlet: “Your Social Security Statement.” United States Social Security Administration, January 2, 2015.
Page 1 (of PDF): “Social Security is the largest source of income for most elderly Americans today, but Social Security was never intended to be your only source of income when you retire. You also will need other savings, investments, pensions or retirement accounts to make sure you have enough money to live comfortably when you retire.”
[95] Pamphlet: “Understanding the Benefits.” United States Social Security Administration, January 2023. <www.ssa.gov>
Page 1:
The amount of your average wages that Social Security retirement benefits replaces depends on your earnings and when you choose to start benefits. If you start benefits in 2022 at your “full retirement age” … this percentage ranges from as much as 75% for very low earners, to about 40% for medium earners, to about 27% for maximum earners. If you start benefits after full retirement age, these percentages would be higher. If you start benefits earlier, these percentages would be lower. Most financial advisers say you will need about 70% of pre-retirement income to live comfortably in retirement, including your Social Security benefits, investments, and personal savings.
[96] Calculated with data from the pamphlet: “Understanding the Benefits.” United States Social Security Administration, January 2023. <www.ssa.gov>
Page 22: “Estimated Average 2023 Monthly Social Security Benefits … All retired workers: $1,827”
CALCULATION: $1,827 average benefit per month × 12 months per year = $21,924 average annual benefit
[97] Dataset: “Poverty Thresholds for 2022 by Size of Family and Number of Related Children Under 18 Years.” United States Census Bureau. Accessed August 22, 2023 at <www2.census.gov>
“Size of family unit … One person (unrelated individual) … 65 years and over [=] $14,036”
[98] Calculated with data from the pamphlet: “Understanding the Benefits.” United States Social Security Administration, January 2023. <www.ssa.gov>
Page 22: “Estimated Average 2023 Monthly Social Security Benefits … Retired worker with only an aged spouse: $2,972”
CALCULATION: $2,972/month × 12 months/year = $35,664/year
[99] Dataset: “Poverty Thresholds for 2022 by Size of Family and Number of Related Children Under 18 Years.” United States Census Bureau. Accessed August 22, 2023 at <www2.census.gov>
“Size of family unit … Two people … Householder 65 years and over [=] $17,689”
[100] Report: “Social Security Replacement Rates and Other Benefit Measures: An In-Depth Analysis.” By Marina Miller. Congressional Budget Office, April 16, 2019. <www.cbo.gov>
Page 1:
In this report, the Congressional Budget Office examines whether Social Security benefits enable retired workers to meet their basic needs and the extent to which benefits replace preretirement earnings. Focusing on workers with long careers, who generally have higher average earnings than all workers, CBO [Congressional Budget Office] finds that those benefits enable most of those workers to cover their essential living expenses as measured by the official federal poverty threshold. However, the extent to which benefits replace preretirement earnings varies substantially, depending on the way benefits and earnings are measured.
Page 3:
In addition, CBO focused primarily on workers with significant attachment to the labor force. Referred to in this report as long-career workers, they are defined as having at least 20 years of significant earnings—that is, earnings above 10 percent of the average wage index (AWI) in each year.5 (For example, 10 percent of the AWI in 2017, about $5,000, is comparable to working full time for about a third of the year while earning the federal minimum wage.) Including workers with shorter careers in the computation of individual retired-worker replacement rates would make the analysis less meaningful because those workers often receive spousal or survivor’s benefits that are significantly higher than benefits that are based on their own work record.
Page 6:
Second, CBO’s analysis incorporated the assumption that workers and their spouses both claim benefits at age 65, which generally results in slightly higher estimates of annual benefits than the actual benefits received because more than half of eligible people claim before or at age 65. Social Security benefits are reduced if claimed before the full retirement age (FRA) and increased if claimed afterward. By CBO’s estimate, individual first-year benefits at the projected age of claiming are about 5 percent lower, on average and across cohorts, than hypothetical benefits claimed at age 65. (The projected age for claiming benefits is the age at which CBO’s long-term model projects a future beneficiary would first claim benefits on the basis of his or her work history and other individual characteristics.)
Page 10:
Holding the age at which benefits are claimed fixed at 65 enables an easier comparison among different cohorts of retirees by taking out the effect of changes in average claiming patterns over time. Although that hypothetical benefit measure does not account for variation in the observed or projected timing of retirement, it provides a simple approximation of retired-worker benefits that are projected to be received in the first year of claiming.
[101] Report: “Social Security Replacement Rates and Other Benefit Measures: An In-Depth Analysis.” By Marina Miller. Congressional Budget Office, April 16, 2019. <www.cbo.gov>
Page 1:
Focusing on workers with long careers, who generally have higher average earnings than all workers, CBO [Congressional Budget Office] finds that those benefits enable most of those workers to cover their essential living expenses as measured by the official federal poverty threshold. …
Retired-worker benefits for most long-career workers born in the 1940s exceed the official federal poverty threshold. For workers born in the 1960s and 1980s, even more are projected to have retired-worker benefits above that threshold.
Pages 5–6:
Comparing individual retired-worker benefits with poverty thresholds demonstrates that the majority of long-career workers have initial retired-worker benefits that exceed those thresholds. When the analysis is expanded to include household benefits, an even larger fraction of workers is projected to have initial benefits above the poverty thresholds. Those findings suggest that Social Security benefits generally enable the vast majority of long-career workers to meet their basic needs, as measured in relation to poverty thresholds, in retirement.
Page 10:
Exhibits 1 through 3 evaluate the extent to which initial (single-year) Social Security benefits, if claimed at age 65, enable beneficiaries to meet their basic living needs in retirement. For those exhibits, CBO used 100 percent of the official federal poverty threshold as the minimum dollar amount needed to meet basic living needs. In 2018, for example, that amount was $12,043 for a single person age 65 or older; for two people, it was $15,178.
Page 11:
About 15 percent of long-career workers born in the 1940s receive initial retired-worker benefits that are insufficient to meet basic living needs as measured by the official federal poverty threshold. (Initial benefits are defined as benefits received at age 65, if first claimed at that age.) For workers whose initial benefits are below the poverty threshold, the average shortfall is about one-sixth of the threshold amount. Because scheduled benefits for subsequent cohorts grow with average wages, but the poverty thresholds generally grow more slowly—with prices—the fraction of retired workers whose initial scheduled benefits are projected to be below the poverty threshold is smaller for later cohorts, falling to 6 percent for the 1980s cohort.
Page 12:
Expanding the measure of benefits for an individual worker to include any spousal or survivor’s benefit that the worker is eligible to receive reduces the percentage of workers with initial benefits below the poverty threshold. Moving from that measure to a household-level measure, which also includes all benefits available to the worker’s spouse, provides a more comprehensive perspective on benefits and results in a greater reduction in the percentage of workers with initial benefits below the poverty threshold.
[102] Report: “Social Security Replacement Rates and Other Benefit Measures: An In-Depth Analysis.” By Marina Miller. Congressional Budget Office, April 16, 2019. <www.cbo.gov>
Page 1:
Replacement rates that compare benefits with earnings just before retirement show that, across cohorts, benefits replace about two-fifths of substantial late-career earnings, falling short of providing income continuity as workers transition out of the labor force. (Substantial earnings are annual earnings that are at least half of the worker’s average indexed earnings.)
Replacement rates that are designed to capture overall changes in the standard of living between working years and retirement show that Social Security benefits replace a significantly higher percentage of average earnings over a lifetime, adjusted for changes in prices over time.
Page 6:
Social Security replacement rates vary substantially depending on how they are measured. On the one hand, replacement rates designed to compare benefits with earnings just before retirement—that is, late-career replacement rates—show that benefits alone are generally insufficient to maintain workers’ preretirement income as they leave the labor force. For example, for workers born in the 1960s, median late-career replacement rates that are based on substantial earnings (adjusted for changes in prices over time) in the last five years before the workers reach age 62 amount to less than 40 percent. (Substantial earnings are annual earnings that are at least half of the worker’s average indexed earnings—that is, earnings over a person’s lifetime, adjusted for changes in average wages over time.)
On the other hand, replacement rates that focus on the overall changes in the standard of living between all working years and retirement show that Social Security benefits replace a significantly higher percentage of average earnings over a lifetime, adjusted for changes in prices over time. For workers born in the 1960s, the median replacement rate based on all earnings from age 22 through age 61, including years with no or very low earnings, is 55 percent.
[103] Report: “Social Security Replacement Rates and Other Benefit Measures: An In-Depth Analysis.” By Marina Miller. Congressional Budget Office, April 16, 2019. <www.cbo.gov>
Page 1:
If future benefits are limited to the annual revenues credited to Social Security once the program’s combined trust funds are exhausted, which is projected to occur in 2031—that is, payable benefits—the fraction of workers with initial benefits below the poverty threshold is projected to increase slightly between the 1940s cohort and the 1960s cohort, and then to increase substantially more for the 1980s cohort. Replacement rates based on payable benefits would be significantly lower than the replacement rates based on scheduled, or full, benefits.
Page 8:
CBO’s [Congressional Budget Office’s] findings depend critically on its projections of key economic, demographic, and behavioral factors, and all such long-term projections are inherently uncertain. The main demographic factors that affect the results are projections of mortality and fertility. (Projections of mortality affect the number of years that beneficiaries receive benefits. Projections of fertility affect both gross earnings and federal income taxes.) The main economic factors are labor force participation and the growth rate of productivity, which influence earnings trajectories as well as projected benefits. (The labor force participation rate is the percentage of people in the civilian noninstitutionalized population who are age 16 or older and either working or actively seeking work. The growth rate of productivity is calculated as the growth of total factor productivity, which is the growth of real output that is not explained by growth in labor or capital.) The behavioral factors that can affect the results include changes in household formation and dissolution, as well as changes in the average age for claiming Social Security benefits. Finally, the projections in this report are uncertain because of the inherent methodological challenges associated with projecting outcomes far into the future.
Page 11:
Exhibit 1. Percentage of Long-Career Workers With Initial Individual Benefits Below the Poverty Threshold … Both Sexes … Payable Benefits … 1940s Birth Cohort [=] 15% … 1960s Birth Cohort [=] 18% … 1980s Birth Cohort [=] 29% …
Initial individual benefits are based on the assumption that workers first claim benefits at age 65. Benefits are computed for all people who are eligible to claim retirement benefits at age 62 and who are not receiving any benefit at age 61. All benefit amounts are before taxes.
Scheduled benefits are benefits as calculated under the Social Security Act, regardless of the balances in the trust funds. Payable benefits are benefits as calculated under the act, reduced as necessary to ensure that outlays do not exceed the Social Security system’s revenues once the balances in the combined trust funds are exhausted, which is projected to occur in 2031.
Long-career workers are workers with 20 or more years of earnings above 10 percent of the average wage index in each year. To limit the focus to individuals with significant attachment to the labor force, workers with fewer than 20 years of earnings are excluded. In addition, workers who receive Disability Insurance benefits are excluded.
The federal poverty threshold used here is the threshold for one person age 65 or older, adjusted for growth in prices over time. …
Because scheduled benefits for subsequent cohorts grow with average wages, but the poverty thresholds generally grow more slowly—with prices—the fraction of retired workers whose initial scheduled benefits are projected to be below the poverty threshold is smaller for later cohorts, falling to 6 percent for the 1980s cohort. However, with payable benefits, that fraction increases to 29 percent for the 1980s cohort, indicating that the reduction in benefits following the projected depletion of the Social Security trust funds would prevent an additional 23 percent of workers in that cohort from meeting their basic needs using benefits alone. (The combined Social Security trust funds are projected to be depleted in 2031.)
Page 18:
For the 1960s and 1980s cohorts, replacement rates based on payable benefits are lower than those based on scheduled benefits. …
Exhibit 5. Median Replacement Rates for Long-Career Workers, Using Initial Individual Benefits and Two Different Measures of Earnings … All Earnings from Age 22 Through Age 61, Including Years With No or Very Low Earnings … 1940s … Scheduled Benefits [=] 59% … Payable Benefits [=] 59% … 1960s … Scheduled Benefits [=] 55% … Payable Benefits [=] 52% … 1980s … Scheduled Benefits [=] 60% … Payable Benefits [=] 43%
[104] Report: “Income of the Population 55 or Older, 2014.” Social Security Administration, April 2016. <www.ssa.gov>
Page 288:
|
Table 9.A2 Percentage Distribution of Beneficiary Units, by Marital Status and Age, 2014 |
||
|
Proportion of Income |
65 or Older |
|
|
Married Couples |
Nonmarried Persons |
|
|
50 or More |
47.8 |
70.7 |
|
90 or More |
20.7 |
42.6 |
[105] Press release: “Fact Sheet: Social Security.” U.S. Social Security Administration, June 2020. <www.justfacts.com>
Page 1:
Social Security Is the Major Source of Income for Most of the Elderly.
• Nearly nine out of ten individuals age 65 and older receive Social Security benefits.
• Social Security benefits represent about 33% of the income of the elderly.
• Among elderly Social Security beneficiaries, 50% of married couples and 70% of unmarried persons receive 50% or more of their income from Social Security.
• Among elderly Social Security beneficiaries, 21% of married couples and about 45% of unmarried persons rely on Social Security for 90% or more of their income.
[106] Working paper: “Improving the Measurement of Retirement Income of the Aged Population.” By Irena Dushi and Brad Trenkamp. Social Security Administration, January 2021. <www.ssa.gov>
Page 18:
|
Table 5. Percentages of Individuals Aged 65 or Older for Whom Social Security Represents a Selected Proportion of Family Income, by Sex: Measurements From Four Alternative Data Files, 2015 |
||
|
Social Security as a Proportion of Family Income |
Survey Data Matched with Administrative Records a |
|
|
Men |
Women |
|
|
50% or More |
37.3 |
42.0 |
|
90% or More |
12.1 |
15.1 |
|
SOURCE: Authors’ calculations based on HRS (wave 13, 2016), 2016 CPS ASEC [Current Population Survey, Annual Social and Economic Supplement], and administrative data from SSA [Social Security Administration] and IRS. Income questions ask respondent about income received in the previous calendar year (2015). |
||
[107] Press release: “Fact Sheet: Social Security.” U.S. Social Security Administration, August 10, 2023. <www.ssa.gov>
Page 1:
Social Security Is the Major Source of Income for Most of the Elderly.
• Nearly nine out of ten people age 65 and older were receiving a Social Security benefit as of June 30, 2023.
• Social Security benefits represent about 30% of the income of the elderly. *
• Among elderly Social Security beneficiaries, 37% of men and 42% of women receive 50% or more of their income from Social Security. *
• Among elderly Social Security beneficiaries, 12% of men and 15% of women rely on Social Security for 90% or more of their income. *
* This information is from research released in 2021 using 2015 data. See this link for more information.
[108] Pamphlet: “Understanding the Benefits.” United States Social Security Administration, January 2023. <www.ssa.gov>
Pages 11–12:
Benefits for Your Family
When you start receiving Social Security retirement or disability benefits, other family members may also be eligible to receive benefits. For example, benefits can be paid to your spouse:
• If they’re age 62 or older.
• At any age if they’re caring for your child (the child must be younger than 16 or have a disability and entitled to Social Security benefits on your record).
Benefits can also be paid to your unmarried children if they’re:
• Younger than 18.
• Between 18 and 19 years old, but in elementary or secondary school as full-time students.
• Age 18 or older and have a qualifying disability (the disability must have started before age 22).
Under certain circumstances, we can also pay benefits to a stepchild, grandchild, step-grandchild, or an adopted child. If you become the parent of a child after you begin receiving benefits, let us know about the child, so we can decide if the child is eligible for benefits.
How Much Can Family Members Get?
Each family member may be eligible for a monthly benefit that is up to half of your Social Security retirement or disability benefit amount. However, there is a limit to the total amount of money that can be paid to you and your family. The limit varies but is generally equal to about 150% to 180% of your retirement or disability benefit.
[109] Pamphlet: “Understanding the Benefits.” United States Social Security Administration, January 2023. <www.ssa.gov>
Pages 12–13:
Survivors Benefits
When you die, your family may be eligible for benefits based on your work.
Family members who can collect benefits include a surviving spouse who is:
• 60 or older.
• 50 or older and has a qualifying disability.
• Any age if they care for your child who is younger than 16 or has a qualifying disability and is entitled to Social Security benefits on your record.
Your children can receive benefits, too, if they’re unmarried and:
• Younger than 18 years old.
• Between 18 and 19 years old, but in an elementary or secondary school as full-time students.
• Age 18 or older and has a qualifying disability (the disability must have started before age 22).
Additionally, your parents can receive benefits on your earnings if they were dependent on you for at least half of their support.
One-Time Payment After Death
If you have enough credits, a one-time payment of $255 also may be made after your death. This benefit may be paid to your spouse or minor children if they meet certain requirements.
If You Are Divorced and Have a Surviving Ex-Spouse
If you’re divorced, your ex-spouse may be eligible for survivor’s benefits based on your earnings when you die. They must:
• Be at least age 60 years old (or 50 if they have a qualifying disability) and have been married to you for at least 10 years.
• Be at any age if they care for a child who is eligible for benefits based on your earnings.
• Not be entitled to a benefit based on their own work that is equal or higher than the full insurance amount on your record.
• Not be currently married, unless the remarriage occurred after age 60 or after age 50 if they have a qualifying disability.
Benefits paid to an ex-spouse won’t affect the benefit rates for other survivors receiving benefits on your earnings record.
NOTE: If you’re deceased and your ex-spouse remarries after age 60, they may be eligible for Social Security benefits based on either your work or the new spouse’s work, whichever is higher.
[110] Pamphlet: “Understanding the Benefits.” United States Social Security Administration, January 2023. <www.ssa.gov>
Page 14:
How Much Will Your Survivors Get?
Your survivors receive a percentage of your basic Social Security benefit—usually in a range from 75% to 100% each. However, there is a limit to the amount of money that can be paid each month to a family. The limit varies but is generally equal to about 150% to 180% of your benefit rate.
[111] Pamphlet: “Disability Benefits.” United States Social Security Administration, August 2022. <www.ssa.gov>
Page 2:
How Do I Meet the Earnings Requirement for Disability Benefits?
In general, to get disability benefits, you must meet two different earnings tests:
1. A recent work test, based on your age at the time you developed a disability.
2. A duration of work test to show that you worked long enough under Social Security.
Certain workers who are blind have to meet only the duration of work test.
The following table shows the rules for how much work you need for the recent work test, based on your age when you developed a disability. We base the rules in this table on the calendar quarter in which you turned or will turn a certain age. …
|
If You Develop a Disability… |
Then You Generally Need: |
|
In or before the quarter you turn age 24 |
1.5 years of work during the three-year period ending with the quarter you developed a disability. |
|
In the quarter after you turn age 24 but before the quarter you turn age 31 |
Work during half the time for the period beginning with the quarter after you turned 21 and ending with the quarter you developed a disability. Example: If you developed a disability in the quarter you turned age 27, then you would need three years of work out of the six-year period ending with the quarter you developed a disability. |
|
In the quarter you turn age 31 or later |
Work during five years out of the 10-year period ending with the quarter you developed a disability. |
Page 3:
NOTE: You must have a minimum of six quarters of coverage to meet the duration requirement. This minimum requirement is also applicable for those who have not yet attained age 22 and may apply for disability based on their own earnings.
NOTE: This table is an estimate only and does not cover all situations.
|
If You Develop a Disability… |
Then You Generally Need: |
|
Before age 28 |
1.5 years of work |
|
Age 30 |
2 years |
|
Age 34 |
3 years |
|
Age 38 |
4 years |
|
Age 42 |
5 years |
|
Age 44 |
5.5 years |
|
Age 46 |
6 years |
|
Age 48 |
6.5 years |
|
Age 50 |
7 years |
|
Age 52 |
7.5 years |
|
Age 54 |
8 years |
|
Age 56 |
8.5 years |
|
Age 58 |
9 years |
|
Age 60 |
9.5 years |
[112] “Annual Statistical Report on the Social Security Disability Insurance Program, 2021.” U.S. Social Security Administration, Office of Retirement and Disability Policy, Office of Research, Evaluation, and Statistics, October 2022. <www.ssa.gov>
Page 2:
Section 223(d)(1) of the Social Security Act defines disability as an—
(A) inability to engage in any substantial gainful activity by reason of any medically determinable physical or mental impairment which can be expected to result in death or which has lasted or can be expected to last for a continuous period of not less than 12 months, or
(B) in the case of an individual who has attained the age of 55 and is blind (within the meaning of blindness as defined in section 216(i)(1)), inability by reason of such blindness to engage in substantial gainful activity requiring skills or abilities comparable to those of any gainful activity in which the individual has previously engaged with some regularity and over a substantial period of time.
In most cases, a dollar amount is used to indicate whether a person is engaging in substantial gainful activity (SGA). For 2021, the SGA amount was $1,310 per month for a nonblind individual and $2,190 per month for a blind person. Effective January 2001, the SGA level is adjusted annually on the basis of the national average wage index.
[113] Pamphlet: “Disability Benefits.” United States Social Security Administration, August 2022. <www.ssa.gov>
Page 9: “What happens when my claim is approved? We’ll send a letter to you telling you your application is approved, the amount of your monthly benefit, and the effective date. Your monthly disability benefit is based on your average lifetime earnings. Generally, there is a five-month waiting period and we’ll pay your first benefit the sixth full month after the date we find your disability began.”
[114] Pamphlet: “Disability Benefits.” United States Social Security Administration, August 2022. <www.ssa.gov>
Page 9: “What happens when my claim is approved? … Your monthly disability benefit is based on your average lifetime earnings.”
NOTES:
[115] Webpage: “Cost of Living Adjustments.” United States Social Security Administration. Accessed August 22, 2023 at <www.ssa.gov>
Since 1975, Social Security general benefit increases have been cost-of-living adjustments or COLAs. The 1975–82 COLAs were effective with Social Security benefits payable for June in each of those years; thereafter COLAs have been effective with benefits payable for December.
Prior to 1975, Social Security benefit increases were set by legislation. …
|
Year |
COLA |
Year |
COLA |
Year |
COLA |
||
|
1975 |
8.0% |
1991 |
3.7% |
2007 |
2.3% |
||
|
1976 |
6.4% |
1992 |
3.0% |
2008 |
5.8% |
||
|
1977 |
5.9% |
1993 |
2.6% |
2009 |
0.0% |
||
|
1978 |
6.5% |
1994 |
2.8% |
2010 |
0.0% |
||
|
1979 |
9.9% |
1995 |
2.6% |
2011 |
3.6% |
||
|
1980 |
14.3% |
1996 |
2.9% |
2012 |
1.7% |
||
|
1981 |
11.2% |
1997 |
2.1% |
2013 |
1.5% |
||
|
1982 |
7.4% |
1998 |
1.3% |
2014 |
1.7% |
||
|
1983 |
3.5% |
1999 a |
2.5% |
2015 |
0.0% |
||
|
1984 |
3.5% |
2000 |
3.5% |
2016 |
0.3% |
||
|
1985 |
3.1% |
2001 |
2.6% |
2017 |
2.0% |
||
|
1986 |
1.3% |
2002 |
1.4% |
2018 |
2.8% |
||
|
1987 |
4.2% |
2003 |
2.1% |
2019 |
1.6% |
||
|
1988 |
4.0% |
2004 |
2.7% |
2020 |
1.3% |
||
|
1989 |
4.7% |
2005 |
4.1% |
2021 |
5.9% |
||
|
1990 |
5.4% |
2006 |
3.3% |
2022 |
8.7% |
||
|
a The COLA for December 1999 was originally determined as 2.4 percent based on CPIs [Consumer Price Index] published by the Bureau of Labor Statistics. Pursuant to Public Law 106-554, however, this COLA is effectively now 2.5 percent. |
|||||||
The first COLA, for June 1975, was based on the increase in the Consumer Price Index for Urban Wage Earners and Clerical Workers (CPI-W) from the second quarter of 1974 to the first quarter of 1975. The 1976–83 COLAs were based on increases in the CPI-W from the first quarter of the prior year to the corresponding quarter of the current year in which the COLA became effective. After 1983, COLAs have been based on increases in the CPI-W from the third quarter of the prior year to the corresponding quarter of the current year in which the COLA became effective.
[116] Pamphlet: “Understanding the Benefits.” United States Social Security Administration, January 2023. <www.ssa.gov>
Page 11:
Benefits for Your Family
When you start receiving Social Security retirement or disability benefits, other family members may also be eligible to receive benefits. For example, benefits can be paid to your spouse:
• If they’re age 62 or older.
• At any age if they’re caring for your child (the child must be younger than 16 or have a disability and entitled to Social Security benefits on your record).
Benefits can also be paid to your unmarried children if they’re:
• Younger than 18.
• Between 18 and 19 years old, but in elementary or secondary school as full-time students.
• Age 18 or older and have a qualifying disability (the disability must have started before age 22).
Under certain circumstances, we can also pay benefits to a stepchild, grandchild, step-grandchild, or an adopted child. If you become the parent of a child after you begin receiving benefits, let us know about the child, so we can decide if the child is eligible for benefits.
How Much Can Family Members Get?
Each family member may be eligible for a monthly benefit that is up to half of your Social Security retirement or disability benefit amount. However, there is a limit to the total amount of money that can be paid to you and your family. The limit varies, but is generally equal to about 150% to 180% of your retirement or disability benefit.
[117] “Annual Statistical Report on the Social Security Disability Insurance Program, 2021.” U.S. Social Security Administration, Office of Retirement and Disability Policy, Office of Research, Evaluation, and Statistics, October 2022. <www.ssa.gov>
Page 22: “Table 4. Number and average monthly benefit, by sex and age, December 2021 … Total [=] 9,243,999”
[118] “Annual Statistical Report on the Social Security Disability Insurance Program, 2021.” U.S. Social Security Administration, Office of Retirement and Disability Policy, Office of Research, Evaluation, and Statistics, October 2022. <www.ssa.gov>
Page 13: “Disabled beneficiaries aged 18–64 in current-payment status accounted for 4.1 percent of the population aged 18–64 in the United States. In five states and the District of Columbia, they represented less than 3 percent of the state (or district) population. The states with the highest rates of disabled beneficiaries—7 percent or more—were Alabama, Arkansas, Kentucky, Mississippi, and West Virginia.”
[119] “Annual Statistical Report on the Social Security Disability Insurance Program, 2021.” U.S. Social Security Administration, Office of Retirement and Disability Policy, Office of Research, Evaluation, and Statistics, October 2022. <www.ssa.gov>
Page 11: “In December 2021, there were 9,243,999 people receiving Social Security disability benefits as disabled workers, disabled widow(er)s, or disabled adult children. The majority (85.2 percent) were disabled workers, 12.4 percent were disabled adult children, and 2.4 percent were disabled widow(er)s.”
[120] “Annual Statistical Report on the Social Security Disability Insurance Program, 2021.” U.S. Social Security Administration, Office of Retirement and Disability Policy, Office of Research, Evaluation, and Statistics, October 2022. <www.ssa.gov>
Page 22: “Table 4. Number and average monthly benefit, by sex and age, December 2021 … Total [=] 9,243,999 … Subtotal … Men [=] 4,619,570 … Women [=] 4,624,429”
CALCULATIONS:
[121] “Annual Statistical Report on the Social Security Disability Insurance Program, 2021.” U.S. Social Security Administration, Office of Retirement and Disability Policy, Office of Research, Evaluation, and Statistics, October 2022. <www.ssa.gov>
Page 2 (of PDF): “Profile of Disabled-Worker Beneficiaries … Average age was 55.”
[122] Calculated with data from the “Annual Statistical Report on the Social Security Disability Insurance Program, 2021.” U.S. Social Security Administration, Office of Retirement and Disability Policy, Office of Research, Evaluation, and Statistics, October 2022. <www.ssa.gov>
Page 25: “Table 6. Distribution, by Sex and Diagnostic Group, December 2021”
NOTE: An Excel file containing the data and calculations is available upon request.
[123] Calculated with data from the “2023 Annual Report of the Board of Trustees of the Federal Old-Age and Survivors Insurance and Disability Insurance Trust Funds.” United States Social Security Administration, March 28, 2023. <www.ssa.gov>
Page 38:
Table III.A5.—Distribution of Benefit Paymentsa by Type of Beneficiary or Payment, Calendar Years 2021 and 2022 (Amounts in millions) … Calendar year 2022 … Total OASDI [Social Security] benefit payments [=] $1,231,646 … Retired workers and auxiliaries [=] $947,071 … Survivors of deceased workers [=] $140,870 … Lump-sum death payments [=] $229 … DI [disability insurance] benefit payments, total [=] $143,475
CALCULATIONS:
[124] Webpage: “Finding Value—and My Social Security—in Light of Budget Cuts.” By Doug Walker. U.S. Social Security Administration, January 9, 2017. Last updated 1/14/2021. <blog.ssa.gov>
“Today, we are taking another cost-saving step. We will mail fewer paper Social Security Statements. Paper Statements will only be sent to people age 60 and over, who are not getting benefits and don’t have a my Social Security account. This will bring down the costs of processing and mailing paper Statements by $11.3 million in FY 2017.”
[125] “2010 Annual Report of the Board of Trustees of the Federal Old-Age and Survivors Insurance and Disability Insurance Trust Funds.” United States Social Security Administration, August 9, 2010. <www.ssa.gov>
Page 138:
The Federal Old-Age and Survivors Insurance (OASI) Trust Fund was established on January 1, 1940 as a separate account in the United States Treasury. The Federal Disability Insurance (DI) Trust Fund, another separate account in the United States Treasury, was established on August 1, 1956. All the financial operations of the OASI and DI programs are handled through these respective funds.
[126] “2023 Annual Report of the Board of Trustees of the Federal Old-Age and Survivors Insurance and Disability Insurance Trust Funds.” United States Social Security Administration, March 28, 2023. <www.ssa.gov>
Page 161: “The Social Security Act prohibits payments from the OASI [Old-Age & Survivors Insurance] and DI [Disability Insurance] Trust Funds for any purpose not related to the payment of benefits or administrative costs for the OASDI [Social Security] program.”
[127] Dataset: “Old-Age, Survivors, and Disability Insurance Trust Funds Cost, 1957–2022.” United States Social Security Administration, Office of the Chief Actuary. Accessed August 24, 2023 at <www.ssa.gov>
“Total Cost … Benefit paymentsa b … Administrative expenses … Transfers to Railroad Retirement program”
[128] “2023 Annual Report of the Board of Trustees of the Federal Old-Age and Survivors Insurance and Disability Insurance Trust Funds.” United States Social Security Administration, March 28, 2023. <www.ssa.gov>
Page 31:
The Railroad Retirement Act requires an annual financial interchange between the Railroad Retirement program and the OASDI [Social Security] program. The purpose of the interchange is to put the OASI [Old-Age & Survivors Insurance] and DI [Disability Insurance] Trust Funds in the same financial position in which they would have been had railroad employment always been covered directly by Social Security. The Railroad Retirement Board and the Social Security Administration calculated an interchange of $5.3 billion from the OASI Trust Fund to the Social Security Equivalent Benefit Account for June 2022.
Page 161: “The Social Security Act prohibits payments from the OASI and DI Trust Funds for any purpose not related to the payment of benefits or administrative costs for the OASDI program.”
[129] Dataset: “Old-Age, Survivors, and Disability Insurance Trust Funds Income, 1957–2022.” United States Social Security Administration, Office of the Chief Actuary. Accessed August 24, 2023 at <www.ssa.gov>
“Total income … Net payroll tax contributions … Income from taxation of benefits … General Fund Transfers a … Net interest b”
[130] Public Law 111-312: “Tax Relief, Unemployment Insurance Reauthorization, and Job Creation Act of 2010.” 111th U.S. Congress. Signed into law by Barack Obama on December 17, 2010. <www.gpo.gov>
Title VI, Section 601:
Temporary Employee Payroll Tax Cut.
(a) In General.—Notwithstanding any other provision of law—
(1) with respect to any taxable year which begins in the payroll tax holiday period, the rate of tax under section 1401(a) of the Internal Revenue Code of 1986 shall be 10.40 percent, and
(2) with respect to remuneration received during the payroll tax holiday period, the rate of tax under 3101(a) of such Code shall be 4.2 percent (including for purposes of determining the applicable percentage under sections 3201(a) and 3211(a)(1) of such Code). …
(c) Payroll Tax Holiday Period.—The term “payroll tax holiday period” means calendar year 2011. …
(e) Transfers of Funds.—
(1) Transfers To Federal Old-Age And Survivors Insurance Trust Fund.—There are hereby appropriated to the Federal Old-Age and Survivors Trust Fund and the Federal Disability Insurance Trust Fund established under section 201 of the Social Security Act (42 U.S.C. 401) amounts equal to the reduction in revenues to the Treasury by reason of the application of subsection (a). Amounts appropriated by the preceding sentence shall be transferred from the general fund at such times and in such manner as to replicate to the extent possible the transfers which would have occurred to such Trust Fund had such amendments not been enacted.
[131] Public Law 112-078: “Temporary Payroll Tax Cut Continuation Act of 2011.” 111th U.S. Congress. Signed into law by Barack Obama on December 23, 2011. <www.gpo.gov>
Sec. 101. Extension of Payroll Tax Holiday.
(a) In General.—Subsection (c) of section 601 of the Tax Relief, Unemployment Insurance Reauthorization, and Job Creation Act of 2010 (26 U.S.C. 1401 note) is amended to read as follows:
“(c) Payroll Tax Holiday Period.—The term ‘payroll tax holiday period’ means—
“(1) in the case of the tax described in subsection (a)(1), calendar years 2011 and 2012, and
“(2) in the case of the taxes described in subsection (a)(2), the period beginning January 1, 2011, and ending February 29, 2012.”.
[132] Public Law 112-96: “Middle Class Tax Relief and Job Creation Act of 2012.” 112th U.S. Congress. Signed into law by Barack Obama on February 22, 2012. <www.gpo.gov>
Sec. 1001. Extension of Payroll Tax Reduction.
(a) In General.—Subsection (c) of section 601 of the Tax Relief, Unemployment Insurance Reauthorization, and Job Creation Act of 2010 (26 U.S.C. 1401 note) is amended to read as follows:
“(c) Payroll Tax Holiday Period.—The term ‘payroll tax holiday period’ means calendar years 2011 and 2012.”
[133] “2023 Annual Report of the Board of Trustees of the Federal Old-Age and Survivors Insurance and Disability Insurance Trust Funds.” United States Social Security Administration, March 28, 2023. <www.ssa.gov>
Page 7: “Table II.B1.—Summary of 2022 Trust Fund Financial Operations (In billions). … OASDI [Social Security] … Total income in 2022 a [=] 1,221.8 … Total cost in 2022 [=] 1,243.9 … a Includes $0.2 billion in reimbursements from the General Fund of the Treasury and less than $50 million in gifts.”
[134] Webpage: “Trust Fund FAQs.” United States Social Security Administration. Accessed August 24, 2023 at <www.ssa.gov>
How Are the Trust Funds Invested?
By law, income to the trust funds must be invested, on a daily basis, in securities guaranteed as to both principal and interest by the Federal government. All securities held by the trust funds are “special issues” of the United States Treasury. Such securities are available only to the trust funds.
[135] Webpage: “Debt Versus Deficit: What’s the Difference?” United States Department of the Treasury, Bureau of the Fiscal Service, August 5, 2004. <treasurydirect.gov>
“Additionally, the Government Trust Funds are required by law to invest accumulated surpluses in Treasury securities. The Treasury securities issued to the public and to the Government Trust Funds (intragovernmental holdings) then become part of the total debt.”
[136] United States Code Title 42, Chapter 7, Subchapter II, Section 401: “Social Security, Federal Old-Age, Survivors, and Disability Insurance Benefits, Trust Funds.” Accessed August 24, 2023 at <www.law.cornell.edu>
“It shall be the duty of the Managing Trustee to invest such portion of the Trust Funds as is not, in his judgment, required to meet current withdrawals. Such investments may be made only in interest-bearing obligations of the United States or in obligations guaranteed as to both principal and interest by the United States.”
[137] United States Code Title 31, Subtitle III, Chapter 31, Subchapter II, Section 3123: “Payment of Obligations and Interest on the Public Debt.” Accessed August 24, 2023 at <www4.law.cornell.edu>
“(a): The faith of the United States Government is pledged to pay, in legal tender, principal and interest on the obligations of the Government issued under this chapter.”
[138] “2023 Annual Report of the Board of Trustees of the Federal Old-Age and Survivors Insurance and Disability Insurance Trust Funds.” United States Social Security Administration, March 28, 2023. <www.ssa.gov>
Page 7: “Table II.B1.—Summary of 2022 Trust Fund Financial Operations (In billions). … OASDI [Social Security] … Asset reserves at the end of 2022 … 2,829.9”
[139] Calculated with data from:
a) Dataset: “Monthly Population Estimates for the United States: April 1, 2020 to December 1, 2023.” U.S. Census Bureau, Population Division, December 2022. <www2.census.gov>
“Resident Population … December 1, 2022 [=] 334,106,462”
b) Dataset: “Average Number of People per Household, by Race and Hispanic Origin1, Marital Status, Age, and Education of Householder: 2022.” U.S. Census Bureau, November 2022. <www2.census.gov>
“Total households (in thousands) [=] 131,202”
CALCULATIONS:
[140] Calculated with data from:
a) Dataset: “Old-Age and Survivors Insurance Trust Fund, 1937–2022.” United States Social Security Administration, Office of the Chief Actuary. Accessed August 15, 2023 at <www.ssa.gov>
b) Dataset: “Old-Age and Survivors Insurance Trust Fund Income, 1937–2022.” United States Social Security Administration, Office of the Chief Actuary. Accessed August 15, 2023 at <www.ssa.gov>
c) Dataset: “Disability Insurance Trust Fund, 1957–2022.” United States Social Security Administration, Office of the Chief Actuary. Accessed August 15, 2023 at <www.ssa.gov>
d) Dataset: “Disability Insurance Trust Fund Income, 1957–2022.” United States Social Security Administration, Office of the Chief Actuary. Accessed August 15, 2023 at <www.ssa.gov>
e) Dataset: “Table VI.G7. Operations of the Combined OASI and DI Trust Funds, in CPI-Indexed 2023 Dollars, Calendar Years 1970–2100.” United States Social Security Administration, Office of the Chief Actuary. Accessed August 15, 2023 at <www.ssa.gov>
NOTE: An Excel file containing the data and calculations is available upon request.
[141] “2023 Annual Report of the Board of Trustees of the Federal Old-Age and Survivors Insurance and Disability Insurance Trust Funds.” United States Social Security Administration, March 28, 2023. <www.ssa.gov>
Page 2: “Under the Trustees’ intermediate assumptions, Social Security’s total cost is projected to be higher than its total income in 2023 and all later years. Total cost began to be higher than total income in 2021. Social Security’s cost has exceeded its non-interest income since 2010.”
Page 13: “Annual OASDI [Social Security] cost has exceeded non-interest income every year beginning with 2010. Cost is projected to continue to exceed non-interest income throughout the 75-year valuation period.”
[142] Calculated with data from:
a) Dataset: “Old-Age and Survivors Insurance Trust Fund, 1937–2022.” United States Social Security Administration, Office of the Chief Actuary. Accessed August 15, 2023 at <www.ssa.gov>
b) Dataset: “Old-Age and Survivors Insurance Trust Fund Income, 1937–2022.” United States Social Security Administration, Office of the Chief Actuary. Accessed August 15, 2023 at <www.ssa.gov>
c) Dataset: “Disability Insurance Trust Fund, 1957–2022.” United States Social Security Administration, Office of the Chief Actuary. Accessed August 15, 2023 at <www.ssa.gov>
d) Dataset: “Disability Insurance Trust Fund Income, 1957–2022.” United States Social Security Administration, Office of the Chief Actuary. Accessed August 15, 2023 at <www.ssa.gov>
e) Dataset: “Table VI.G7. Operations of the Combined OASI and DI Trust Funds, in CPI-Indexed 2023 Dollars, Calendar Years 1970–2100.” United States Social Security Administration, Office of the Chief Actuary. Accessed August 15, 2023 at <www.ssa.gov>
f) Dataset: “CPI—All Urban Consumers (Current Series).” U.S. Department of Labor, Bureau of Labor Statistics. Accessed January 27, 2023 at <www.bls.gov>
“Series Id: CUUR0000SA0; Series Title: All Items in U.S. City Average, All Urban Consumers, Not Seasonally Adjusted; Area: U.S. City Average; Item: All Items; Base Period: 1982–84=100”
NOTE: An Excel file containing the data and calculations is available upon request.
[143] Calculated with data from:
a) Dataset: “Old-Age and Survivors Insurance Trust Fund, 1937–2016.” United States Social Security Administration, Office of the Chief Actuary. Accessed September 8, 2017 at <www.socialsecurity.gov>
b) Dataset: “Disability Insurance Trust Fund, 1957–2016.” United States Social Security Administration, Office of the Chief Actuary. Accessed September 8, 2017 at <www.socialsecurity.gov>
c) “CPI Detailed Report Data for December 2016.” U.S. Department of Labor, Bureau of Labor Statistics, January 24, 2017. <www.bls.gov>
“Table 24. Historical Consumer Price Index for All Urban Consumers (CPI-U): U.S. city average, all items (1982–84=100, unless otherwise noted)”
NOTES:
[144] “2023 Annual Report of the Board of Trustees of the Federal Old-Age and Survivors Insurance and Disability Insurance Trust Funds.” United States Social Security Administration, March 28, 2023. <www.ssa.gov>
Page 2: “Under the Trustees’ intermediate assumptions, Social Security’s total cost is projected to be higher than its total income in 2023 and all later years. Total cost began to be higher than total income in 2021. Social Security’s cost has exceeded its non-interest income since 2010.”
[145] Textbook: Cost Accounting: Principles And Practice. By Manash Dutta. Pearson Education, 2004.
Page 23.2: “Inflation accounting presents a true and correct view of the financial state of affairs of a firm, leads to the maintenance of physical capital and enables the business entity to make rational financial decisions.”
[146] Book: Quantitative Investing for the Global Markets: Strategies, Tactics, and Advanced Analytical Techniques. Edited by Peter Carman. Fitzroy Dearborn Publishers, 1997.
Pages 25–26: “World stock and bond markets can be expected to continue to grow, although not at the explosive pace of the past few decades. Some of the past growth has been due to rises in nominal asset prices that merely compensate for inflation; such rises are likely to be at lower rates in the future. But we should be concerned not with nominal quantities but with real [inflation-adjusted] ones.”
[147] Calculated with the dataset: “Table VI.F7. – Operations of the Combined OASI [Old-Age & Survivors Insurance] and DI [Disability Insurance] Trust Funds, in Constant 2010 Dollars, Calendar Years 2010–85 [in Billions].” United States Social Security Administration, Office of the Chief Actuary. Last reviewed or modified August 5, 2010. <www.ssa.gov>
NOTES:
[148] Calculated with data from:
a) Dataset: “Old-Age and Survivors Insurance Trust Fund, 1937–2022.” United States Social Security Administration, Office of the Chief Actuary. Accessed August 15, 2023 at <www.ssa.gov>
b) Dataset: “Disability Insurance Trust Fund, 1957–2022.” United States Social Security Administration, Office of the Chief Actuary. Accessed August 15, 2023 at <www.ssa.gov>
c) Dataset: “CPI—All Urban Consumers (Current Series).” U.S. Department of Labor, Bureau of Labor Statistics. Accessed January 27, 2023 at <www.bls.gov>
“Series Id: CUUR0000SA0; Series Title: All Items in U.S. City Average, All Urban Consumers, Not Seasonally Adjusted; Area: U.S. City Average; Item: All Items; Base Period: 1982–84=100”
NOTE: An Excel file containing the data and calculations is available upon request.
[149] “2023 Annual Report of the Board of Trustees of the Federal Old-Age and Survivors Insurance and Disability Insurance Trust Funds.” United States Social Security Administration, March 28, 2023. <www.ssa.gov>
Page 3: “Under the Trustees’ intermediate assumptions, OASDI cost is projected to exceed total income in 2023, and the dollar level of the hypothetical combined trust fund reserves declines until reserves become depleted in 2034.”
[150] Calculated with data from:
a) Dataset: “Old-Age and Survivors Insurance Trust Fund, 1937–2021.” United States Social Security Administration, Office of the Chief Actuary. Accessed July 4, 2022 at <www.ssa.gov>
b) Dataset: “Disability Insurance Trust Fund, 1957–2022.” United States Social Security Administration, Office of the Chief Actuary. Accessed August 15, 2023 at <www.ssa.gov>
c) Dataset: “CPI—All Urban Consumers (Current Series).” U.S. Department of Labor, Bureau of Labor Statistics. Accessed January 27, 2023 at <www.bls.gov>
“Series Id: CUUR0000SA0; Series Title: All Items in U.S. City Average, All Urban Consumers, Not Seasonally Adjusted; Area: U.S. City Average; Item: All Items; Base Period: 1982–84=100”
d) Dataset: “Table VI.G7. Operations of the Combined OASI and DI Trust Funds, in CPI-Indexed 2023 Dollars, Calendar Years 1970–2100.” United States Social Security Administration, Office of the Chief Actuary. Accessed August 15, 2023 at <www.ssa.gov>
“The combined OASI [Old Age and Survivors Insurance] and DI [Disability Insurance] Trust Funds become depleted in 2034 under the intermediate assumptions and in 2031 under the high-cost assumptions, so estimates for later years are not shown.”
NOTES:
[151] “2023 Annual Report of the Board of Trustees of the Federal Old-Age and Survivors Insurance and Disability Insurance Trust Funds.” United States Social Security Administration, March 28, 2023. <www.ssa.gov>
Page 14: “Figure II.D2.—OASDI Income, Cost, and Expenditures as Percentages of Taxable Payroll [Under intermediate assumptions]”
NOTE: The “Cost” curve in Figure II.D2 exceeds the “Expenditures” curve for all years starting in 2033. This graph ends in 2100. For the years beyond this, see the following excerpt from the same report.
Page 19: “Extending the horizon beyond 75 years increases the measured unfunded obligation. Through the infinite horizon, the unfunded obligation, or shortfall, is equivalent to 4.6 percent of future taxable payroll or 1.4 percent of future GDP [gross domestic product].”
[152] Calculated with the dataset: “Trust Fund Operations in Current Dollars, Intermediate Assumptions, 2023 Trustees Report.” United States Social Security Administration, Office of the Chief Actuary. Transmitted to Just Facts on August 25, 2023.
NOTE: An Excel file containing the data and calculations is available upon request.
[153] Calculated with the dataset: “Trust Fund Operations in Current Dollars, Intermediate Assumptions, 2023 Trustees Report.” United States Social Security Administration, Office of the Chief Actuary. Transmitted to Just Facts on August 25, 2023.
NOTE: An Excel file containing the data and calculations is available upon request.
[154] “2023 Annual Report of the Board of Trustees of the Federal Old-Age and Survivors Insurance and Disability Insurance Trust Funds.” United States Social Security Administration, March 28, 2023. <www.ssa.gov>
Page 73: “Consistent with practice since 1965, this report focuses on a 75-year open-group valuation to evaluate the long-range actuarial status of the OASDI program. The open-group valuation includes non-interest income and cost for past, current, and future participants through the year 2097.”
[155] Based upon reading dozens of articles and editorials by leading publications, Just Facts found that the press almost always cites the 75-year open group unfunded liability when discussing Social Security’s shortfalls, often without providing a substantive explanation of what it means or what the implications may be.
[156] “2023 Annual Report of the Board of Trustees of the Federal Old-Age and Survivors Insurance and Disability Insurance Trust Funds.” United States Social Security Administration, March 28, 2023. <www.ssa.gov>
Page 74:
This expected increase in the unfunded obligation occurs because: (1) the unfunded obligation is now discounted to January 1, 2023, rather than to January 1, 2022, which tends to increase the unfunded obligation by the annual nominal interest rate….
The present value of future cost less future non-interest income over the long-range period, minus the amount of trust fund asset reserves at the beginning of the projection period, is $22.4 trillion for the OASDI [Social Security] program. This amount is the 75-year ‘open-group unfunded obligation’….”
Page 256:
Unfunded Obligation. A measure of the shortfall of trust fund income to fully cover program cost through a specified date after depletion of trust fund asset reserves. This measure can be expressed in present value dollars, discounted to the beginning of the valuation period, by computing the excess of the present value of the projected cost of the program through a specified date over the sum of: (1) the value of trust fund reserves at the beginning of the valuation period; and (2) the present value of the projected non-interest income of the program through a specified date, assuming scheduled tax rates and benefit levels. This measure can apply for all participants through a specified date, i.e., the open group, or be limited to a specified subgroup of participants.
[157] Report: “Social Security and Medicare Trust Funds and the Federal Budget.” By James Duggan and Christopher Soares. U.S. Department of Treasury, Office of Economic Policy, May 2009. <home.treasury.gov>
Page 16:
Present values recognize that a dollar next year is worth less than a dollar today, because a dollar today could be saved and earn a year’s-worth of interest. To create a present value, future amounts are thus reduced using an assumed interest rate, and those reduced amounts are summed. The resulting present value is the amount that would have to be put in the bank today at the assumed interest rate to fund the future cash flows.
[158] Calculated with data from the footnotes above and the “2023 Annual Report of the Board of Trustees of the Federal Old-Age and Survivors Insurance and Disability Insurance Trust Funds.” United States Social Security Administration, March 28, 2023. <www.ssa.gov>
Page 7: “Table II.B1.—Summary of 2022 Trust Fund Financial Operations (In billions). … OASDI [Social Security] … Total income in 2022 a [=] 1,221.8”
CALCULATION: $22,400,000,000,000 75-year open group unfunded obligation / $1,221,800,000,000 income = 18.3
[159] Calculated with data from the footnotes above and the “2023 Annual Report of the Board of Trustees of the Federal Old-Age and Survivors Insurance and Disability Insurance Trust Funds.” United States Social Security Administration, March 28, 2023. <www.ssa.gov>
Pages 63–64: “Table IV.B3.—Covered Workers and Beneficiaries, Calendar Years 1945–2100 … Historical data: … Covered workersa (in thousands) … 2022 [=] 180,510 … a Workers who are paid at some time during the year for employment on which OASDI [Social Security] taxes are due.”
CALCULATION: $22,400,000,000,000 75-year open group unfunded obligation / 180,510,000 workers = $124,093/worker
[160] “2022 Financial Report of the United States Government.” U.S. Department of the Treasury, February 16, 2023. <www.fiscal.treasury.gov>
Page 12: “The FY [fiscal year] 2022 Financial Report provides the President, Congress, and the American people with a comprehensive view of the federal government’s financial position and condition, and discusses important financial issues and significant conditions that may affect future operations, including the need to achieve fiscal sustainability over the long term.”
Page 198:
The 75-year horizon is consistent with the primary focus of the Social Security and Medicare Trustees Reports. Experts have noted that limiting the projections to 75 years understates the magnitude of the long-range unfunded obligations because summary measures (such as the actuarial balance and open-group unfunded obligations) reflect the full amount of taxes paid by the next two or three generations of workers, but not the full amount of their benefits. …
The shorter [75-year] horizon understates the total financial needs by capturing relatively more of the revenues from current and future workers and not capturing all the benefits that are scheduled to be paid to them.
[161] “2010 Annual Report of the Board of Trustees of the Federal Old-Age and Survivors Insurance and Disability Insurance Trust Funds.” Board of Trustees of the Federal OASDI Trust Funds, August 9, 2010. <www.ssa.gov>
Page 65: “[The] closed group unfunded obligation … represents the shortfall of lifetime contributions for all past† and current participants relative to the cost of benefits for them.”
Page 209 [appendix]: “Closed group unfunded obligation. This measure is computed like the open group unfunded obligation except that individuals under the age of 15 (or not yet born) are excluded. In other words, only persons who attain age 15 or older during the first year of the projection period are included in the calculations.”
† NOTE: The past participants wash out of the calculations because all of their taxes and benefits have already been paid.
[162] “2009 Financial Report of the United States Government.” U.S. Department of the Treasury, 2009. <www.fiscal.treasury.gov>
Page 43:
The [social insurance] estimates are actuarial present values2 of the projections and are based on the economic and demographic assumptions representing the trustees’ best estimates as set forth in the relevant Social Security and Medicare trustees’ reports and in the relevant agency performance and accountability reports for the RRB [Railroad Retirement Board] and the DOL [Department of Labor] (Black Lung). …
2 Present values recognize that a dollar paid or collected in the future is worth less than a dollar today, because a dollar today could be invested and earn interest. To calculate a present value, future amounts are thus reduced using an assumed interest rate, and those reduced amounts are summed.
Page 52:
Participants for the Social Security and Medicare programs are assumed to be the “closed group” of individuals who are at least age 15 at the start of the projection period, and are participating as either taxpayers, beneficiaries, or both, except for the 2007 Medicare programs for which current participants are assumed to be at least 18 instead of 15 years of age.
Page 125:
Current participants in the Social Security and Medicare programs form the “closed group” of taxpayers and/or beneficiaries who are at least age 15 at the start of the projection period. For the 2007 Medicare projections, current participants are at least 18 years of age at the beginning of the projection period. Since the projection period for the Social Security, Medicare, and Railroad Retirement social insurance programs consists of 75 years, the period covers virtually all of the current participants’ working and retirement years, a period that could be greater than 75 years in a relatively small number of instances.
[163] Report: “Social Security and Medicare Trust Funds and the Federal Budget.” By James Duggan and Christopher Soares. U.S. Department of Treasury, Office of Economic Policy, May 2009. <home.treasury.gov>
Page 16: “The resulting present value is the amount that would have to be put in the bank today at the assumed interest rate to fund the future cash flows.”
[164] Report: “Enron: Selected Securities, Accounting, and Pension Laws Possibly Implicated in its Collapse.” By Michael V. Seitzinger, Marie B. Morris, and Mark Jickling. Congressional Research Service, Library of Congress, January 16, 2002. <digital.library.unt.edu>
Page 2 (of PDF):
Among the disclosures of publicly traded companies are accounting statements. Since financial information is of little use to investors unless all firms use comparable accounting methods, the securities laws give the Securities and Exchange Commission [SEC] broad authority to establish standards for financial reporting. The SEC has delegated the task of writing accounting standards to private sector bodies, and since 1973 the Financial Accounting Standards Board has been charged with formulating accounting and financial reporting standards.
[165] Summary of statement no. 106: “Employers’ Accounting for Postretirement Benefits Other Than Pensions.” Financial Accounting Standards Board, December 1990. <fasb.org>
This Statement establishes accounting standards for employers’ accounting for postretirement benefits other than pensions…. It will significantly change the prevalent current practice of accounting for postretirement benefits on a pay-as-you-go (cash) basis by requiring accrual, during the years that the employee renders the necessary service, of the expected cost of providing those benefits to an employee and the employee’s beneficiaries and covered dependents. …
The Board believes that measurement of the obligation and accrual of the cost based on best estimates are superior to implying, by a failure to accrue, that no obligation exists prior to the payment of benefits. The Board believes that failure to recognize an obligation prior to its payment impairs the usefulness and integrity of the employer’s financial statements. …
The provisions of this Statement are similar, in many respects, to those in FASB [Financial Accounting Standards Board] Statements No. 87, Employers’ Accounting for Pensions, and No. 88, Employers’ Accounting for Settlements and Curtailments of Defined Benefit Pension Plans and for Termination Benefits. …
This Statement relies on a basic premise of generally accepted accounting principles that accrual accounting provides more relevant and useful information than does cash basis accounting. …
[L]ike accounting for other deferred compensation agreements, accounting for postretirement benefits should reflect the explicit or implicit contract between the employer and its employees.
[166] Book: Finance for Managers. By Richard Luecke and Samuel L. Hayes. Harvard Business School Press, 2002.
Page 39:
In contrast to cash-basis accounting, accrual accounting records transactions as they are made, whether or not the cash has actually changed hands. Most companies of any size use accrual accounting. This system provides a better matching between revenues and their associated cost, which helps companies understand the true causes and effect of business activities. Accordingly, revenues are recognized during the period in which the sales activities occur, whereas expenses are recognized in the same period as their associated revenues.
[167] Textbook: Fiscal Challenges: An Interdisciplinary Approach to Budget Policy. Edited by Elizabeth Garrett, Elizabeth A. Graddy, and Howell E. Jackson. Cambridge University Press, 2009.
Chapter 6: “Counting the Ways: The Structure of Federal Spending.” By Howell E. Jackson. Pages 185–220.
Page 207: “The measure featured here is the ‘closed-group liability’ for each program. This measure reflects the financial burden or liability being passed on to future generations.”
[168] The following points provide important context for understanding the data and calculation in the next footnote:
[169] Calculated with data from the “2023 Annual Report of the Board of Trustees of the Federal Old-Age and Survivors Insurance and Disability Insurance Trust Funds.” United States Social Security Administration, March 28, 2023. <www.ssa.gov>
Page 7: “Table II.B1.—Summary of 2022 Trust Fund Financial Operations (In billions). … OASDI [Social Security] … Asset reserves at the end of 2022 … 2,829.9”
Page 211:
Table VI.F2.—Present Values Through the Infinite Horizon for Various Categories of Program Participants, Based on Intermediate Assumptions [Present values as of January 1, 2023; dollar amounts in trillions] …
present value of future cost for current participants [=] $95.7 …
present value of future dedicated tax income for current participants [=] $44.4 …
present value of future General Fund reimbursements through the infinite horizon a [=] d …
a Distribution of General Fund reimbursements among past, current, and future participants cannot be determined.
d Less than $50 billion
CALCULATION:
$95.7 trillion present value of future cost for current participants
– $44.4 trillion present value of future dedicated tax income for current participants
– $0.05 trillion present value of future general fund reimbursements over the infinite horizon
– $2.8299 trillion current value of the trust fund
= $48.42 trillion closed group unfunded obligation
[170] Calculated with data from: “2023 Annual Report of the Board of Trustees of the Federal Old-Age and Survivors Insurance and Disability Insurance Trust Funds.” United States Social Security Administration, March 28, 2023. <www.ssa.gov>
Page 7: “Table II.B1.—Summary of 2022 Trust Fund Financial Operations (In billions). … OASDI [Social Security] … Total income in 2022 a [=] 1,221.8 … Total cost in 2022 [=] 1,243.9 … a Includes $0.2 billion in reimbursements from the General Fund of the Treasury and less than $50 million in gifts.”
CALCULATION: $48,420,100,000,000 closed group unfunded obligation / $1,221,800,000,000 income = 39.6
[171] Calculated with data from the footnotes above and the “2023 Annual Report of the Board of Trustees of the Federal Old-Age and Survivors Insurance and Disability Insurance Trust Funds.” United States Social Security Administration, March 28, 2023. <www.ssa.gov>
Pages 63–64: “Table IV.B3.—Covered Workers and Beneficiaries, Calendar Years 1945–2100 … Historical data: … Covered workersa (in thousands) … 2022 [=] 180,510 … a Workers who are paid at some time during the year for employment on which OASDI [Social Security] taxes are due.”
CALCULATION: $48,420,100,000,000 closed group unfunded obligation / 180,510,000 workers = $268,241/worker
[172] “2023 Annual Report of the Board of Trustees of the Federal Old-Age and Survivors Insurance and Disability Insurance Trust Funds.” United States Social Security Administration, March 28, 2023. <www.ssa.gov>
Pages 63–64:
Table IV.B3.—Covered Workers and Beneficiaries, Calendar Years 1945–2100 …
Historical data: 2022 …
Covered workersa (in thousands) … 2022 [=] 180,510 …
Beneficiariesb (in thousands) … OASDIc [=] 65,614 …
a Workers who are paid at some time during the year for employment on which OASDI [Social Security] taxes are due.
b Beneficiaries with monthly benefits in current-payment status as of June 30.
c This column is the sum of OASI [Old-Age & Survivors Insurance] and DI [Disability Insurance] beneficiaries. A small number of beneficiaries receive benefits from both funds.”
CALCULATIONS:
[173] Calculated with data from:
a) Dataset: “Trust Fund Operations in Current Dollars, Intermediate Assumptions, 2023 Trustees Report.” United States Social Security Administration, Office of the Chief Actuary. Transmitted to Just Facts on August 25, 2023.
“Year 2097 … Assets (end of year) = –$599,726,070,000,000”
b) Dataset: “Table VI.G6. Selected Economic Variables, Calendar Years 1970–2100 [GDP and Taxable Payroll in Billions].” U.S. Social Security Administration. Accessed August 26, 2023 at <www.ssa.gov>3/lr6g6.html
“Year 2097 … Intermediate … Adjusted CPIa [=] 579.08 … a CPI-W [inflation] indexed to calendar year 2023. Historical values computed using the intermediate assumptions value for 2023.”
CALCULATION: –$599,726,070,000,000 / (579.08/100) = $103,565,322,580,645
[174] Calculated with data from: “Table IV.B3. Covered Workers and Beneficiaries, Calendar Years 1945–2100.” United States Social Security Administration, Office of the Chief Actuary. Accessed August 26, 2023 at <www.ssa.gov>
“Calendar year [=] 2097 … Intermediate … Covered workersa (in thousands) … [=] 238,420 … a Workers who are paid at some time during the year for employment on which OASDI [Social Security] taxes are due.”
CALCULATION: $103,565,322,580,645 / 238,420,000 = $434,842
[175] “2023 Annual Report of the Board of Trustees of the Federal Old-Age and Survivors Insurance and Disability Insurance Trust Funds.” United States Social Security Administration, March 28, 2023. <www.ssa.gov>
Page 73:
The open-group unfunded obligation measures the adequacy of financing over the period as a whole for a program financed on a pay-as-you-go basis. On this basis, payroll taxes and scheduled benefits for all participants are included through 2097.
The open-group unfunded obligation increased from $20.4 trillion shown in last year’s report to $22.4 trillion in this report.
Pages 75:
Consideration of summary measures alone (such as the actuarial balance and open-group unfunded obligation) for a 75-year period can lead to incorrect perceptions and to policy prescriptions that do not achieve sustainable solvency. These concerns can be addressed by considering the trend in trust fund ratios toward the end of the period. …
Another measure of trust fund finances, discussed in appendix F, is the infinite horizon unfunded obligation, which takes account of all annual balances, even those after 75 years. The extension of the time period past 75 years assumes that the current-law OASDI [Social Security] program and the demographic, economic, and program-specific trends used for the 75-year projection continue indefinitely.
Page 208:
Table VI.F1 shows that the OASDI open-group unfunded obligation over the infinite horizon is $65.9 trillion in present value, which is $43.4 trillion larger than for the 75-year period. The $43.4 trillion increment reflects a significant financing gap projected for OASDI for years after 2097 into perpetuity. Of course, the degree of uncertainty associated with estimates increases substantially for years further in the future.
Page 209:
Last year, the Trustees projected that the infinite horizon unfunded obligation was $61.8 trillion in present value discounted to January 1, 2022. If the assumptions, methods, and starting values had not changed, moving the valuation date forward by 1 year to January 1, 2023 would have discounted future values by 1 year less, thus increasing the measured unfunded obligation by about $1.4 trillion, to $63.2 trillion. The net effects of changes in assumptions, methods, law, and starting values increased the infinite horizon unfunded obligation by an additional $2.7 trillion.
[176] “2023 Annual Report of the Board of Trustees of the Federal Old-Age and Survivors Insurance and Disability Insurance Trust Funds.” United States Social Security Administration, March 28, 2023. <www.ssa.gov>
Page 25:
Under current law, the projected cost of Social Security generally increases faster than projected income through about 2040 primarily because the ratio of workers paying taxes to beneficiaries receiving benefits will decline as the baby-boom generation continues to retire and is replaced at working ages with subsequent lower birth-rate generations. The effects of the aging baby boom and subsequent lower birth rates will have largely stabilized between about 2040 and 2055, but annual cost is projected to grow significantly faster than income between 2055 and 2078 due to the period of historically low birth rates starting with the recession of 2007–09. Between 2078 and 2097, cost is projected to grow somewhat slower than income, reflecting an assumed return to a stable ultimate birth rate of 2 children per woman for 2056 and thereafter. Based on the Trustees’ intermediate assumptions, Social Security’s cost exceeds total income in 2023, as it has beginning in 2021, and remains higher throughout the remainder of the 75-year projection period.
[177] Dataset: “Table IV.B3.—Covered Workers and Beneficiaries, Calendar Years 1945–2100.” United States Social Security Administration, Office of the Chief Actuary. Accessed August 26, 2023 at <www.ssa.gov>
[178] Webpage: “Summary of P.L. 98-21 (H.R. 1900): Social Security Amendments of 1983.” Social Security Administration, Office of Legislative and Congressional Affairs, November 26, 1984. <www.ssa.gov>
“Raises the age of eligibility for unreduced retirement benefits in two stages to 67 by the year 2027. Workers born in 1938 will be the first group affected by the gradual increase.”
[179] Pamphlet: “Understanding the Benefits.” United States Social Security Administration, January 2023. <www.ssa.gov>
Page 7:
Full Retirement Age
If you were born from 1943 to 1960, the age at which full retirement benefits are payable increases gradually to age 67. In 2023, if your birth year is 1955 or earlier, you’re already eligible for your full Social Security benefit. Use the following chart to find out your full retirement age.
|
Year of Birth |
Full Retirement Age |
|
1943–1954 |
66 |
|
1955 |
66 and 2 months |
|
1956 |
66 and 4 months |
|
1957 |
66 and 6 months |
|
1958 |
66 and 8 months |
|
1959 |
66 and 10 months |
|
1960 or later |
67 |
[180] Pamphlet: “Social Security: A Brief History.” United States Social Security Administration, August 2005. <www.ssa.gov>
Page 21: “01/31/40: Ida May Fuller became the first person to receive an old-age monthly benefit check.”
[181] Calculated with data from:
a) “2023 Annual Report of the Board of Trustees of the Federal Old-Age and Survivors Insurance and Disability Insurance Trust Funds.” United States Social Security Administration, March 28, 2023. <www.ssa.gov>
Page 100: “Table V.A4.—Period Life Expectancya … Historical data … At age 65 … Male … 1940 [=] 11.9 … 2022d [=] 17.5 … a The period life expectancy at a given age for a given year is the average remaining number of years expected prior to death for a person at that exact age, born on January 1, using the mortality rates for that year over the course of his or her remaining life. … d Estimated, intermediate alternative.”
b) Pamphlet: “Understanding the Benefits.” United States Social Security Administration, January 2023. <www.ssa.gov>
Page 7: “Use the chart below to find out your full retirement age. … Year of Birth [=] 1958… Full Retirement Age [=] 66 and 8 months”
CALCULATIONS:
[182] Pamphlet: “Social Security: A Brief History.” United States Social Security Administration, August 2005. <www.ssa.gov>
Page 21: “01/31/40: Ida May Fuller became the first person to receive an old-age monthly benefit check.”
[183] Calculated with data from:
a) “2023 Annual Report of the Board of Trustees of the Federal Old-Age and Survivors Insurance and Disability Insurance Trust Funds.” United States Social Security Administration, March 28, 2023. <www.ssa.gov>
Page 100: “Table V.A4.—Period Life Expectancya … Historical data … At age 65 … Female … 1940 [=] 13.4 … 2022d [=] 20.1 … a The period life expectancy at a given age for a given year is the average remaining number of years expected prior to death for a person at that exact age, born on January 1, using the mortality rates for that year over the course of his or her remaining life. … d Estimated, intermediate alternative.”
b) Pamphlet: “Understanding the Benefits.” United States Social Security Administration, January 2023. <www.ssa.gov>
Page 7: “Use the chart below to find out your full retirement age. … Year of Birth [=] 1958… Full Retirement Age [=] 66 and 8 months”
CALCULATIONS:
[184] “2023 Annual Report of the Board of Trustees of the Federal Old-Age and Survivors Insurance and Disability Insurance Trust Funds.” United States Social Security Administration, March 28, 2023. <www.ssa.gov>
NOTE: See pages 119–127, which explain “automatically adjusted program parameters” in detail.
[185] “2010 Annual Report of the Board of Trustees of the Federal Old-Age and Survivors Insurance and Disability Insurance Trust Funds.” Board of Trustees of the Federal OASDI Trust Funds, August 9, 2010. <www.ssa.gov>
Page 208: “Baby boom. The period from the end of World War II (1946) through 1965 marked by unusually high birth rates.”
[186] Dataset: “Table V.A1. Fertility and Mortality Assumptions, Calendar Years 1940–2095.” United States Social Security Administration, Office of the Chief Actuary. Accessed November 4, 2017 at <www.ssa.gov>
Total fertility rate b …
1957 [=] 3.68 …
b The total fertility rate for any year is the average number of children that would be born to a woman in her lifetime if she were to experience, at each age of her life, the birth rate observed in, or assumed for, the selected year, and if she were to survive the entire childbearing period.
[187] Dataset: “Table V.A1. Fertility and Mortality Assumptions, Calendar Years 1940–2095.” United States Social Security Administration, Office of the Chief Actuary. Accessed November 5, 2020 at <www.ssa.gov>
Total fertility rate b … 1976 [=] 1.74 …
b The total fertility rate for any year is the average number of children that would be born to a woman in her lifetime if she were to experience, at each age of her life, the birth rate observed in, or assumed for, the selected year, and if she were to survive the entire childbearing period. … e Estimated, intermediate alternative.
[188] “2023 Annual Report of the Board of Trustees of the Federal Old-Age and Survivors Insurance and Disability Insurance Trust Funds.” United States Social Security Administration, March 28, 2023. <www.ssa.gov>
Pages 88–89:
Table V.A1.—Fertility and Mortality Assumptions,a Calendar Years 1940–2100 … Historical data … Total fertility rateb … 2022 [=] f1.69 … b The total fertility rate for any year is the average number of children that would be born to a woman if she were to experience, at each age of her life, the birth rate observed in, or assumed for, the selected year, and if she were to survive the entire childbearing period. … f Estimated, intermediate alternative.
[189] Article: “Medicare Bound to Bust as First Boomers Hit 65.” By Sharyl Attkisson. CBS, December 30, 2010. <www.cbsnews.com>
“On New Year’s Day, the first baby boomers will celebrate the big 6–5, and they’re not just getting older.”
[190] Calculated with data from: “2010 Annual Report of the Board of Trustees of the Federal Old-Age and Survivors Insurance and Disability Insurance Trust Funds.” Board of Trustees of the Federal OASDI Trust Funds, August 9, 2010. <www.ssa.gov>
Page 208: “Baby boom. The period from the end of World War II (1946) through 1965 marked by unusually high birth rates.”
CALCULATION: 1946 + 65 = 2011
[191] Calculated with the dataset: “Table IV.B3. Covered Workers and Beneficiaries, Calendar Years 1945–2100.” United States Social Security Administration, Office of the Chief Actuary. Accessed August 26, 2023 at <www.ssa.gov>
|
Year |
Covered Workers a |
OASI [Old-Age and Survivors Insurance] Beneficiaries b |
|
2011 |
158,584,000 |
44,388,000 |
|
2032 |
188,069,000* |
69,315,000* |
a Workers who are paid at some time during the year for employment on which OASDI [Social Security] taxes are due.
b Beneficiaries with monthly benefits in current-payment status as of June 30.
* Intermediate Assumptions.
CALCULATIONS:
[192] Calculated with data from the “2023 Annual Report of the Board of Trustees of the Federal Old-Age and Survivors Insurance and Disability Insurance Trust Funds.” United States Social Security Administration, March 28, 2023. <www.ssa.gov>
Pages 97–98: “Table V.A3.—Social Security Area Population as of July 1 and Dependency Ratios, Calendar Years 1945–2100 … Population (in thousands) … Total … 1965 [=] 204,018 … 2022d [=] 335,997 … d Estimated, intermediate alternative.”
Pages 144–145: “Table V.C5.—DI Beneficiaries With Benefits in Current-Payment Status at the End of Calendar Years 1960–2100 (Beneficiaries in thousands…) … Total beneficiaries … 1965 [=] 1,739 … 2022 [=] 8,842”
CALCULATIONS:
[193] “2010 Annual Report of the Board of Trustees of the Federal Old-Age and Survivors Insurance and Disability Insurance Trust Funds.” Board of Trustees of the Federal OASDI Trust Funds, August 9, 2010. <www.ssa.gov>
Page 7: “These factors will depend in turn on future birth rates, death rates, immigration, marriage and divorce rates, retirement-age patterns, disability incidence and termination rates, employment rates, productivity gains, wage increases, inflation, and many other demographic, economic, and program-specific factors.”
[194] “2010 Annual Report of the Board of Trustees of the Federal Old-Age and Survivors Insurance and Disability Insurance Trust Funds.” United States Social Security Administration, August 9, 2010. <www.ssa.gov>
Page 7:
The intermediate demographic and economic assumptions shown in table II.C1 reflect the Trustees’ best estimates of future experience, and therefore most of the figures in this overview depict only the outcomes under the intermediate assumptions. Any projection of the future is, of course, uncertain. For this reason, alternatives I (low-cost) and III (high-cost) are included to provide a range of possible future experience.
Page 15: “Uncertainty of the Projections … Significant uncertainty surrounds the intermediate assumptions.”
[195] Calculated with data from:
a) Dataset: “Trust Fund Operations in Current Dollars, Intermediate Assumptions, 2001 Trustees Report.” United States Social Security Administration, Office of the Chief Actuary, February 13, 2001.
b) Dataset: “Trust Fund Operations in Current Dollars, Intermediate Assumptions, 2010 Trustees Report.” United States Social Security Administration, Office of the Chief Actuary. Transmitted to Just Facts on December 20, 2010.
c) Dataset: “Trust Fund Operations in Current Dollars, Intermediate Assumptions, 2020 Trustees Report.” United States Social Security Administration, Office of the Chief Actuary. Transmitted to Just Facts on November 13, 2020.
d) Dataset: “Trust Fund Operations in Current Dollars, Intermediate Assumptions, 2023 Trustees Report.” United States Social Security Administration, Office of the Chief Actuary. Transmitted to Just Facts on August 25, 2023.
e) “2001 Annual Report of the Board of Trustees of the Federal Old-Age and Survivors Insurance and Disability Insurance Trust Funds.” United States Social Security Administration, March 19, 2001. <www.ssa.gov>
Page 3: “Table II.B1.—Summary of 2000 Trust Fund Financial Operations”
f) “2010 Annual Report of the Board of Trustees of the Federal Old-Age and Survivors Insurance and Disability Insurance Trust Funds.” Board of Trustees of the Federal OASDI Trust Funds, August 9, 2010. <www.ssa.gov>
Page 5: “Table II.B1.—Summary of 2009 Trust Fund Financial Operations”
g) “2020 Annual Report of the Board of Trustees of the Federal Old-Age and Survivors Insurance and Disability Insurance Trust Funds.” United States Social Security Administration, April 22, 2020. <www.ssa.gov>
Page 7: “Table II.B1.—Summary of 2011 Trust Fund Financial Operations”
h) “2023 Annual Report of the Board of Trustees of the Federal Old-Age and Survivors Insurance and Disability Insurance Trust Funds.” United States Social Security Administration, March 28, 2023. <www.ssa.gov>
Page 7: “Table II.B1.—Summary of 2022 Trust Fund Financial Operations”
NOTE: Excel file containing the data and calculations are available upon request.
[196] Calculated with data from:
a) Dataset: “Trust Fund Operations in Current Dollars, Intermediate Assumptions, 2001 Trustees Report.” United States Social Security Administration, Office of the Chief Actuary, February 13, 2001.
b) Dataset: “Trust Fund Operations in Current Dollars, Intermediate Assumptions, 2010 Trustees Report.” United States Social Security Administration, Office of the Chief Actuary. Transmitted to Just Facts on October 16, 2008.
c) Dataset: “Trust Fund Operations in Current Dollars, Intermediate Assumptions, 2023 Trustees Report.” United States Social Security Administration, Office of the Chief Actuary. Transmitted to Just Facts on August 25, 2023.
d) “2001 Annual Report of the Board of Trustees of the Federal Old-Age and Survivors Insurance and Disability Insurance Trust Funds.” United States Social Security Administration, March 19, 2001. <www.ssa.gov>
Page 3: “Table II.B1.—Summary of 2000 Trust Fund Financial Operations”
e) “2010 Annual Report of the Board of Trustees of the Federal Old-Age and Survivors Insurance and Disability Insurance Trust Funds.” Board of Trustees of the Federal OASDI Trust Funds, August 9, 2010. <www.ssa.gov>
Page 5: “Table II.B1.—Summary of 2009 Trust Fund Financial Operations”
f) “2023 Annual Report of the Board of Trustees of the Federal Old-Age and Survivors Insurance and Disability Insurance Trust Funds.” United States Social Security Administration, March 28, 2023. <www.ssa.gov>
NOTE: Excel file containing the data and calculations are available upon request.
[197] Paper: “Statistical Security for Social Security.” By Samir Soneji and Gary King. Demography, May 17, 2012. <gking.harvard.edu>
We begin by detailing information necessary for replicating the Social Security Administration’s (SSA’s) forecasting procedures, which until now has been unavailable in the public domain. … The most recent SSA mortality forecasts were based on the best available technology at the time, which was a combination of linear extrapolation and qualitative judgments. Unfortunately, linear extrapolation excludes known risk factors and is inconsistent with long-standing demographic patterns, such as the smoothness of age profiles. Modern statistical methods typically outperform even the best qualitative judgments in these contexts. We show how to use such methods, enabling researchers to forecast using far more information, such as the known risk factors of smoking and obesity and known demographic patterns. Including this extra information makes a substantial difference. For example, by improving only mortality forecasting methods, we predict three fewer years of net surplus, $730 billion less in Social Security trust funds, and program costs that are 0.66% greater for projected taxable payroll by 2031 compared with SSA projections . …
We predict higher life expectancy and an older age distribution of death, when considering the steady decline in smoking and rapid rise in obesity, than do the SSA projections, which use no covariates except implicitly. The result indicates that Social Security, especially the OASI [Old-Age and Survivors Insurance] program, may be in a considerably more precarious position than officially thought.
[198] Calculated with data from:
a) Dataset: “Old-Age and Survivors Insurance Trust Fund, 1937–2016.” United States Social Security Administration, Office of the Chief Actuary. Accessed September 8, 2017 at <www.socialsecurity.gov>
b) Dataset: “Disability Insurance Trust Fund, 1957–2016.” United States Social Security Administration, Office of the Chief Actuary. Accessed September 8, 2017 at <www.socialsecurity.gov>
c) “CPI Detailed Report Data for December 2016.” U.S. Department of Labor, Bureau of Labor Statistics, January 24, 2017. <www.bls.gov>
“Table 24. Historical Consumer Price Index for All Urban Consumers (CPI-U): U.S. city average, all items (1982–84=100, unless otherwise noted)”
NOTE: Excel file containing the data and calculations is available upon request.
[199] Report: “Summary of Major Changes in the Social Security Cash Benefits Program: 1935–1996.” By Geoffrey Kollmann. Library of Congress, Congressional Research Service. Updated December 20, 1996. <www.ssa.gov>
Pages 13–14:
1977 Amendments
In 1973, the Social Security Board of Trustees began to project financial problems for the system in both the near and long term. The financing problem grew worse throughout the mid-seventies …
… Under the 1972 law, future benefit levels were highly dependent upon the future relationship of wage and price growth. As a result, future benefits could be lower or higher than intended, and the prevailing view in the mid-1970s was that they would be much higher than anticipated. In fact, it was projected that if the benefit computation rules were left unchanged, benefits for many individuals retiring in the future would exceed their earnings before retirement. …
The 1977 amendments were enacted primarily to alleviate these financing problems. The amendments increased future revenues by raising tax rates and the earnings base [taxable maximum], but more significantly, they changed the benefit formula that was raising initial benefits too rapidly. … These actions improved the forecasts of the financial condition of the program significantly. At the time of enactment, the Social Security actuaries projected that the OASDI [Social Security] trust funds would be solvent for the next 50 years, although by a small margin in the late 1970s and early 1980s.
Major provisions of the 1977 amendments:
• Changed the benefit formula for those reaching age 62, becoming disabled, or dying in 1979 or later. Initial benefits would be computed using a formula that would be indexed to the growth in average wages over the years, so that they would generally maintain pace with the standard of living. …
• Increased tax rates slightly in 1979 and 1980, and more significantly in 1981 and later. The ultimate OASDHI [Social Security and Medicare] tax rate would be 7.65% on employees and employers, each, in 1990. (Formerly, the rate in 1990 was 6.45% and the ultimate rate 7.45% in 2011.)
• Increased the earnings base, on an ad hoc basis, to $22,900 in 1979, $25,900 in 1980, and $29,700 in 1981. After 1981, the base would be adjusted automatically to keep up with average wages as under the prior law.
[200] Webpage: “Presidential Statements, Jimmy Carter.” United States Social Security Administration. Accessed June 29, 2018 at <www.ssa.gov>
Social Security Amendments of 1977
Remarks at the Bill Signing Ceremony. December 20, 1977
It is never easy for a politically elected person to raise taxes. But the Congress has shown sound judgment and political courage in restoring the social security system to a sound basis. …
The most important thing, of course, is that without this legislation, the social security reserve funds would have begun to be bankrupt in just a year or two, by 1979. Now this legislation will guarantee that from 1980 to the year 2030, the social security funds will be sound. …
Written Statement on Signing S.305 Into Law. December 20, 1977 …
Taken together, these are tremendous achievements and represent the most important social security legislation since the program was established.
[201] Webpage: “Presidential Statements, Jimmy Carter.” United States Social Security Administration. Accessed June 29, 2018 at <www.ssa.gov>
“Social Security Amendments of 1977 … Remarks at the Bill Signing Ceremony. December 20, 1977”
[202] Calculated with data from:
a) Dataset: “Old-Age and Survivors Insurance Trust Fund, 1937–2016.” United States Social Security Administration, Office of the Chief Actuary. Accessed September 8, 2017 at <www.socialsecurity.gov>
b) Dataset: “Disability Insurance Trust Fund, 1957–2016.” United States Social Security Administration, Office of the Chief Actuary. Accessed September 8, 2017 at <www.socialsecurity.gov>
c) “CPI Detailed Report Data for December 2016.” U.S. Department of Labor, Bureau of Labor Statistics, January 24, 2017. <www.bls.gov>
“Table 24. Historical Consumer Price Index for All Urban Consumers (CPI-U): U.S. city average, all items (1982–84=100, unless otherwise noted)”
NOTE: An Excel file containing the data and calculations is available upon request.
[203] Report: “Summary of Major Changes in the Social Security Cash Benefits Program: 1935–1996.” By Geoffrey Kollmann. Library of Congress, Congressional Research Service. Updated December 20, 1996. <www.ssa.gov>
Pages 16–17:
Although the 1977 amendments had been projected to keep Social Security solvent for 50 years, but with a fairly thin margin of safety in the early 1980s, the performance of the economy was much worse than expected in the years immediately following enactment, and trust fund reserves continued to decline rapidly. As forecasts of a cash shortfall worsened, stopgap measures were enacted to buy time for Congress to assess the problem. …
1983 Amendments
To resolve OASDI’s [Social Security’s] financing problems President Reagan and congressional leaders formed a bipartisan panel, the National Commission on Social Security Reform. In January 1983, a majority of its members reached agreement on a compromise solution that was estimated to produce enough in additional OASDI income and benefit reductions to solve the short-range financing problem and reduce the OASDI deficit projected over the next 75 years by two-thirds.
In March 1983, Congress incorporated the Commission’s recommendations, with some modifications, as well as additional provisions to resolve the remaining long-range deficit, into the 1983 Social Security Amendments. The major provisions of the amendments included:
• A gradual increase in the age of eligibility for full retirement benefits from age 65 to age 66 in 2009 and age 67 in 2027.
• Coverage of federal civilian employees hired after December 31, 1983, and most current executive level political appointees and elected officials (including Members of Congress, the President, and the Vice President) and Federal judges, effective January 1984.
• Compulsory coverage of all employees of nonprofit organizations effective in January 1984 and a ban on the termination of coverage of nonprofit organization and state and local government employment after 1982.
• A delay of the June 1983 Social Security COLA [cost of living adjustment] to December 1983. All future COLAS would also be effective in December.
• Acceleration of scheduled tax increases for employees and employers, with an offsetting tax credit for employees for 1984; increase in the rates for the self-employed to equal the combined employee/employer rate but with partially offsetting credits and deductions.
• Inclusion of up to 50% of Social Security benefits in the taxable income of higher income beneficiaries and transfer of projected revenues therefrom to the Social Security trust funds. The income thresholds (adjusted gross income plus one-half of Social Security benefits) were set at $25,000 for single individuals, $32,000 for couples filing jointly, and zero for couples filing separately.
[204] “2010 Annual Report of the Board of Trustees of the Federal Old-Age and Survivors Insurance and Disability Insurance Trust Funds.” Board of Trustees of the Federal OASDI [Social Security] Trust Funds, August 9, 2010. <www.ssa.gov>
[205] Commentary: “Attacking Social Security.” By Paul Krugman. New York Times, August 15, 2010. <www.nytimes.com>
But neither of these potential problems is a clear and present danger. Social Security has been running surpluses for the last quarter-century, banking those surpluses in a special account, the so-called trust fund. The program won’t have to turn to Congress for help or cut benefits until or unless the trust fund is exhausted, which the program’s actuaries don’t expect to happen until 2037—and there’s a significant chance, according to their estimates, that that day will never come.
[206] “2010 Annual Report of the Board of Trustees of the Federal Old-Age and Survivors Insurance and Disability Insurance Trust Funds.” Board of Trustees of the Federal OASDI [Social Security] Trust Funds, August 9, 2010. <www.ssa.gov>
Page 57:
Even under the high-cost assumptions, however, the combined OASI [Old-Age & Survivors Insurance] and DI [Disability Insurance] funds on hand plus their estimated future income would be able to cover their combined cost for 19 years (until 2029). Under the intermediate assumptions, the combined starting funds plus estimated future income would be able to cover cost for 27 years (until 2037). The program would be able to cover cost for the foreseeable future under the more optimistic low-cost assumptions.
[207] “2010 Annual Report of the Board of Trustees of the Federal Old-Age and Survivors Insurance and Disability Insurance Trust Funds.” Board of Trustees of the Federal OASDI [Social Security] Trust Funds, August 9, 2010. <www.ssa.gov>
Page 15: “The actual outcome for future costs is unlikely to be as extreme as either of the outcomes portrayed by the low- and high-cost projections. The method for constructing these low- and high-cost projections does not provide an estimate of the probability that actual experience will lie within or outside the range they define.”
[208] “2010 Annual Report of the Board of Trustees of the Federal Old-Age and Survivors Insurance and Disability Insurance Trust Funds.” Board of Trustees of the Federal OASDI [Social Security] Trust Funds, August 9, 2010. <www.ssa.gov>
Page 57: “Thus, because large, persistent annual deficits are projected under all but the low-cost assumptions, it is likely that income will eventually need to be increased, program costs will need to be reduced, or both, in order to prevent exhaustion of the trust funds.”
[209] “2010 Annual Report of the Board of Trustees of the Federal Old-Age and Survivors Insurance and Disability Insurance Trust Funds.” Board of Trustees of the Federal OASDI [Social Security] Trust Funds, August 9, 2010. <www.ssa.gov>
Page 173:
The Trustees Report has traditionally shown additional estimates using the low-cost and high-cost sets of specified assumptions to reflect the presence of uncertainty. These additional estimates provide a range of possible outcomes for the projections. However, they provide no indication of the probability that actual future experience will be inside or outside the range of these estimates. This appendix presents the results of a model, based on stochastic modeling techniques, that estimates a probability distribution of future outcomes of the financial status of the combined OASI [Old-Age & Survivors Insurance] and DI [Disability Insurance] Trust Funds.
It should be noted that this model is subject to further development. Future improvements and refinements are expected to be more likely to expand, rather than reduce, the indicated range of uncertainty.
Page 174: “The results from this model should be interpreted with caution and with an understanding of the inherent limitations. Results are very sensitive to equation specifications, degrees of interdependence among variables, and the historical periods used for the estimates. … Substantial shifts, as predicted by many experts and as seen in prior centuries, are not fully reflected in the current model.”
Page 175:
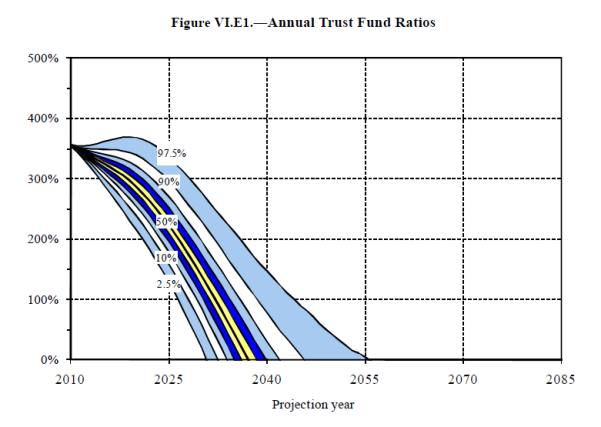
Page 178: “Table VI.E1.—Long-Range Estimates Relating to the Actuarial Status of the Combined OASDI Program … First year assets become exhaustedc … 95-percent confidence interval … 2.5th percentile [=] 2030 … 97.5th percentile [=] 2055 … c For some stochastic simulations, the first year in which trust fund assets become exhausted does not indicate a permanent exhaustion of assets.”
[210] Calculated with data from the “2023 Annual Report of the Board of Trustees of the Federal Old-Age and Survivors Insurance and Disability Insurance Trust Funds.” United States Social Security Administration, March 28, 2023. <www.ssa.gov>
Page 36: “Table III.A3.—Operations of the Combined OASI [Old-Age & Survivors Insurance] and DI [Disability Insurance] Trust Funds, Calendar Year 2022 [In millions]. … Net administrative expenses [=] $6,746 … Total cost [=] $1,243,925”
NOTE: The “combined OASI and DI Trust Funds” comprise the “Social Security Trust Fund.”
CALCULATION: $6,746 / $1,243,925 = 0.54%
[211] Calculated with data from the pamphlet: “Understanding the Benefits.” United States Social Security Administration, January 2023. <www.ssa.gov>
Page 22: “Estimated Average 2023 Monthly Social Security Benefits … All retired workers: $1,827”
CALCULATIONS:
[212] Study: “Administrative Costs of Private Accounts in Social Security.” By Ben Page under the direction of Douglas Hamilton and Robert Dennis. Congressional Budget Office, Macroeconomic Analysis Division, March 2004. <www.cbo.gov>
Page 11:
The [Social Security] administrative costs discussed above do not include the burden on the private sector. Costs to firms and individuals in the form of time and increased paperwork are probably substantial. However, it is difficult to assess the administrative burden for employers in dollar values because those costs depend on the individual circumstances of each employer (for example, their use of electronic reporting and the size of their workforce). Furthermore, it is difficult to separate the cost to employers of processing payroll tax contributions from other costs, such as remitting income taxes withheld from employees. For those reasons, this analysis makes no attempt to estimate the administrative burden on the private sector. Evidence about the operation of labor markets indicates that workers are likely to bear most of that burden in the long run.
Page 9:
Employers bear the burden of the collection costs. They collect payroll taxes from employees and transfer them to the IRS together with other withheld income taxes. Most employers with $50,000 or less in total income and payroll tax payments during a four-quarter look-back period must deposit the taxes withheld from wages within a month after the wages are paid. Employers with more than $50,000 in tax payments during that period must deposit their taxes semiweekly. Any employer who accrues a total liability of $100,000 in one day must deposit all withheld taxes by the following day. The deposits can be made either at a Federal Reserve Bank branch or at a financial institution that is authorized by the IRS. The IRS determines the tax payments for the trust funds from the information provided by employers on Form 941. Moreover, tax payments on Social Security benefits are transferred to the trust funds according to the information on individual tax returns.
Employers are also responsible for transmitting substantial amounts of information to the SSA [Social Security Administration] and the IRS. Employers must report the wages subject to Social Security taxes annually to the SSA. The SSA receives a copy of each W-2 form that is issued to employees for tax-filing purposes at the beginning of the year, detailing earnings and payroll taxes withheld during the previous calendar year. Moreover, employers must file form W-3, which summarizes aggregate tax withholdings, with the SSA. The IRS receives similar aggregate tax information from employers each quarter on Form 941.
The self-employed do not file their earnings reports directly with the SSA. Instead, they calculate and report their Social Security tax (also called a self-employment tax) on schedule SE of the income tax return. After processing the tax form, the IRS furnishes the information about taxable earnings of the self-employed to the SSA.
[213] Report: “Benefit Payments in Instances Where the Social Security Administration Removed a Death Entry From the Beneficiary’s Record.” United States Social Security Administration, Office of the Inspector General, June 19, 2008.
Page 2:
In instances when death reports are posted in error, SSA [Social Security Administration] deletes the death entry from the DMF [death master file] (“resurrect” the record) and, when applicable, reinstates benefit payments. SSA employees may only process transactions to resurrect a record when presented with proof the original death entry was posted in error. Unless the mistake resulted from an administrative error, the resurrection transaction should not be processed before completion of a face-to-face interview with the beneficiary or recipient. To validate the integrity of these transactions, SSA requires that two employees be involved in the process. SSA also requires that employees document the events leading to and facts supporting the transaction.
Since January 2004, SSA has provided us with electronic files containing updates made to the DMF, including instances when individual records were removed from the DMF. Preliminary analysis of these files indicated that, from January 2004 through April 2007, SSA deleted more than 44,000 individuals’ death entries from the DMF. SSA records indicated 20,623 of these individuals were in current payment status on or after April 27, 2007 and received approximately $17.2 million in monthly SSA benefit payments. …
To obtain assurance the resurrection transactions were legitimate, we attempted to verify that 50 randomly selected resurrected beneficiaries/recipients in current payment status were alive.
Page 9 (of PDF): “Analyzed 46,035 instances (44,876 records) where SSA removed death entries from the Death Master File during the period January 2004 through April 2007.”
[214] Report: “Economic Recovery Payments for Social Security and Supplemental Security Income Beneficiaries.” United States Social Security Administration, Office of the Inspector General, September 2010. <www.justfacts.com>
Page 1: “ARRA [the American Recovery and Reinvestment Act] provided for a one-time ERP [Economic Recovery Payment] of $250 to certain adult Social Security and Supplemental Security Income (SSI) beneficiaries.”
Page 2:
SSA [The Social Security Administration] was required to identify and certify the Social Security and SSI beneficiaries eligible for an ERP and provide the Department of the Treasury (Treasury) with the information to disburse the payments. … In April 2009, SSA identified all beneficiaries who met the eligibility criteria from its payment records. In May 2009, about 52 million beneficiaries received their $250 payments, totaling about $13 billion.
[215] Report: “Economic Recovery Payments for Social Security and Supplemental Security Income Beneficiaries.” United States Social Security Administration, Office of the Inspector General, September 2010. <www.justfacts.com>
Page 3:
Our review disclosed that 71,688 beneficiaries who were deceased before the payment certification date received an ERP [Economic Recovery Payment]. This included 63,481 beneficiaries whose deaths had been reported to SSA [the Social Security Administration]….
ARRA [the American Recovery and Reinvestment Act] states that an ERP shall not be issued to any individual whose date of death occurs before the date on which the individual is certified to receive a payment.10 SSA policy states that if a beneficiary is eligible to receive an ERP, but dies before payment, no ERP will be issued.11
[216] Report: “Economic Recovery Payments for Social Security and Supplemental Security Income Beneficiaries.” United States Social Security Administration, Office of the Inspector General, September 2010. <www.justfacts.com>
Page 4:
The 1966 amendments to the [Social Security] Act included a provision, referred to as the Prouty amendment, that provides for special payments to individuals aged 72 and older who were too old to have worked long enough after passage of the Act to be insured for Social Security benefits.15
Of the 71,688 deceased beneficiaries who received an ERP [Economic Recovery Payment], 8,207 were Prouty beneficiaries whose deaths were generally not reported to SSA [Social Security Administration]. Based on a random sample of 50 beneficiaries, we found these individuals were, according to SSA’s records, between the ages of 112 and 136 and had not received a Social Security benefit for at least 30 years. … The oldest validated living centenarian in the United States was age 114 as of November 2009.16
As a result, we concluded it was unlikely that any Prouty beneficiaries were entitled to an ERP. SSA subsequently informed us there was one Prouty beneficiary who was still alive and eligible for an ERP. … When SSA determined these beneficiaries were eligible for an ERP, it considered neither the age of the beneficiaries nor the lack of contact with these individuals in over 30 years.
NOTES:
[217] Report: “Economic Recovery Payments for Social Security and Supplemental Security Income Beneficiaries.” United States Social Security Administration, Office of the Inspector General, September 2010. <www.justfacts.com>
Page 4: “Based on a random sample of 50 beneficiaries, we found these individuals were, according to SSA’s [Social Security Administration] records, between the ages of 112 and 136….”
NOTE: Given that the individual was 136 years old and the law was implemented in 2009, this person was born in 1873 (2009 – 136 = 1873).
[218] Article: “Dead People Being Sent Stimulus Checks.” Fox News, May 15, 2009. Last updated 12/24/15. <www.foxnews.com>
Antoniette Santopadre of Valley Stream was expecting a $250 stimulus check. But when her son finally opened it, they saw that the check was made out to her father, Romolo Romonini, who died in Italy 34 years ago.
Romonini was a U.S. citizen when he left for Italy in 1933, but only returned to the U.S. for a seven-month visit in 1969. …
… Romonini … [was] never even part of the Social Security system.
[219] “The Social Security Act of 1935.” United States Social Security Administration. Accessed September 19, 2019 at <www.ssa.gov>
[220] Report: “Economic Recovery Payments for Social Security and Supplemental Security Income Beneficiaries.” United States Social Security Administration, Office of the Inspector General, September 2010. <www.justfacts.com>
Page 2: “Finally, ARRA [the American Recovery and Reinvestment Act] did not provide the authority for SSA [the Social Security Administration] or Treasury to reclaim erroneous ERPs [Economic Recovery Payments] issued to deceased beneficiaries.”
Page 4: “[S]ince SSA could not initiate reclamation for the ERPs, it only received returned checks or credits for 26 (52 percent) of the 50 beneficiaries in our sample.”
[221] Report: “Payment Integrity Scorecard, Q2 2023.” U.S. Chief Financial Officers Council, May 30, 2023. <www.cfo.gov>
“Historical Payment Rate and Amount ($M) (Overpayment as Percentage of Total Outlays) … FY22 … Monetary Loss ($M) [=] $1,972 … [Percentage of Total Outlays =] (0.17%)”
[222] “Agency Financial Report, Fiscal Year 2020.” U.S. Social Security Administration, November 10, 2020. <www.ssa.gov>
Page 176:
Table 1: Improper Payments Experience, FY [fiscal year] 2019 (Dollars in Millions) … OASDI … FY 2019 Outlays [=] $1,008,765.76 … FY 2019 Overpayment $ [=] $2,046.02 … FY 2019 Overpayment % [=] 0.20% … FY 2019 Underpayment $ [=] $533.92 … FY 2019 Underpayment % [=] 0.05%”
NOTE: Page 209 details the results of overpayment collection measures used by the Social Security Administration. There is no way to calculate from this data how much of the above-cited overpayments have been collected.
[223] Calculated with data from the pamphlet: “Understanding the Benefits.” United States Social Security Administration, January 2023. <www.ssa.gov>
Page 22: “Estimated Average 2023 Monthly Social Security Benefits … All retired workers: $1,827”
CALCULATIONS:
[224] Executive Order: “Reducing Improper Payments.” By Barack Obama, November 20, 2009. <www.presidency.ucsb.edu>
By the authority vested in me as President by the Constitution and the laws of the United States of America, and in the interest of reducing payment errors and eliminating waste, fraud, and abuse in Federal programs, it is hereby ordered as follows:
Section 1. Purpose. When the Federal Government makes payments to individuals and businesses as program beneficiaries, grantees, or contractors, or on behalf of program beneficiaries, it must make every effort to confirm that the right recipient is receiving the right payment for the right reason at the right time. The purpose of this order is to reduce improper payments by intensifying efforts to eliminate payment error, waste, fraud, and abuse in the major programs administered by the Federal Government, while continuing to ensure that Federal programs serve and provide access to their intended beneficiaries. No single step will fully achieve these goals. Therefore, this order adopts a comprehensive set of policies, including transparency and public scrutiny of significant payment errors throughout the Federal Government; a focus on identifying and eliminating the highest improper payments; accountability for reducing improper payments among executive branch agencies and officials; and coordinated Federal, State, and local government action in identifying and eliminating improper payments. Because this order targets error, waste, fraud, and abuse—not legitimate use of Government services—efforts to reduce improper payments under this order must protect access to Federal programs by their intended beneficiaries.
[225] Public law 111-204: “Improper Payments Elimination and Recovery Act of 2010.” 111th Congress. Signed into law by Barack Obama on July 22, 2010. <www.congress.gov>
To amend the Improper Payments Information Act of 2002 (31 U.S.C. 3321 note) in order to prevent the loss of billions in taxpayer dollars. …
(c) Reports on Actions To Reduce Improper Payments.—With respect to any program or activity of an agency with estimated improper payments under subsection (b), the head of the agency shall provide with the estimate under subsection (b) a report on what actions the agency is taking to reduce improper payments, including …
(4) program-specific and activity-specific improper payments reduction targets that have been approved by the Director of the Office of Management and Budget …
(d) Reports on Actions To Recover Improper Payments.—With respect to any improper payments identified in recovery audits conducted under section 2(h) of the Improper Payments Elimination and Recovery Act of 2010 (31 U.S.C. 3321 note), the head of the agency shall provide with the estimate under subsection (b) a report on all actions the agency is taking to recover improper payments, including….
[226] Report: “Significance of Administrative Finality in the Old-Age, Survivors and Disability Insurance Program.” United States Social Security Administration, Office of the Inspector General, July 2012. <www.justfacts.com>
Page 7 (of PDF):
On November 20, 2009, Executive Order 13520, Reducing Improper Payments, was issued. This Order focused on eliminating payment error, waste, fraud, and abuse in major Government-administered programs. The Order stated that the Government should make every effort to confirm that the right recipient received the right payment and for the right reason at the right time. Additionally, a March 10, 2010 Executive Memorandum, Finding and Recapturing Improper Payments, stated that, “Thorough identification of improper payments promotes accountability at executive departments and agencies; it also makes the integrity of Federal spending transparent to taxpayers.” On July 22, 2010, Improper Payments Elimination and Recovery Act of 2010 (IPERA)14 became law. IPERA requires that Federal agencies report their actions to recover improper payments. For example, agency reporting should include the amounts recovered, outstanding, and determined uncollectable.
[227] Report: “Fiscal Year 2016 Inspector General Statement on the Social Security Administration’s Major Management and Performance Challenges.” Office of Inspector General, Social Security Administration, November 9, 2016. <www.ssa.gov>
Page 133:
Both the OIG [Office of the Inspector General] and Government Accountability Office noted in 2016 reports that SSA was not in compliance with the Improper Payments Elimination and Recovery Act of 2010 requirements for meeting its targeted payment accuracy rates (which are shown in Table 1). Because of this noncompliance, SSA [Social Security Administration] prepared remediation plans that outlined steps it plans to take to become compliant. For example, SSA’s August 2016 Improper Payments Elimination and Recovery Act Old-Age, Survivors, and Disability Insurance Remediation Plan and its June 2016 Improper Payments Elimination and Recover Act Supplemental Security Income Remediation Plan included steps to identify and prevent overpayments due to wages—one of the leading causes of overpayments in both the OASDI [Social Security] and SSI [Supplemental Security Income] programs.
[228] Report: “Significance of Administrative Finality in the Old-Age, Survivors and Disability Insurance Program.” United States Social Security Administration, Office of the Inspector General, July 2012. <www.justfacts.com>
Page 4 (of PDF):
Administrative finality is the principle that SSA’s [Social Security Administration’s] initial OASDI [Social Security] and SSI [Supplemental Security Income] determinations of eligibility for payments and payment amounts become final and binding on both parties, unless they are timely appealed or later reopened and revised for certain reasons within certain time periods.6 Consequently, if conditions to reopen a determination do not exist or time limits have expired, SSA generally will not revise the benefits and continues to pay the erroneous payment (over- or underpayment) throughout the beneficiary or recipient’s lifetime. SSA does not pursue recovery of any resulting overpayments.
SSA bases these discretionary rules on the premise that the Agency and the beneficiary or recipient should be assured the Agency’s decisions are correct.7 Pursuant to the Social Security Act,8 the Commissioner of SSA sets the rules regarding administrative finality by regulation, not statute. Appendix B provides further detail on SSA’s administrative finality rules for the OASDI and SSI programs.
6 20 C.F.R. § 404.988; SSA, POMS, GN 04001.010 (December 22, 1989), GN 04010.001 (September 9, 2011), SI 04070.010 (September 9, 2011), and GN 04020.001 – 04020.110.
7 SSA, Administrative Message AM-04020, February 3, 2004.
8 §§ 205(a), 1102, and 1631(a)(1); 42 U.S.C. §§ 405(a), 1302 and 1383(a)(1).
[229] Code of Federal Regulations Title 20, Chapter III, Part 404, Subpart J, Section 404.988: “Federal Old-Age, Survivors and Disability Insurance, Administrative Responsibilities, Conditions for Reopening.” Accessed August 29, 2023 at <www.law.cornell.edu>
A determination, revised determination, decision, or revised decision may be reopened—
(a) Within 12 months of the date of the notice of the initial determination, for any reason;
(b) Within four years of the date of the notice of the initial determination if we find good cause, as defined in § 404.989, to reopen the case; or
(c) At any time if—
(1) It was obtained by fraud or similar fault (see § 416.1488(c) of this chapter for factors which we take into account in determining fraud or similar fault);
(2) Another person files a claim on the same earnings record and allowance of the claim adversely affects your claim;
(3) A person previously determined to be dead, and on whose earnings record your entitlement is based, is later found to be alive;
(4) Your claim was denied because you did not prove that a person died, and the death is later established….
[230] Webpage: “Program Operations Manual System: SI 04070.001 Title XVI Administrative Finality—Background.” Accessed August 29, 2023 at <secure.ssa.gov>
Effective Dates: 06/14/2023–Present …
Citations: Regulations at 20 CFR 416.1487 – 20 CFR 416.1494
When it has been determined that an individual is eligible for SSI [Supplemental Security Income] payments, they should be able to rely on that determination. Moreover, it is a well established principle in Federal payment programs that, generally, the administrative agency should not be required to establish findings of fact after the lapse of a considerable time from the date of the events involved. …
The rules regarding administrative finality are set by regulation, not statute, under the Commissioner’s rulemaking authority under Section 1631(a) (1) of the Social Security Act. The regulatory language parallels administrative finality regulations for Titles II and XVIII.
[231] United States Code Title 42, Chapter 7, Subchapter VII, Section 902: “Commissioner; Deputy Commissioner; Other Officers.” Accessed August 29, 2023 at <www.law.cornell.edu>
(1) There shall be in the Administration a Commissioner of Social Security (in this subchapter referred to as the “Commissioner”) who shall be appointed by the President, by and with the advice and consent of the Senate. …
(3) The Commissioner shall be appointed for a term of 6 years, except that the initial term of office for Commissioner shall terminate January 19, 2001. In any case in which a successor does not take office at the end of a Commissioner’s term of office, such Commissioner may continue in office until the entry upon office of such a successor. A Commissioner appointed to a term of office after the commencement of such term may serve under such appointment only for the remainder of such term. An individual serving in the office of Commissioner may be removed from office only pursuant to a finding by the President of neglect of duty or malfeasance in office.
[232] Report: “Administrative Finality in the Old-Age, Survivors and Disability Insurance Program.” United States Social Security Administration, Office of the Inspector General, September 24, 2007. <www.justfacts.com>
Page 2:
We initiated this current review to assess the full impact of administrative finality on the OASDI [Social Security] program. To accomplish our objective, we identified a population of 77,969 OASDI beneficiaries who were receiving benefits as of June 2005 and whose benefit records indicated that administrative finality was involved. From this population, we selected a random sample of 275 cases for detailed analysis.
[233] Report: “Administrative Finality in the Old-Age, Survivors and Disability Insurance Program.” United States Social Security Administration, Office of the Inspector General, September 24, 2007. <www.justfacts.com>
Page 2:
We initiated this current review to assess the full impact of administrative finality on the OASDI [Social Security] program. To accomplish our objective, we identified a population of 77,969 OASDI beneficiaries who were receiving benefits as of June 2005 and whose benefit records indicated that administrative finality was involved. From this population, we selected a random sample of 275 cases for detailed analysis.
[234] Report: “Administrative Finality in the Old-Age, Survivors and Disability Insurance Program.” United States Social Security Administration, Office of the Inspector General, September 24, 2007.
Page 3:
Of the 275 beneficiaries in our sample:
• 156 (57 percent) were paid more in OASDI [Social Security] benefits than they otherwise would have been paid because of administrative finality;
• 99 (36 percent) may have received more OASDI benefits because of administrative finality, but we were unable to quantify the amount because there was insufficient information available; and
• 20 (7 percent) were unaffected by administrative finality.9
[235] Report: “Administrative Finality in the Old-Age, Survivors and Disability Insurance Program.” United States Social Security Administration, Office of the Inspector General, September 24, 2007. <www.justfacts.com>
Page 3:
We estimate SSA [Social Security Administration] identified about 44,230 beneficiaries whose benefits had been incorrectly calculated, but the Agency did not revise the amounts because of its administrative finality rules. As a result, we estimate these individuals were paid about $140.5 million more in OASDI [Social Security] benefits than they otherwise would have been paid had the errors not occurred. We also estimate about 25,801 of these beneficiaries will be paid an additional $49.8 million in the future because their ongoing benefits were not corrected when the Agency identified the calculation errors.8
NOTE: Details on the methodology are given in Appendix C of the report.
[236] Report: “Administrative Finality in the Old-Age, Survivors and Disability Insurance Program.” United States Social Security Administration, Office of the Inspector General, September 24, 2007. <www.justfacts.com>
Page 5:
Conclusion and Recommendation
Based on our analysis, we estimate that SSA’s [Social Security Administration] administrative finality rules cost the OASDI [Social Security] program about $190 million. We recognize that SSA established the rules, in part, to help protect beneficiaries from hardships that could result from the correction of Agency errors. However, OASDI beneficiaries should be paid the benefits they were intended to receive based on the formulas provided in the Social Security Act. We believe that, when SSA discovers errors in the payments to beneficiaries, the Agency should correct them rather than continuing the errors in future benefit payments. By invoking administrative finality and not correcting the errors, the beneficiaries receive extra monies that cost the OASDI trust funds millions of dollars.
[237] Report: “Administrative Finality in the Old-Age, Survivors and Disability Insurance Program.” United States Social Security Administration, Office of the Inspector General, September 24, 2007. <www.justfacts.com>
Pages D2–D3 (Appendix IV, Comments from the Social Security Administration):
Date: June 19, 2007 …
As noted above, ongoing readjudication of claims would place an administrative burden on the Agency’s resources, as well as impact the public’s reliance on the government’s decision. Our regulations state that four years is a reasonable time limit for us to identify and correct any error on our records. Correcting a record more than four years in the past could cause undue hardship for our beneficiaries, as well as create extensive public relations issues for the Agency. We are concerned that making decisions to correct and reduce beneficiary payments beyond the four year time span may erode public trust for our Social Security programs. Any changes in the existing rules would need to be carefully weighed to determine the potential impact of any changes on both the beneficiaries and the Agency. At this time we do not agree that it would be in the Social Security program’s best interest to perform ongoing OASDI [Social Security] benefit recalculations, as to do so would require additional administrative resources and/or the deferral of other Agency work.
Pages 6–7 (Office of Inspector General’s comments on the Social Security Administration’s letter dated June 19, 2007):
We are disappointed that SSA [Social Security Administration] disagreed with our recommendation and, instead, decided that the Agency’s administrative finality rules should remain unchanged without first conducting additional analysis. Not only is the decision to continue with the status quo inconsistent with the Agency’s mantra of continuous improvement, it impedes the Agency’s ability to optimize its efficiency.
According to SSA, the Agency established its 4-year administrative finality regulations in 1949 in part “due to the need to limit reopenings because of their serious impact on SSA’s workloads.” SSA speculated that it would “incur significant operational costs by not having administrative finality,” stating that our recommendation would require the Agency to make “many additional benefit amount recalculations and readjudications.” However, we note that SSA has automated much of the work that was—at the time the regulations were initially adopted—performed manually by employees. The Agency has an automated system in place which examines the earnings of every retired, disabled and deceased worker each year to determine whether the worker’s primary insurance amount may be recomputed.16 In these situations, the actual cost to the Agency to effectuate the change in the benefit amounts after the recalculations are performed may, in fact, be insignificant.
The Agency stated that “correcting a record more than four years in the past could cause undue hardship for our beneficiaries.” However, our recommendation focuses on the ongoing monthly payments and not the benefits that were paid in the past, before the payment errors were discovered. We realize that the administrative finality rules limit the circumstances under which the Agency will revise prior determinations. We believe SSA should explore the possibility of making new payment determinations—and correcting the monthly benefit amounts going forward—whenever new information comes to surface that questions the accuracy of the amount of benefits being paid, and revisions to the previously-issued payments are not possible because of administrative finality.
SSA expressed concern that changing the administrative finality rules and correcting and reducing benefit payments “may erode public trust for our Social Security programs.” However, the Agency’s decision to not take action to correct administrative errors when they are discovered may also have a negative impact. Because of the Agency’s discretionary administrative finality rules, some beneficiaries are knowingly paid more in benefits than they were intended to receive based on the formulas provided in the Social Security Act. Public confidence in the programs may be diminished when some individuals are paid additional benefits, while others are not.
[238] Report: “Significance of Administrative Finality in the Old-Age, Survivors and Disability Insurance Program.” United States Social Security Administration, Office of the Inspector General, July 2012. <www.justfacts.com>
Page 8 (of PDF):
As the steward of trust fund dollars, SSA [Social Security Administration] is accountable to Congress and the public for how it spends these funds. This includes reducing wasteful spending and accounting for all improper payments. However, SSA’s administrative finality rules do not permit it to pursue recovery of or correct any OASDI [Social Security] or SSI [Supplemental Security Income] payments that do not meet the specific criteria of the rules.
Given the recent Government initiative to reduce improper spending and waste of Federal funds and the current economic environment, we do not believe SSA’s administrative finality rules comply with the initiative. SSA should revise its administrative finality rules and allow for revisions to payments to ensure the beneficiary or recipient receives the amount they are due. We believe it is the appropriate business process to ensure the integrity of program funds as these payments affect the trust funds. Accordingly, we recommend SSA evaluate its administrative finality policies and regulations and consider revising the rules to allow for the collection of more debt.
Page 22 (of PDF):
Comments on the Office of the Inspector General Draft Report, “Significance of Administrative Finality in the Social Security Administration’s Programs” (a-08-11-21107)
Recommendation
Evaluate its administrative finality policies and regulations and consider revising the rules to allow for the collection of more debt.
Response
We agree.
[239] Code of Federal Regulations Title 20, Chapter III, Part 404, Subpart J, Section 404.988: “Federal Old-Age, Survivors and Disability Insurance, Administrative Responsibilities, Good Cause for Reopening.” Accessed September 1, 2023 at <www.law.cornell.edu>
A determination, revised determination, decision, or revised decision may be reopened—
(a) Within 12 months of the date of the notice of the initial determination, for any reason;
(b) Within four years of the date of the notice of the initial determination if we find good cause, as defined in § 404.989, to reopen the case; or
(c) At any time if—
(1) It was obtained by fraud or similar fault (see § 416.1488(c) of this chapter for factors which we take into account in determining fraud or similar fault);
(2) Another person files a claim on the same earnings record and allowance of the claim adversely affects your claim;
(3) A person previously determined to be dead, and on whose earnings record your entitlement is based, is later found to be alive;
(4) Your claim was denied because you did not prove that a person died, and the death is later established….
[240] Code of Federal Regulations Title 20, Chapter III, Part 404, Subpart J, Section 404.989: “Federal Old-Age, Survivors and Disability Insurance, Administrative Responsibilities, Good Cause for Reopening.” Accessed September 1, 2023 at <www.law.cornell.edu>
(a) We will find that there is good cause to reopen a determination or decision if—
(1) New and material evidence is furnished;
(2) A clerical error in the computation or recomputation of benefits was made; or
(3) The evidence that was considered in making the determination or decision clearly shows on its face that an error was made.
(b) We will not find good cause to reopen your case if the only reason for reopening is a change of legal interpretation or administrative ruling upon which the determination or decision was made.
[241] Report: “Social Security Administration: Cases of Federal Employees and Transportation Drivers and Owners Who Fraudulently and/or Improperly Received SSA Disability Payments.” U.S. Government Accountability Office, June 25, 2010. <www.gao.gov>
Page 2 (of PDF)::
GAO [U.S. Government Accountability Office] was asked to (1) determine whether federal employees and commercial drivers and company owners may be improperly receiving disability benefits and (2) develop case study examples of individuals who fraudulently and/or improperly receive these benefits. To do this, GAO compared DI [Disability Insurance] and SSI [Supplemental Security Income] benefit data to civilian payroll records of certain federal agencies and carrier/driver records from the Department of Transportation (DOT) and 12 selected states.
Page 6:
Created in 1972, the SSI program is a nationwide federal cash benefit program administered by SSA [the Social Security Administration] that provides a minimum level of income to financially needy individuals who are aged, blind, or considered eligible for benefits because of physical or mental impairments. Payments under the SSI program … and are funded from the government’s General Fund, which is financed through tax payments from the American public.
[242] Report: “Social Security Administration: Cases of Federal Employees and Transportation Drivers and Owners Who Fraudulently and/or Improperly Received SSA Disability Payments.” U.S. Government Accountability Office, June 25, 2010. <www.gao.gov>
Page 2 (of PDF): “SSA [Social Security Administration] currently does not perform a federal payroll or DOT [U.S. Department of Transportation] records match to identify individuals improperly receiving benefits.”
Page 34 (Appendix IV, Comments from the Social Security Administration): “While SSA conducts a match of its beneficiary file to IRS data for all wage earners, it does not match its records to Federal payroll or DOT data to potentially identify persons who may be improperly receiving benefits.”
Page 44 (General Accounting Office comments on the Social Security Administration’s letter dated May 28, 2010): “IRS provides summary earnings data for a calendar year. We have previously reported that the IRS earnings data used by SSA in its enforcement operations are typically 12 to 18 months old when SSA first receives them, thus making some overpayments inevitable.”
[243] Report: “Social Security Administration: Cases of Federal Employees and Transportation Drivers and Owners Who Fraudulently and/or Improperly Received SSA Disability Payments.” U.S. Government Accountability Office, June 25, 2010. <www.gao.gov>
Page 44 (General Accounting Office comments on the Social Security Administration’s letter dated May 28, 2010):
In the report, we identify those cases where SSA [Social Security Administration] has sent an overpayment notification letter to the individual. However, we do not believe that identifying fraudulent or improper payments after dollars have been disbursed is an effective internal control. Our work across the government has shown that once fraudulent or improper payments are made, the government is likely to only recover pennies on the dollar. Preventive controls are the most efficient and effective.
[244] Report: “Social Security Administration: Cases of Federal Employees and Transportation Drivers and Owners Who Fraudulently and/or Improperly Received SSA Disability Payments.” U.S. Government Accountability Office, June 25, 2010. <www.gao.gov>
Pages 7–8:
It is impossible to determine from data mining alone the extent to which beneficiaries improperly or fraudulently received disability payments. To adequately assess an individual’s work status, a detailed evaluation of all the facts and circumstances should be conducted. This evaluation would include contacting the beneficiary and the beneficiary’s employer, obtaining corroborating evidence such as payroll data and other financial records, and evaluating the beneficiary’s daily activities. …
Our analysis of federal civilian salary data and SSA [Social Security Administration] disability data found that about 7,000 individuals at selected agencies had been wage-earning employees for the federal government while receiving SSA disability benefits during fiscal year 2008. The exact number of individuals who may be improperly or fraudulently receiving SSA disability payments cannot be determined without detailed case investigations. Our analysis of federal salary data from October 2006 through December 2008 found that about 1,500 federal employees’ records indicate that they may be improperly receiving payments.11 The individuals were identified using the following criteria: (1) DI [Disability Insurance] beneficiaries who received more than 12 months of federal salary payments above the maximum SSA earnings threshold for the DI program (e.g., $940 per month for nonblind DI beneficiaries during calendar year 2008) after the start date of their disabilities12 or (2) SSI [Supplemental Security Income] recipients who received more than 2 months13 of federal salary above the maximum SSA earnings threshold for the SSI program after the start date of their disabilities.14 Based on their SSA benefit amounts, we estimate that these approximately 1,500 federal employees received about $1.7 million of payments monthly.15, 16 …
11 The actual estimate of federal employees who may be improperly receiving benefits was 1,487. …
16 Our estimate of federal employees with potential improper payment indicators is likely underestimated. It does not include salary payments that these individuals may have received outside of the federal government. Also, we had only the net pay amounts for federal employees disbursed by Department of the Treasury, not gross pay. For these employees the salary we used was reduced for deductions such as health insurance, income taxes, and other withholdings.
[245] Report: “Social Security Administration: Cases of Federal Employees and Transportation Drivers and Owners Who Fraudulently and/or Improperly Received SSA Disability Payments.” U.S. Government Accountability Office, June 25, 2010. <www.gao.gov>
Page 3:
9 The 12 selected states were California, Florida, Illinois, Kentucky, Maryland, Michigan, Minnesota, Montana, Tennessee, Texas, Virginia, and Wisconsin. The 12 states were selected primarily based on the size of the licensed commercial driver population. These 12 selected states represented about 42 percent of all commercial driver’s licenses contained in CDLIS [Commercial Driver License Information System].
Pages 9–10:
Our analysis of data from DOT [Department of Transportation] on commercial drivers and from SSA [Social Security Administration] on disability beneficiaries found that about 600,000 individuals had been issued CDLs [commercial driver’s licenses] and were receiving full Social Security disability benefits. The actual number of SSA disability beneficiaries with active CDLs cannot be determined for two reasons. First, states maintain the current status of CDLs, not DOT.17 Second, possession of a CDL does not necessarily indicate that the individual returned to work. Because federal regulations require interstate commercial drivers to be examined and certified by a licensed medical examiner to be able to physically drive a commercial vehicle once every 2 years, we selected a nonrepresentative selection of 12 states18 to determine how many SSA disability beneficiaries had CDLs issued after their disabilities were determined by SSA. Of the 600,000 CDL holders receiving Social Security disability benefits, about 144,000 of these individuals were from our 12 selected states. As figure 2 shows, about 62,000 of these 144,000 individuals, or about 43 percent, had CDLs that were issued after SSA determined that the individuals met the federal requirements for full disability benefits.
Page 7:
It is impossible to determine from data mining alone the extent to which beneficiaries improperly or fraudulently received disability payments. To adequately assess an individual’s work status, a detailed evaluation of all the facts and circumstances should be conducted. This evaluation would include contacting the beneficiary and the beneficiary’s employer, obtaining corroborating evidence such as payroll data and other financial records, and evaluating the beneficiary’s daily activities.
[246] Report: “Social Security Administration: Cases of Federal Employees and Transportation Drivers and Owners Who Fraudulently and/or Improperly Received SSA Disability Payments.” United States Government Accountability Office, June 25, 2010. <www.gao.gov>
Pages 3–4:
To illustrate actual cases of fraudulent payments and/or improper payments from our overall analysis, we nonrepresentatively selected 20 cases that illustrate the types of fraudulent and improper activity we found in SSA [Social Security Administration] disability programs. The 20 cases were primarily selected based on our analysis of SSA electronic and paper files for the higher overpayment amounts, the types of employment, and the locations of employment. Because this is a nonrepresentative selection, the results of these 20 case investigations cannot be projected to other federal employees, commercial drivers, or commercial vehicle owners who received SSA disability payments.
[247] Report: “Social Security Administration: Cases of Federal Employees and Transportation Drivers and Owners Who Fraudulently and/or Improperly Received SSA Disability Payments.” U.S. Government Accountability Office, June 25, 2010. <www.gao.gov>
Page 11: “[W]e nonrepresentatively selected 20 examples of federal employees, commercial drivers, and registrants of commercial vehicle companies who received disability payments fraudulently and/or improperly. … In each case, SSA’s [Social Security Administration] internal controls did not prevent improper and fraudulent payments….”
[248] Report: “Social Security Administration: Cases of Federal Employees and Transportation Drivers and Owners Who Fraudulently and/or Improperly Received SSA Disability Payments.” U.S. Government Accountability Office, June 25, 2010. <www.gao.gov>
Preface: “SSA [Social Security Administration] continued to improperly pay individuals who informed SSA of their employment.”
Page 11: “For 10 of the 20 cases, SSA continued to pay these individuals their SSA disability benefits through October 2009 primarily because the agency had not yet identified their ineligibility for benefits. For the other cases, SSA has terminated the disability benefits and has negotiated repayment agreements for 2 of those cases.”
Page 12:
Finally, our investigations found four cases with no evidence of fraud but, rather, of administrative error. In these situations, the beneficiaries told our investigators that they reported their employment to SSA and SSA had evidence in its files that such contact did occur. Thus, we concluded that SSA made improper payments to these individuals because SSA was aware of the employment but continued to make disability payments to those individuals.
NOTE: In at least one case, the SSA took action only after the U.S. Government Accountability Office informed them of the problem. [Page 19: “The SSA Office of Inspector General opened an investigation of the employee after we informed the agency of her employment status.”]
[249] Report: “Social Security Administration: Cases of Federal Employees and Transportation Drivers and Owners Who Fraudulently and/or Improperly Received SSA Disability Payments.” U.S. Government Accountability Office, June 25, 2010. <www.gao.gov>
Page 28: “For 18 cases, SSA [Social Security Administration] sent the SSA beneficiaries and recipients the $250 economic stimulus check.”
[250] Report: “Social Security Administration: Cases of Federal Employees and Transportation Drivers and Owners Who Fraudulently and/or Improperly Received SSA Disability Payments.” U.S. Government Accountability Office, June 25, 2010. <www.gao.gov>
Page 28: “For 10 cases, SSA [Social Security Administration] improperly increased the benefit amounts of the disability payments because the individuals had increases in the reported wages on which the disability benefit payments are based.”
Page 2 (of PDF): “Using a process called Automated Earnings Reappraisal Operations (AERO), SSA examined the earnings for several individuals and automatically increased these individuals’ disability payments because of raises in salary from their federal employment.”
Pages 12–13:
SSA has an automated process, called Automated Earnings Reappraisal Operations (AERO), that screens changes in an individual’s earnings record and uses that information to compute changes in the monthly disability benefit payment.21 However, SSA currently does not use AERO to identify individuals who return to work and alert SSA staff to review these individuals’ records for possible suspension of disability payments. As a result, SSA increased the monthly disability benefits of several individuals based on the higher wages the individuals’ current employers reported to the agency but did not properly suspend the payments to those individuals.
Page 26:
Case no. 18 Details …
• The beneficiary was a mail clerk for the U.S. Postal Service who worked in New York. The estimated overpayment was about $58,000. …
• In November 2006, SSA notified the beneficiary that based on wages earned in 2005 his benefits would be increased.
• In November 2007, SSA notified the beneficiary that based on wages earned in 2006 his benefits would be increased.
• In November 2008, SSA notified the beneficiary that based on wages earned in 2007 his benefits would be increased.
• As of October 2009, SSA continued to pay the beneficiary a monthly benefit of $1,775. SSA also sent the beneficiary a $250 economic stimulus payment.
[251] Report: “Social Security Administration: Cases of Federal Employees and Transportation Drivers and Owners Who Fraudulently and/or Improperly Received SSA Disability Payments.” U.S. Government Accountability Office, June 25, 2010. <www.gao.gov>
Page 19:
Case no. 8 Details …
• The beneficiary was a legal assistant for SSA [Social Security Administration] who worked in Arizona. The estimated overpayment was about $11,000.
• SSA approved DI [Disability Insurance] payments starting in 2003 for affective/mood disorders and osteoarthrosis.
• The beneficiary began working for SSA in the third quarter of 2007. …
• In November 2008, SSA notified the beneficiary that based on wages earned in 2007 her benefits would be increased.
• The SSA Office of Inspector General opened an investigation of the employee after we informed the agency of her employment status.
• According to SSA officials, SSA disability programs do not have access to SSA’s payroll records to determine whether their employees are receiving disability payments and thus should be evaluated for eligibility.
[252] Report: “Social Security Administration: Cases of Federal Employees and Transportation Drivers and Owners Who Fraudulently and/or Improperly Received SSA Disability Payments.” U.S. Government Accountability Office, June 25, 2010. <www.gao.gov>
Page 16:
Case no. 2 Details …
• The beneficiary was a Transportation Safety Administration screener who worked in California. The estimated overpayment was about $108,000;
• SSA [Social Security Administration] approved DI [Disability Insurance] payments starting in 1995 for mood and anxiety disorders;
• The beneficiary began full-time federal employment in 2003. …
• In November 2005, SSA notified the beneficiary that based on wages earned in 2004 her benefits would be increased. …
• In November 2007, SSA notified the beneficiary that based on wages earned in 2006 her benefits would be increased. …
• The beneficiary resides in a house that is currently listed for sale at about $1,800,000.
[253] Report: “Social Security Administration: Cases of Federal Employees and Transportation Drivers and Owners Who Fraudulently and/or Improperly Received SSA Disability Payments.” U.S. Government Accountability Office, June 25, 2010. <www.gao.gov>
Page 13:
Certain individuals who claim that they are unable to immediately repay the disability benefits they improperly received can be put on long-term repayment plans that span years or decades. Although SSA [Social Security Administration] has the authority to charge interest and penalties, SSA did not do so on these agreements. As a result, several individuals from our cases were placed in long-term, interest-free repayment plans for improperly accepting disability overpayments. For 1 of our 20 cases, SSA placed an individual on a repayment plan to repay approximately $33,000 in overpayments through $20 monthly installments. Based on this agreement, it will take over 130 years to repay this debt, exceeding the life expectancy for this individual.
Page 24:
• The beneficiary was a psychology aide for the Department of Veterans Affairs who worked in Florida. The estimated overpayment was about $33,000.
• SSA approved DI [Disability Insurance] payments starting in 1996 for muscular dystrophy. …
• In September 2008, SSA notified the beneficiary that “your disability has ended and you are not entitled to payments.” The notice stated that the trial work period ended in September 1998, 10 years prior.
• In November 2008, SSA notified the beneficiary that based on the wages he earned in 2007, it would be increasing his benefits. The agency also noted that it would send a payment of $4,478 on or about December 3, 2008, that would include the new regular monthly benefit, plus the difference between what SSA actually paid in 2008 and what it should have paid according to the wage increase.
• In January 2009, SSA notified the beneficiary that it had paid him $32,858 too much in benefits. SSA stated that he should refund this overpayment within 30 days. SSA placed the beneficiary in a repayment plan for $20 per month.
[254] Transcript: “NBC Nightly News” (6:30 PM ET). NBC, February 26, 2004.
BRIAN WILLIAMS reporting: Inside this small private elementary school in Manhattan, Mimi Baso came to work this morning thinking about retirement. She has no plans to retire but these days worries about getting back all the Social Security money she paid in.
Ms. MIMI BASO: I am entitled to the money. It’s my money. I’ve saved it.
NOTE: Just Facts has found numerous comments of this type scattered throughout the Internet. The following footnote provides an example of imprecise rhetoric from a politician that could establish and/or reinforce such beliefs.
[255] Webpage: “Presidential Statements, Jimmy Carter.” United States Social Security Administration. Accessed July 2, 2018 at <www.ssa.gov>
“Social Security Amendments of 1977 Written Statement on Signing S.305 Into Law. December 20, 1977 … Most importantly, it [the bill] … further assures today’s workers that the hard-earned taxes they are paying into the system today will be available upon their retirement.”
[256] Webpage: “What is Social Security?” National Academy of Social Insurance. Accessed August 29, 2023 at <www.nasi.org>
Social Security is largely a pay-as-you-go program. This means that today’s workers pay Social Security taxes into the program and money flows back out as monthly income to beneficiaries. As a pay-as-you-go system, Social Security differs from company pensions, which are “pre-funded.” In pre-funded retirement programs, the money is accumulated in advance so that it will be available to be paid out to today’s workers when they retire. The private plans need to be funded in advance to protect employees in case the company enters bankruptcy or goes out of business.
[257] Report: “How Pension Financing Affects Returns to Different Generations.” Congressional Budget Office, September 22, 2004. <www.cbo.gov>
Page 1:
A pension system designed to be self-sustaining can be financed in two basic ways: on a “funded” or on a “pay-as-you-go” basis. In a funded system, contributions are used to purchase assets, which are saved to pay for future benefits. (In the United States, private pension plans are required by law to be funded.) By contrast, in a pay-as-you-go system, such as Social Security,1 contributions by workers go directly to pay benefits to retirees.
1 In a pure pay-as-you-go system, revenues exactly equal outlays in each year. Social Security is not a pure pay-as-you-go system; its revenues (excluding interest on the balances in the two Social Security trust funds) currently exceed outlays by about 14 percent. That excess of revenues over outlays is temporary; beyond 2018, revenues are projected to fall short of outlays by increasing amounts. See Congressional Budget Office, The Outlook for Social Security (June 2004).
[258] Article: “Social Security and Private Saving: Theory and Historical Evidence.” By Selig D. Lesnoy and Dean R. Leimer. Social Security Administration Social Security Bulletin, January 1985. <www.ssa.gov>
Page 15:
But aside from a small contingency fund, the U.S. social security system is financed on a pay-as-you-go basis: contributions do not flow into the capital market; they are used to pay for the cost of current benefits.4
4 Since the social security system has not accumulated assets equal to the liability of promised future benefits, the social security wealth that individuals hold represents a claim against the earnings of future generations rather than a claim against existing real assets. No real capital corresponds to social security wealth.
[259] Pamphlet: “Understanding the Benefits.” United States Social Security Administration, January 2023. <www.ssa.gov>
Page 2:
The current Social Security system works like this: when you work, you pay taxes into Social Security. We use the tax money to pay benefits to:
• People who have already retired.
• People with qualifying disabilities.
• Survivors of workers who have died.
• Dependents of beneficiaries.
The money you pay in taxes isn’t held in a personal account for you to use when you get benefits. We use your taxes to pay people who are getting benefits right now. Any unused money goes to the Social Security trust funds, not a personal account with your name on it.
[260] Calculated with data from:
a) Dataset: “Old-Age and Survivors Insurance Trust Fund, 1937–2022.” United States Social Security Administration, Office of the Chief Actuary. Accessed August 15, 2023 at <www.ssa.gov>
b) Dataset: “Old-Age, Survivors, and Disability Insurance Trust Funds, 1957–2022.” United States Social Security Administration, Office of the Chief Actuary. Accessed August 15, 2023 at <www.ssa.gov>
NOTE: An Excel file containing the data and calculations is available upon request.
[261] Article: “Social Security and Private Saving: Theory and Historical Evidence.” By Selig D. Lesnoy and Dean R. Leimer. Social Security Administration Social Security Bulletin, January 1985. <www.ssa.gov>
Page 15:
But aside from a small contingency fund, the U.S. social security system is financed on a pay-as-you-go basis: contributions do not flow into the capital market; they are used to pay for the cost of current benefits.4
4 Since the social security system has not accumulated assets equal to the liability of promised future benefits, the social security wealth that individuals hold represents a claim against the earnings of future generations rather than a claim against existing real assets. No real capital corresponds to social security wealth.
[262] The following points provide important context for understanding the data and calculation in the next footnote:
[263] Calculated with data from the “2023 Annual Report of the Board of Trustees of the Federal Old-Age and Survivors Insurance and Disability Insurance Trust Funds.” United States Social Security Administration, March 28, 2023. <www.ssa.gov>
Page 7: “Table II.B1.—Summary of 2022 Trust Fund Financial Operations (In billions). … OASDI [Social Security] … Asset reserves at the end of 2022 … 2,829.9”
Page 211:
Table VI.F2.—Present Values Through the Infinite Horizon for Various Categories of Program Participants, Based on Intermediate Assumptions [Present values as of January 1, 2023; dollar amounts in trillions] …
present value of future cost for current participants [=] $95.7 …
present value of future dedicated tax income for current participants [=] $44.4 …
present value of future General Fund reimbursements through the infinite horizon a [=] d …
a Distribution of General Fund reimbursements among past, current, and future participants cannot be determined.
d Less than $50 billion
CALCULATION:
$95.7 trillion present value of future cost for current participants
– $44.4 trillion present value of future dedicated tax income for current participants
– $0.05 trillion present value of future general fund reimbursements over the infinite horizon
– $2.8299 trillion current value of the trust fund
= $48.42 trillion closed group unfunded obligation
[264] Webpage: “Debt to the Penny.” U.S. Department of the Treasury, Bureau of the Fiscal Service. Accessed August 29, 2023 at <fiscaldata.treasury.gov>
“8/28/2023 … Total Public Debt Outstanding [=] $32,814,443,005,564.85”
[265] Calculated with data from the “2023 Annual Report of the Board of Trustees of the Federal Old-Age and Survivors Insurance and Disability Insurance Trust Funds.” United States Social Security Administration, March 28, 2023. <www.ssa.gov>
Pages 63–64:
Table IV.B3.—Covered Workers and Beneficiaries, Calendar Years 1945–2100 … Historical data: … Covered workersa (in thousands) … 2022 [=] 180,510 … Beneficiariesb (in thousands) … OASDIc … 2022 [=] 65,614 …
b Beneficiaries with monthly benefits in current-payment status as of June 30.
c This column is the sum of OASI [Old-Age & Survivors Insurance] and DI [Disability Insurance] beneficiaries. A small number of beneficiaries receive benefits from both funds.
CALCULATION: $48,420,100,000,000 closed group unfunded obligation / (180,510,000 workers + 65,614,000 beneficiaries) = $196,731
[266] Webpage: “Supreme Court Case: Flemming vs. Nestor.” United States Social Security Administration. Accessed August 29, 2023 at <www.ssa.gov>
But like all federal entitlement programs, Congress can change the rules regarding eligibility—and it has done so many times over the years. The rules can be made more generous, or they can be made more restrictive. Benefits which are granted at one time can be withdrawn, as for example with student benefits, which were substantially scaled-back in the 1983 Amendments.
There has been a temptation throughout the program’s history for some people to suppose that their FICA [Federal Insurance Contributions Act] payroll taxes entitle them to a benefit in a legal, contractual sense. That is to say, if a person makes FICA contributions over a number of years, Congress cannot, according to this reasoning, change the rules in such a way that deprives a contributor of a promised future benefit. Under this reasoning, benefits under Social Security could probably only be increased, never decreased, if the Act could be amended at all. Congress clearly had no such limitation in mind when crafting the law. Section 1104 of the 1935 Act, entitled “Reservation of Power,” specifically said: “The right to alter, amend, or repeal any provision of this Act is hereby reserved to the Congress.” Even so, some have thought that this reservation was in some way unconstitutional. This is the issue finally settled by Flemming v. Nestor.
[267] Ruling: Flemming v. Nestor. U.S. Supreme Court, June 20, 1960. Decided 5–4. Majority: Harlan, Clark, Frankfurter, Stewart, Whittaker. Dissenting: Black. Separate dissent: Douglas. Separate Dissent: Brennan, Warren, Douglas. <caselaw.findlaw.com>
It is apparent that the noncontractual interest of an employee covered by the Act cannot be soundly analogized to that of the holder of an annuity, whose right to benefits is bottomed on his contractual premium payments. …
To engraft upon the Social Security system a concept of “accrued property rights” would deprive it of the flexibility and boldness in adjustment to ever-changing conditions which it demands. … It was doubtless out of an awareness of the need for such flexibility that Congress included in the original Act, and … has since retained, a clause expressly reserving to it “[t]he right to alter, amend, or repeal any provision” of the Act.…
We must conclude that a person covered by the Act has not such a right in benefit payments as would make every defeasance of “accrued” interests violative of the Due Process Clause of the Fifth Amendment.
[268] Comment by “Anonymous.” The Cunning Realist, March 12, 2009. <cunningrealist.blogspot.com>
NOTE: Just Facts has found numerous comments of this type scattered throughout the internet. The following footnote provides an example of imprecise rhetoric from a politician that could establish and/or reinforce such beliefs. The next two footnotes after that document the results of a poll that shows the prevalence of this belief.
[269] Article: “Government Statistics and Lies.” By Ron Paul. Campaign for Liberty, November 6, 2009. <archive.lewrockwell.com>
“I have introduced legislation to keep politicians in Washington from ever raiding the Social Security trust fund again. HR [House Resolution] 219 The Social Security Preservation Act would assure that all monies collected by the Social Security Trust Fund would only be used in payments to beneficiaries, or be placed in interest bearing certificates of deposit.”
[270] Article: “Scientific Survey Shows Voters Widely Accept Misinformation Spread by the Media.” By James D. Agresti. Just Facts, January 2, 2020. <www.justfacts.com>
[A] scientific survey commissioned by Just Facts shows that many people are indeed misinformed….
The survey was conducted by Triton Polling & Research, an academic research firm that serves scholars, corporations, and political campaigns. The responses were obtained through live telephone surveys of 700 likely voters across the United States during December 2–11, 2019. This sample size is large enough to accurately represent the U.S. population. Likely voters are people who say they vote “every time there is an opportunity” or in “most” elections.
The margin of sampling error for the total pool of respondents is ±4% with at least 95% confidence. The margins of error for the subsets are 6% for Democrat voters, 6% for Republican voters, 5% for males, 5% for females, 12% for 18 to 34 year olds, 5% for 35 to 64 year olds, and 6% for 65+ year olds.
The survey results presented in this article are slightly weighted to match the ages and genders of likely voters. The political parties and geographic locations of the survey respondents almost precisely match the population of likely voters. Thus, there is no need for weighting based upon these variables.
NOTE: For facts about what constitutes a scientific survey and the factors that impact their accuracy, visit Just Facts’ research on Deconstructing Polls & Surveys.
[271] Report: “Just Facts 2019 U.S. Nationwide Survey.” Just Facts, December 2019. <www.justfacts.com>
Page 5:
Do you think Social Security’s financial problems stem from politicians looting the program and spending the money on other programs?
|
Answer |
Total |
Political Preference |
|||
|
Democrat |
Trump |
Third-Party |
Unsure |
||
|
Yes |
76.3% |
67.8% |
83.6% |
74.4% |
77.1% |
|
No |
19.7% |
27.5% |
13.1% |
21.2% |
17.9% |
|
Unsure |
3.6% |
3.7% |
3.2% |
4.5% |
5.0% |
|
Refused |
0.4% |
1.0% |
0% |
0% |
0% |
NOTE: For facts about what constitutes a scientific survey and the factors that impact their accuracy, visit Just Facts’ research on Deconstructing Polls & Surveys.
[272] “2023 Annual Report of the Board of Trustees of the Federal Old-Age and Survivors Insurance and Disability Insurance Trust Funds.” United States Social Security Administration, March 28, 2023. <www.ssa.gov>
Page 161: “The Social Security Act prohibits payments from the OASI [Old-Age & Survivors Insurance] and DI [Disability Insurance] Trust Funds for any purpose not related to the payment of benefits or administrative costs for the OASDI [Social Security] program.”
Likewise, the U.S. Treasury Department publishes a “Monthly Statement of the Public Debt” that details the components of the national debt, including the amounts owed to the Social Security Trust Funds.# These amounts concur with the Social Security Administration’s data on receipts, expenditures, and assets.£
NOTES:
[274] Webpage: “Debunking Some Internet Myths: Myths and Misinformation About Social Security.” United States Social Security Administration. Accessed August 30, 2023 at <www.ssa.gov>
Starting in 1969 (due to action by the Johnson Administration in 1968) the transactions to the Trust Fund were included in what is known as the “unified budget.” This means that every function of the federal government is included in a single budget. This is sometimes described by saying that the Social Security Trust Funds are “on-budget.” This budget treatment of the Social Security Trust Fund continued until 1990 when the Trust Funds were again taken “off-budget.” This means only that they are shown as a separate account in the federal budget. But whether the Trust Funds are “on-budget” or “off-budget” is primarily a question of accounting practices—it has no effect on the actual operations of the Trust Fund itself.
[275] “2010 Annual Report of the Board of Trustees of the Federal Old-Age and Survivors Insurance and Disability Insurance Trust Funds.” Board of Trustees of the Federal OASDI Trust Funds, August 9, 2010. <www.ssa.gov>
Page 221: “Funds not withdrawn for current monthly or service benefits, the financial interchange, and administrative expenses are invested in interest-bearing Federal securities, as required by law; the interest earned is also deposited in the trust funds.”
[276] Webpage: “Debt Versus Deficit: What’s the Difference?” United States Department of the Treasury, Bureau of the Fiscal Service, August 5, 2004. <treasurydirect.gov>
“Additionally, the Government Trust Funds are required by law to invest accumulated surpluses in Treasury securities. The Treasury securities issued to the public and to the Government Trust Funds (intragovernmental holdings) then become part of the total debt.”
[277] United States Code Title 42, Chapter 7, Subchapter II, Section 401: “Social Security, Federal Old-Age, Survivors, and Disability Insurance Benefits, Trust Funds.” Accessed August 30, 2023 at <www.law.cornell.edu>
“It shall be the duty of the Managing Trustee to invest such portion of the Trust Funds as is not, in his judgment, required to meet current withdrawals. Such investments may be made only in interest-bearing obligations of the United States or in obligations guaranteed as to both principal and interest by the United States.”
[278] “Social Security Act of 1935.” United States Social Security Administration. Accessed August 31, 2023 at <www.ssa.gov>
Section 201(b):
It shall be the duty of the Secretary of the Treasury to invest such portion of the amounts credited to the [Social Security Old-Age Reserve] Account as is not, in his judgment, required to meet current withdrawals. Such investment may be made only in interest-bearing obligations of the United States or in obligations guaranteed as to both principal and interest by the United States.
NOTE: Also, as shown in the next two footnotes, an official Social Security Trust Fund was established in 1939.
[279] Webpage: “Reports & Studies, 1938 Advisory Council.” United States Social Security Administration. Accessed August 31, 2023 at <www.ssa.gov>
The Advisory Council of 1938 was important for several reasons. … [T]he recommendations of the [Social Security Advisory] Council were largely enacted into law in the 1939 Amendments.
The following is the text of the Report issued by the Council. …
The Advisory Council on Social Security was appointed by the Senate Special Committee on Social Security and the Social Security Board in May, 1937. …
Report …
At the time the Social Security Act was drafted it was deemed necessary for constitutional reasons to separate legally the taxation and benefit features of the program. It is believed that in the light of subsequent court decisions such legal separation is no longer necessary. Since the taxes levied are essentially contributions intended to finance the benefit program, it is not only logical but expedient to provide for automatic crediting of tax proceeds to the old age insurance fund. It is believed by the Council that such a procedure would enhance public understanding of the contributory insurance system. Since the tax proceeds thus credited are intended for payment of benefits, it is recommended that they be deposited in a trust fund under the control of designated trustees in accordance with appropriate legal provisions. The trust fund should be dedicated to the payment of benefits and, to a restricted amount, to the costs necessary to the administration of the program. It is recommended that these funds should continue to be invested in securities of the Federal government as at present. …
December 10, 1938.
[280] Public Law 379: “Social Security Act Amendments of 1939.” 76th U.S. Congress. Signed into law by Franklin Delano Roosevelt on August 10, 1939. <www.ssa.gov>
Sec. 201. (a) There is hereby created on the books of the Treasury of the United States a trust fund to be known as the “Federal Old-Age and Survivors Insurance Trust Fund” (hereinafter in this title called the “Trust Fund”). … There is hereby appropriated to the Trust Fund for the fiscal year ending June 30, 1941, and for each fiscal year thereafter, out of any moneys in the Treasury not otherwise appropriated, amounts equivalent to 100 per centum of the taxes (including interest, penalties, and additions to the taxes) received under the Federal Insurance Contributions Act and covered into the Treasury.
[281] Research note: “The Social Security Trust Funds and the Federal Budget.” By Larry DeWitt. U.S. Social Security Administration, Historian’s Office, March 4, 2005, Updated 6/18/07. <www.ssa.gov>
Finally, just note once again that the financing procedures involving the Social Security program have not changed in any fundamental way since they were established in the original Social Security Act of 1935 and amended in 1939. These changes in federal budgeting rules govern how the Social Security program is accounted for in the federal budget, not how it is financed.
[282] “2010 Annual Report of the Board of Trustees of the Federal Old-Age and Survivors Insurance and Disability Insurance Trust Funds.” Board of Trustees of the Federal OASDI Trust Funds, August 9, 2010. <www.ssa.gov>
Page 25: “The trust fund assets can be invested only in securities that are backed by the full faith and credit of the United States Government, as required by law.”
Page 221: “Funds not withdrawn for current monthly or service benefits, the financial interchange, and administrative expenses are invested in interest-bearing Federal securities, as required by law; the interest earned is also deposited in the trust funds.”
Page 5: “In 2009, the combined trust fund assets earned interest at an effective annual rate of 4.9 percent.”
[283] Webpage: “Social Security Trust Funds: Frequently Asked Questions.” U.S. Social Security Administration, Office of the Chief Actuary. Accessed August 31, 2023 at <www.ssa.gov>
Why do some people describe the “special issue” securities held by the trust funds as worthless IOUs? What is SSA’s [Social Security Administration’s] reaction to this criticism? …
… The government has always repaid Social Security, with interest.
[284] The Social Security Administration’s Office of the Chief Actuary publishes annual receipts, expenditures, and assets for both of the Social Security trust funds.† ‡ This data shows numerous years in which expenditures exceed receipts, and the trust funds decline (see the negative figures in the column “Net increase during the year”). In these years, the trust funds receive back monies that they loaned to federal government. If they did not receive this money, the program could not pay out its full benefits.
NOTES:
[285] “2023 Annual Report of the Board of Trustees of the Federal Old-Age and Survivors Insurance and Disability Insurance Trust Funds.” United States Social Security Administration, March 28, 2023. <www.ssa.gov>
Page 2: “Under the Trustees’ intermediate assumptions, Social Security’s total cost is projected to be higher than its total income in 2023 and all later years. Total cost began to be higher than total income in 2021. Social Security’s cost has exceeded its non-interest income since 2010.”
[286] Calculated with data from:
a) Dataset: “Old-Age and Survivors Insurance Trust Fund, 1937–2022.” United States Social Security Administration, Office of the Chief Actuary. Accessed August 15, 2023 at <www.ssa.gov>
b) Dataset: “Old-Age and Survivors Insurance Trust Fund Income, 1937–2022.” United States Social Security Administration, Office of the Chief Actuary. Accessed August 15, 2023 at <www.ssa.gov>
c) Dataset: “Disability Insurance Trust Fund, 1957–2022.” United States Social Security Administration, Office of the Chief Actuary. Accessed August 15, 2023 at <www.ssa.gov>
d) Dataset: “Disability Insurance Trust Fund Income, 1957–2022.” United States Social Security Administration, Office of the Chief Actuary. Accessed August 15, 2023 at <www.ssa.gov>
e) Dataset: “CPI—All Urban Consumers (Current Series).” U.S. Department of Labor, Bureau of Labor Statistics. Accessed January 27, 2023 at <www.bls.gov>
“Series Id: CUUR0000SA0; Series Title: All Items in U.S. City Average, All Urban Consumers, Not Seasonally Adjusted; Area: U.S. City Average; Item: All Items; Base Period: 1982–84=100”
NOTE: An Excel file containing the data and calculations is available upon request.
[287] See here.
[288] Webpage: “Debunking Some Internet Myths: Myths and Misinformation About Social Security.” U.S. Social Security Administration. Accessed August 30, 2023 at <www.ssa.gov>
Starting in 1969 (due to action by the Johnson Administration in 1968) the transactions to the Trust Fund were included in what is known as the “unified budget.” This means that every function of the federal government is included in a single budget. This is sometimes described by saying that the Social Security Trust Funds are “on-budget.” This budget treatment of the Social Security Trust Fund continued until 1990 when the Trust Funds were again taken “off-budget.” This means only that they are shown as a separate account in the federal budget. But whether the Trust Funds are “on-budget” or “off-budget” is primarily a question of accounting practices—it has no effect on the actual operations of the Trust Fund itself.
[289] Dataset: “Table VI.G7. Operations of the Combined OASI and DI Trust Funds, in CPI-Indexed 2023 Dollars, Calendar Years 1970–2100.” United States Social Security Administration, Office of the Chief Actuary. Accessed August 15, 2023 at <www.ssa.gov>
“The combined OASI [Old Age and Survivors Insurance] and DI [Disability Insurance] Trust Funds become depleted in 2034 under the intermediate assumptions and in 2031 under the high-cost assumptions, so estimates for later years are not shown.”
NOTE: The “combined OASI and DI Trust Funds” comprise the Social Security Trust Fund.
[290] “2023 Annual Report of the Board of Trustees of the Federal Old-Age and Survivors Insurance and Disability Insurance Trust Funds.” United States Social Security Administration, March 28, 2023. <www.ssa.gov>
Page 14: “Figure II.D2.—OASDI Income, Cost, and Expenditures as Percentages of Taxable Payroll [Under intermediate assumptions]”
NOTE: The “Cost” curve in Figure II.D2 exceeds the “Expenditures” curve for all years starting in 2033. This graph ends in 2100. For the years beyond this, see the following excerpt from the same report.
Page 19: “Extending the horizon beyond 75 years increases the measured unfunded obligation. Through the infinite horizon, the unfunded obligation, or shortfall, is equivalent to 4.6 percent of future taxable payroll or 1.4 percent of future GDP [gross domestic product].”
[291] Calculated with data from:
a) Dataset: “Old-Age, Survivors, and Disability Insurance Trust Funds Tax Rates, 1937–2019.” U.S. Social Security Administration, Office of the Chief Actuary. Accessed June 10, 2019 at <www.ssa.gov>
b) “Social Security Act of 1935.” United States Social Security Administration. Accessed June 10, 2019 at <www.ssa.gov>
Sections 801 and 804
c) Dataset: “Old-Age and Survivors Insurance Trust Fund, 1937–2018 [In Millions].” United States Social Security Administration, Office of the Chief Actuary. Accessed June 10, 2019 at <www.socialsecurity.gov>
d) Dataset: “Monthly Interest Rates, 1937–99 [Nominal Interest Rates on Special Issues].” U.S. Social Security Administration, Office of the Chief Actuary. Accessed June 10, 2019 at <www.ssa.gov>
e) Dataset: “Estimated Effective Interest Rates Earned by the Old-Age, Survivors, and Disability Insurance Trust Funds, 1940–1979.” U.S. Social Security Administration, Office of the Chief Actuary. Accessed June 10, 2019 at <www.ssa.gov>
f) Dataset: “Estimated Effective Interest Rates Earned by the Old-Age, Survivors, and Disability Insurance Trust Funds, 1980–2018.” U.S. Social Security Administration, Office of the Chief Actuary. Accessed June 10, 2019 at <www.ssa.gov>
g) Dataset: “Old-Age and Survivors Insurance Trust Fund Income, 1937–2018 [In Millions].” United States Social Security Administration, Office of the Chief Actuary. Accessed June 10, 2019 at <www.ssa.gov>
NOTES:
[292] “2010 Annual Report of the Board of Trustees of the Federal Old-Age and Survivors Insurance and Disability Insurance Trust Funds.” United States Social Security Administration, August 9, 2010. <www.ssa.gov>
Page 138:
The Federal Old-Age and Survivors Insurance (OASI) Trust Fund was established on January 1, 1940 as a separate account in the United States Treasury. The Federal Disability Insurance (DI) Trust Fund, another separate account in the United States Treasury, was established on August 1, 1956. All the financial operations of the OASI and DI programs are handled through these respective funds.
[293] “2010 Annual Report of the Board of Trustees of the Federal Old-Age and Survivors Insurance and Disability Insurance Trust Funds.” United States Social Security Administration, August 9, 2010. <www.ssa.gov>
Page 221: “Funds not withdrawn for current monthly or service benefits, the financial interchange, and administrative expenses are invested in interest-bearing Federal securities, as required by law; the interest earned is also deposited in the trust funds.”
[294] Webpage: “Debt Versus Deficit: What’s the Difference?” United States Department of the Treasury, Bureau of the Fiscal Service, August 5, 2004. <treasurydirect.gov>
“Additionally, the Government Trust Funds are required by law to invest accumulated surpluses in Treasury securities. The Treasury securities issued to the public and to the Government Trust Funds (intragovernmental holdings) then become part of the total debt.”
[295] “Social Security Act of 1935.” United States Social Security Administration. Accessed September 19, 2019 at <www.ssa.gov>
Title II, Section 201(b): “It shall be the duty of the Secretary of the Treasury to invest such portion of the amounts credited to the [Social Security Old-Age Reserve] Account as is not, in his judgment, required to meet current withdrawals. Such investment may be made only in interest-bearing obligations of the United States or in obligations guaranteed as to both principal and interest by the United States.”
[296] Report: “The Social Security Trust Funds and the Federal Budget.” By Larry DeWitt. U.S. Social Security Administration, Historian’s Office, March 4, 2005. Updated 6/18/07. <www.ssa.gov>
“Finally, just note once again that the financing procedures involving the Social Security program have not changed in any fundamental way since they were established in the original Social Security Act of 1935 and amended in 1939. These changes in federal budgeting rules govern how the Social Security program is accounted for in the federal budget, not how it is financed.”
[297] United States Code Title 42, Chapter 7, Subchapter II, Section 401: “Social Security, Federal Old-Age, Survivors, and Disability Insurance Benefits, Trust Funds.” Accessed August 30, 2023 at <www.law.cornell.edu>
“It shall be the duty of the Managing Trustee to invest such portion of the Trust Funds as is not, in his judgment, required to meet current withdrawals. Such investments may be made only in interest-bearing obligations of the United States or in obligations guaranteed as to both principal and interest by the United States.”
[298] “2010 Annual Report of the Board of Trustees of the Federal Old-Age and Survivors Insurance and Disability Insurance Trust Funds.” United States Social Security Administration, August 9, 2010. <www.ssa.gov>
Page 221: “Funds not withdrawn for current monthly or service benefits, the financial interchange, and administrative expenses are invested in interest-bearing Federal securities, as required by law; the interest earned is also deposited in the trust funds.”
[299] Webpage: “Debt Versus Deficit: What’s the Difference?” United States Department of the Treasury, Bureau of the Fiscal Service, August 5, 2004. <treasurydirect.gov>
“Additionally, the Government Trust Funds are required by law to invest accumulated surpluses in Treasury securities. The Treasury securities issued to the public and to the Government Trust Funds (intragovernmental holdings) then become part of the total debt.”
[300] United States Code Title 31, Subtitle III, Chapter 31, Subchapter II, Section 3123: “Payment of Obligations and Interest on the Public Debt.” Accessed August 31, 2023 at <www4.law.cornell.edu>
Section (a): “The faith of the United States Government is pledged to pay, in legal tender, principal and interest on the obligations of the Government issued under this chapter.”
[301] Report: “Federal Debt: Answers To Frequently Asked Questions, An Update.” U.S. Government Accountability Office, August 12, 2004. <www.gao.gov>
Pages 10–12:
Debt held by the public approximates current federal demand on credit markets. It represents a burden on today’s economy, and the interest paid on this debt represents a burden on current taxpayers. Federal borrowing from the public absorbs resources available for private investment and may put upward pressure on interest rates. Further, debt held by the public is the accumulation of what the federal government borrowed in the past and is reported as a liability on the balance sheet of the government’s consolidated financial statements.
In contrast, debt held by government accounts (intragovernmental debt) and the interest on it represent a claim on future resources. This debt performs largely an internal accounting function. Special federal securities credited to government accounts (primarily trust funds) represent the cumulative surpluses of these accounts that have been lent to the general fund. These transactions net out on the government’s consolidated financial statements. Debt issued to government accounts does not affect today’s economy and does not currently compete with the private sector for available funds in the credit market.
However, debt held by government accounts reflects a future burden on taxpayers and the economy. The special federal securities held in the accounts represent legal obligations of the Treasury and are guaranteed for principal and interest by the full faith and credit of the U.S. government. When a government account needs to pay expenditures exceeding its receipts from the public, the Treasury must provide cash to redeem debt held by the government account. For example, according to 2004 Trustees projections, the Social Security trust funds will have insufficient tax income to pay scheduled benefits by 2018. The trust funds will begin drawing on the Treasury to cover the cash deficit, first relying on interest income and eventually drawing down accumulated trust fund assets. The government must obtain cash to finance this spending in excess of earmarked tax receipts either through increased taxes, spending cuts, increased borrowing from the public, retiring less debt (if the unified budget is in surplus), or some combination thereof.
Because debt held by the trust funds is not equal to the future benefit costs implied by the current design of the programs, it cannot be seen as a measure of the government’s total future commitment to programs financed by trust funds. The projected accumulated balances held by trust funds can provide one signal about the underlying fiscal imbalances in these programs. Trust fund balances do not provide meaningful information about program sustainability. The critical question is whether the government as a whole can afford the benefits in the future and at what cost in terms of other claims on scarce resources.
[302] Report: “Federal Debt: Answers To Frequently Asked Questions, An Update.” U.S. Government Accountability Office, August 12, 2004. <www.gao.gov>
Page 39:
Over the long term, the costs of federal borrowing will be borne by tomorrow’s workers and taxpayers. Higher saving and investment in the nation’s capital stock—factories, equipment, and technology—increase the nation’s capacity to produce goods and services and generate higher income in the future. Increased economic capacity and rising incomes would allow future generations to more easily bear the burden of the federal government’s debt. Persistent deficits and rising levels of debt, however, reduce funds available for private investment in the United States and abroad. Over time, lower productivity and GDP [gross domestic product] growth ultimately may reduce or slow the growth of the living standards of future generations.
Page 41:
GAO’s [U.S. Government Accountability Office’s] long-term simulations show that absent policy actions aimed at deficit reduction, debt burdens of such magnitudes imply a substantial decline in national saving available to finance private investment in the nation’s capital stock. The fiscal paths simulated are ultimately unsustainable and would inevitably result in declining GDP and future living standards. Even before such effects, these debt paths would likely result in rising inflation, higher interest rates, and the unwillingness of foreign investors to invest in a weakening American economy.
[303] Report: “The 2014 Long-Term Budget Outlook.” Congressional Budget Office, July 2014. <www.cbo.gov>
Pages 12–13:
CBO [the Congressional Budget Office] has studied how waiting to resolve the long-term fiscal imbalance would affect various generations of the U.S. population. In 2010, CBO compared economic outcomes under a policy that would stabilize the debt-to-GDP [gross domestic product] ratio starting in 2015 with outcomes under a policy that would delay stabilizing the ratio until 2025.6 That analysis suggested that generations born after about 2015 would be worse off if action to stabilize the debt-to-GDP ratio was postponed to 2025. People born before 1990, however, would be better off if action was delayed—largely because they would partly or entirely avoid the policy changes needed to stabilize the debt—and generations born between 1990 and 2015 could either gain or lose from a delay, depending on the details of the policy changes.7
6 See Congressional Budget Office, Economic Impacts of Waiting to Resolve the Long-Term Budget Imbalance (December 2010), <www.cbo.gov>. That analysis was based on a projection of slower growth in debt than CBO now projects, so the estimated effects of a similar policy today would be close, but not identical, to the effects estimated in that earlier analysis.
7 Those conclusions do not incorporate the possible negative effects of a fiscal crisis or effects that might arise from the government’s reduced flexibility to respond to unexpected challenges.
[304] Report: “Analytical Perspectives: Budget of the United States Government, Fiscal Year 2005.” White House Office of Management and Budget, February 2004. <fraser.stlouisfed.org>
Page 339: “The main financing component of the Federal funds group is the general fund, which is used to carry out the general purposes of Government rather than being restricted by law to a specific program. It consists of all collections not earmarked by law to finance other funds, including virtually all income taxes and many excise taxes….”
[305] “2010 Annual Report of the Board of Trustees of the Federal Old-Age and Survivors Insurance and Disability Insurance Trust Funds.” Board of Trustees of the Federal OASDI Trust Funds, August 9, 2010. <www.ssa.gov>
Page 142: “The Social Security Act does not permit expenditures from the OASI [Old-Age & Survivors Insurance] and DI [Disability Insurance] Trust Funds for any purpose not related to the payment of benefits or administrative costs for the OASDI [Social Security] program.”
[306] The table below shows the average federal general revenue taxes paid by various income groups in 2019, prior to the Covid-19 pandemic†:
|
Average Federal General Revenue Taxes (2019) |
|||
|
Household Income Group |
Full Income |
Effective Tax Rate |
Taxes Per Household |
|
Lowest 20% |
$39,100 |
–6.0% |
–$2,359 |
|
Second 20% |
$59,600 |
–0.7% |
–$424 |
|
Middle 20% |
$85,500 |
3.9% |
$3,300 |
|
Fourth 20% |
$124,900 |
7.0% |
$8,682 |
|
Highest 20% |
$333,100 |
17.6% |
$58,658 |
|
81st–90th% |
$181,300 |
10.2% |
$18,552 |
|
91st–95th% |
$250,400 |
13.0% |
$32,523 |
|
96th–99th% |
$417,400 |
17.6% |
$73,428 |
|
Top 1% |
$1,998,700 |
27.6% |
$551,879 |
The figures above were calculated with data from:
a) Dataset: “The Distribution of Household Income, 2019.” Congressional Budget Office, November 2022. <www.cbo.gov>
“Table 3. Average Household Income, by Income Source and Income Group, 1979 to 2019, 2019 Dollars”
“Table 7. Components of Federal Taxes, by Income Group, 1979 to 2019, 2019 Dollars”
b) Dataset: “Table 2.4 – Composition of Social Insurance and Retirement Receipts and of Excise Taxes: 1940–2027.” Executive Office of the President of the United States, Office of Management and Budget, March 28, 2022. <www.govinfo.gov>
c) Encyclopedia of Taxation & Tax Policy. Edited by Joseph J. Cordes and others. Urban Institute Press, 2005.
Page 469: “Spending from the general fund is financed by general revenues, which include the individual and corporation income taxes, some excise taxes, estate and gift taxes, tariffs, and miscellaneous receipts.”
d) Report: “Present Law and Background Information on Federal Excise Taxes.” United States Congress, Joint Committee on Taxation, January 2011. <www.jct.gov>
Page 1: “Revenues from certain Federal excise taxes are dedicated to trust funds (e.g., the Highway Trust Fund) for designated expenditure programs, and revenues from other excise taxes (e.g., alcoholic beverages) go to the General Fund for general purpose expenditures.”
NOTES:
“11 Mar 2020: Deeply concerned both by the alarming levels of spread and severity, and by the alarming levels of inaction, WHO made the assessment that Covid-19 could be characterized as a pandemic.”
[307] Report: “The Distribution of Household Income, 2019.” Congressional Budget Office, November 2022. <www.cbo.gov>
Page 16:
In this analysis, federal taxes consist of individual income taxes, payroll taxes, corporate income taxes, and excise taxes. The taxes allocated to households in the analysis account for approximately 93 percent of all federal revenues collected in 2019.12 …
… Among households in the lowest two quintiles, individual income taxes are negative, on average, because they include refundable tax credits, which can result in net payments from the government.
12 The remaining federal revenue sources not allocated to U.S. households include states’ deposits for unemployment insurance, estate and gift taxes, net income earned by the Federal Reserve System, customs duties, and miscellaneous fees and fines.
Pages 33–34:
Data
The core data used in CBO’s [Congressional Budget Office’s] distributional analyses come from the Statistics of Income (SOI), a nationally representative sample of individual income tax returns collected by the Internal Revenue Service (IRS). The number of returns sampled grew over the period studied—1979 to 2019—rising from roughly 90,000 in some of the early years to more than 350,000 in later years. That sample of tax returns becomes available to CBO approximately two years after the returns are filed. …
Information from tax returns is supplemented with data from the Annual Social and Economic Supplement of the Census Bureau’s Current Population Survey (CPS), which contains survey data on the demographic characteristics and income of a large sample of households.5 The two sources are combined by statistically matching each SOI record to a corresponding CPS record on the basis of demographic characteristics and income. Each pairing results in a new record that takes on some characteristics of the CPS record and some characteristics of the SOI record.6
Page 35:
Measures of Income, Federal Taxes, and Means-Tested Transfers
Most distributional analyses rely on a measure of annual income as the metric for ranking households. In CBO’s analyses, information on taxable income sources for tax-filing units that file individual income tax returns comes from the SOI, whereas information on nontaxable income sources and income for tax-filing units that do not file individual income tax returns comes from the CPS. Among households at the top of the distribution, the majority of income data are drawn from the SOI. In contrast, among households in the lower and middle quintiles, a larger portion of income data is drawn from the CPS….
Pages 39–40:
Household income, unless otherwise indicated, refers to income before accounting for the effects of means-tested transfers and federal taxes. Throughout this report, that income concept is called income before transfers and taxes. It consists of market income plus social insurance benefits.
Market income consists of the following:
• Labor income. Wages and salaries, including those allocated by employees to 401(k) and other employment-based retirement plans; employer-paid health insurance premiums (as measured by the Census Bureau’s Current Population Survey); the employer’s share of Social Security, Medicare, and federal unemployment insurance payroll taxes; and the share of corporate income taxes borne by workers.
• Business income. Net income from businesses and farms operated solely by their owners, partnership income, and income from S corporations.
• Capital income (including capital gains). Net profits realized from the sale of assets (but not increases in the value of assets that have not been realized through sales); taxable and tax-exempt interest; dividends paid by corporations (but not dividends from S corporations, which are considered part of business income); positive rental income; and the share of corporate income taxes borne by capital owners.†
• Other income sources. Income received in retirement for past services and other nongovernmental sources of income.
Social insurance benefits consist of benefits from Social Security (Old Age, Survivors, and Disability Insurance), Medicare (measured by the average cost to the government of providing those benefits), unemployment insurance, and workers’ compensation.
Means-tested transfers are cash payments and in-kind services provided through federal, state, and local government assistance programs. Eligibility to receive such transfers is determined primarily on the basis of income, which must be below certain thresholds. Means-tested transfers are provided through the following programs: Medicaid and the Children’s Health Insurance Program (measured by the average cost to the government of providing those benefits); the Supplemental Nutrition Assistance Program (formerly known as the Food Stamp program); housing assistance programs; Supplemental Security Income; Temporary Assistance for Needy Families and its predecessor, Aid to Families With Dependent Children; child nutrition programs; the Low Income Home Energy Assistance Program; and state and local government general assistance programs.
Average means-tested transfer rates are calculated as means-tested transfers divided by income before transfers and taxes.
Federal taxes consist of individual income taxes, payroll (or social insurance) taxes, corporate income taxes, and excise taxes. Those four sources accounted for 93 percent of federal revenues in fiscal year 2019. Revenue sources not examined in this report include states’ deposits for unemployment insurance, estate and gift taxes, net income of the Federal Reserve System that is remitted to the Treasury, customs duties, and miscellaneous fees and fines.
In this analysis, taxes for a given year are the amount a household owes on the basis of income received that year, regardless of when the taxes are paid. Those taxes comprise the following:
• Individual income taxes. Individual income taxes are paid by U.S. citizens and residents on their income from all sources, except those sources exempted under the law. Individual income taxes can be negative because they include the effects of refundable tax credits, which can result in net payments from the government. Specifically, if the amount of a refundable tax credit exceeds a filer’s tax liability before the credit is applied, the government pays that excess to the filer. Statutory marginal individual income tax rates are the rates set in law that apply to the last dollar of income.
• Payroll taxes. Payroll taxes are levied primarily on wages and salaries and generally have a single rate and few exclusions, deductions, or credits. Payroll taxes include those that fund the Social Security trust funds, the Medicare trust fund, and unemployment insurance trust funds. The federal portion of the unemployment insurance payroll tax covers only administrative costs for the program; state-collected unemployment insurance payroll taxes are not included in the Congressional Budget Office’s measure of federal taxes (even though they are recorded as revenues in the federal budget). Households can be entitled to future social insurance benefits, including Social Security, Medicare, and unemployment insurance, as a result of paying payroll taxes. In this analysis, average payroll tax rates capture the taxes paid in a given year and do not capture the benefits households may receive in the future.
• Corporate income taxes. Corporate income taxes are levied on the profits of U.S.-based corporations organized as C corporations. In its analysis, CBO allocated 75 percent of corporate income taxes in proportion to each household’s share of total capital income (including capital gains) and 25 percent to households in proportion to their share of labor income.
• Excise taxes. Sales of a wide variety of goods and services are subject to federal excise taxes. Most revenues from excise taxes are attributable to the sale of motor fuels (gasoline and diesel fuel), tobacco products, alcoholic beverages, and aviation-related goods and services (such as aviation fuel and airline tickets).
Average federal tax rates are calculated as federal taxes divided by income before transfers and taxes.
Income after transfers and taxes is income before transfers and taxes plus means-tested transfers minus federal taxes.
Income groups are created by ranking households by their size-adjusted income before transfers and taxes. A household consists of people sharing a housing unit, regardless of their relationships. The income quintiles (fifths) contain approximately the same number of people but slightly different numbers of households…. Similarly, each full percentile (hundredth) contains approximately the same number of people but a different number of households. If a household has negative income (that is, if its business or investment losses are larger than its other income), it is excluded from the lowest income group but included in totals.
NOTE: † See Just Facts’ research on the distribution of the federal tax burden for details about how the Congressional Budget Office determines the share of corporate income taxes borne by workers and owners of capital.
[308] Economists typically use a “comprehensive measure of income” to calculate effective tax rates, because this provides a complete “measure of ability to pay” taxes.† In keeping with this, Just Facts determines effective tax rates by dividing all measurable taxes by all income. The Congressional Budget Office (CBO) previously did the same,‡ but in 2018, CBO announced that it would exclude means-tested transfers from its measures of income and effective tax rates.§ #
Given this change, Just Facts now uses CBO data to determine comprehensive income and effective tax rates by adding back the means-tested transfers that CBO publishes but takes out of these measures. To do this, Just Facts makes a simplifying assumption that households in various income quintiles do not significantly change when these transfers are added. This is mostly true, but as CBO notes:
Almost one-fifth of the households in the lowest quintile of income before transfers and taxes would have been in higher quintiles if means-tested transfers were included in the ranking measure (see Table 5). Because net movement into a higher income quintile entails a corresponding net movement out of those quintiles, more than one-fifth of the households in the second quintile of income before transfers and taxes would have been bumped down into the bottom before-tax income quintile. Because before-tax income excludes income in the form of means-tested transfers, almost one-fifth of the people in the lowest quintile of income before transfers and taxes were in higher before-tax income quintiles. There is no fundamental economic change represented by those changes in income groups—just a change in the income definition used to rank households. Because means-tested transfers predominantly go to households in the lower income quintiles, there is not much shuffling across income quintile thresholds toward the top of the distribution.§
NOTES:
[309] The table below shows the average federal general revenue taxes paid by various income groups in 2020—amid Covid-19 government lockdowns and intensified social spending† ‡ §:
|
Average Federal General Revenue Taxes (2020) |
|||
|
Household Income Group |
Full Income |
Effective Tax Rate |
Taxes Per Household |
|
Lowest 20% |
$42,200 |
–13.7% |
–$5,798 |
|
Second 20% |
$63,600 |
–6.7% |
–$4,230 |
|
Middle 20% |
$90,500 |
–1.4% |
–$1,295 |
|
Fourth 20% |
$131,800 |
3.6% |
$4,739 |
|
Highest 20% |
$360,900 |
17.1% |
$61,609 |
|
81st–90th% |
$191,500 |
8.2% |
$15,707 |
|
91st–95th% |
$265,100 |
12.0% |
$31,775 |
|
96th–99th% |
$440,000 |
17.3% |
$76,077 |
|
Top 1% |
$2,291,800 |
27.6% |
$633,629 |
The figures above were calculated with data from:
a) Dataset: “The Distribution of Household Income, 2020.” Congressional Budget Office, November 2023. <www.cbo.gov>
“Table 3. Average Household Income, by Income Source and Income Group, 1979 to 2020, 2020 Dollars”
“Table 7. Components of Federal Taxes, by Income Group, 1979 to 2020, 2020 Dollars”
b) Dataset: “Table 2.4 – Composition of Social Insurance and Retirement Receipts and of Excise Taxes: 1940–2028.” Executive Office of the President of the United States, Office of Management and Budget, March 13, 2023. <www.govinfo.gov>
c) The Encyclopedia of Taxation & Tax Policy. Edited by Joseph J. Cordes and others. Urban Press Institute, 2005.
Page 469: “Spending from the general fund is financed by general revenues, which include the individual and corporation income taxes, some excise taxes, estate and gift taxes, tariffs, and miscellaneous receipts.”
d) Report: “Present Law and Background Information on Federal Excise Taxes.” United States Congress, Joint Committee on Taxation, January 2011. <www.jct.gov>
Page 1: “Revenues from certain Federal excise taxes are dedicated to trust funds (for example, the Highway Trust Fund) for designated expenditure programs, and revenues from other excise taxes (for example, alcoholic beverages) go to the General Fund for general purpose expenditures.”
NOTES:
Page 1: “To reduce the spread of coronavirus disease 2019 (Covid-19), nearly all states have issued stay-at-home orders and shut down establishments deemed nonessential.”
“Throughout the pandemic, officials across the United States have rolled out a patchwork of restrictions on social distancing, masking and other aspects of public life. The orders vary by state, county and even city. At the height of restrictions in late March and early April 2020, more than 310 million Americans were under directives ranging from “shelter in place” to “stay at home.” Restrictions are now ramping down in many places, as most states have fully reopened their economies.”
Calculated with data from:
a) Report: “CBO Estimate for H.R. 6074, the Coronavirus Preparedness and Response Supplemental Appropriations Act, 2020, as Posted on March 4, 2020.” Congressional Budget Office, March 4, 2020. <www.cbo.gov>
b) Report: “Cost Estimate for H.R. 6201, Families First Coronavirus Response Act, Enacted as Public Law 116-127 on March 18, 2020.” Congressional Budget Office, April 2, 2020. <www.cbo.gov>
c) Report: “Cost Estimate for H.R. 748, CARES Act, Public Law 116-136.” Congressional Budget Office, April 16, 2020. <www.cbo.gov>
d) Report: “CBO Estimate for H.R. 266, the Paycheck Protection Program and Health Care Enhancement Act as Passed by the Senate on April 21, 2020.” Congressional Budget Office, April 22, 2020. <www.cbo.gov>
e) Report: “Estimate for Division N—Additional Coronavirus Response and Relief, H.R. 133, Consolidated Appropriations Act, 2021, Public Law 116-260, Enacted on December 27, 2020.” Congressional Budget Office, January 14, 2021. <www.cbo.gov>
f) Report: “Estimated Budgetary Effects of H.R. 1319, American Rescue Plan Act of 2021 as Passed by the Senate on March 6, 2021.” Congressional Budget Office, March 10, 2021. <www.cbo.gov>
g) Dataset: “HH-1. Households by Type: 1940 to Present.” U.S. Census Bureau, Current Population Survey, November 2021. <www.census.gov>
An Excel file containing the data and calculations is available upon request.
[310] Report: “The Distribution of Household Income, 2020.” Congressional Budget Office, November 2023. <www.cbo.gov>
Page 8:
In this analysis, federal taxes consist of individual income taxes, payroll taxes, corporate income taxes, and excise taxes.7 Taken together, those taxes accounted for over 90 percent of all federal revenues collected in 2020. Among the sources of revenues, individual income taxes and payroll taxes are the largest, followed by corporate taxes and excise taxes.8
7 The remaining federal revenue sources not allocated to U.S. households are states’ deposits for unemployment insurance, estate and gift taxes, net income earned by the Federal Reserve System, customs duties, and miscellaneous fees and fines.
Pages 31–32: “Individual income taxes can be negative because they include the effects of refundable tax credits, which can result in net payments from the government. Specifically, if the amount of a refundable tax credit exceeds a filer’s tax liability before the credit is applied, the government pays that excess to the filer.”
Page 20:
Data
The core data used in CBO’s distributional analyses come from the Statistics of Income (SOI), a nationally representative sample of individual income tax returns collected by the IRS. That sample of tax returns becomes available to CBO approximately two years after the returns are filed. Data on household income are systematically and consistently reported in the SOI. The sample is therefore considered a reliable resource to use when analyzing the effects of fiscal policy on income. However, certain types of income are not reported in the SOI. In 2020, for example, the portion of payments from the Paycheck Protection Program that was not used to pay for employees’ wages was not taxable and therefore not available in the SOI data.
SOI data include information about tax filers’ family structure and age, but they do not include certain demographic information or data on people who do not file taxes. For that information, CBO uses data from the Annual Social and Economic Supplement of the Census Bureau’s Current Population Survey (CPS), which has data on the demographic characteristics and income of a large sample of households.6
CBO combines the two data sources, statistically matching each SOI record to a corresponding CPS record on the basis of demographic characteristics and income. Each pairing results in a new record that takes on some characteristics of the CPS record and some characteristics of the SOI record.7
Page 22:
Measures of Income, Federal Taxes, and Means-Tested Transfers
Most distributional analyses rely on a measure of annual income as the metric for ranking households. In CBO’s analyses of the distribution of household income, information about taxable income sources for tax-filing units that file individual income tax returns comes from the SOI, whereas information about nontaxable income sources and income for tax-filing units that do not file individual income tax returns comes from the CPS. Among households at the top of the income distribution, the majority of income data are drawn from the SOI. In contrast, among households in the lower and middle quintiles, a larger portion of income data is drawn from the CPS….
Pages 31–32:
Household income, unless otherwise indicated, refers to income before the effects of means-tested transfers and federal taxes are accounted for. Throughout this report, that income concept is called income before transfers and taxes. It consists of market income plus social insurance benefits.
Market income consists of the following five elements:
• Labor income. Wages and salaries, including those allocated by employees to 401(k) and other employment-based retirement plans; employer-paid health insurance premiums (as measured by the Census Bureau’s Current Population Survey); the employer’s share of payroll taxes for Social Security, Medicare, and federal unemployment insurance; and the share of corporate income taxes borne by workers.
• Business income. Net income from businesses and farms operated solely by their owners, partnership income, and income from S corporations.
• Capital gains. Net profits realized from the sale of assets (but not increases in the value of assets that have not been realized through sales).
• Capital income. Taxable and tax-exempt interest, dividends paid by corporations (but not dividends from S corporations, which are considered part of business income), rental income, and the share of corporate income taxes borne by capital owners.
• Other income sources. Income received in retirement for past services and other nongovernmental sources of income.
Social insurance benefits consist of benefits from Social Security (Old Age, Survivors, and Disability Insurance), Medicare (measured by the average cost to the government of providing those benefits), regular unemployment insurance (but not expanded unemployment compensation), and workers’ compensation.
Means-tested transfers are cash payments and in-kind services provided through federal, state, and local government assistance programs. Eligibility to receive such transfers is determined primarily on the basis of income, which must be below certain thresholds. Means-tested transfers are provided through the following programs: Medicaid and the Children’s Health Insurance Program (measured by the average cost to the federal government and state governments of providing those benefits); the Supplemental Nutrition Assistance Program (formerly known as the Food Stamp program); housing assistance programs; Supplemental Security Income; Temporary Assistance for Needy Families and its predecessor, Aid to Families With Dependent Children; child nutrition programs; the Low Income Home Energy Assistance Program; and state and local governments’ general assistance programs. For 2020, CBO included expanded unemployment compensation in means-tested transfers.
Average means-tested transfer rates are calculated as means-tested transfers (totaled within an income group) divided by income before transfers and taxes (totaled within an income group).
Federal taxes consist of individual income taxes, payroll (or social insurance) taxes, corporate income taxes, and excise taxes. Those four sources accounted for 94 percent of federal revenues in fiscal year 2020. Revenue sources not examined in this report include states’ deposits for unemployment insurance, estate and gift taxes, net income of the Federal Reserve System that is remitted to the Treasury, customs duties, and miscellaneous fees and fines.
In this analysis, taxes for a given year are the amount a household owes on the basis of income received in that year, regardless of when the taxes are paid. Those taxes comprise the following four categories:
• Individual income taxes. Individual income taxes are levied on income from all sources, except those excluded by law. Individual income taxes can be negative because they include the effects of refundable tax credits (including recovery rebate credits), which can result in net payments from the government. Specifically, if the amount of a refundable tax credit exceeds a filer’s tax liability before the credit is applied, the government pays that excess to the filer. Statutory marginal individual income tax rates are the rates set in law that apply to the last dollar of income.
• Payroll taxes. Payroll taxes are levied primarily on wages and salaries. They generally have a single rate and few exclusions, deductions, or credits. Payroll taxes include those that fund the Social Security trust funds, the Medicare trust fund, and unemployment insurance trust funds. The federal portion of the unemployment insurance payroll tax covers only administrative costs for the program; state-collected unemployment insurance payroll taxes are not included in the Congressional Budget Office’s measure of federal taxes (even though they are recorded as revenues in the federal budget). Households can be entitled to future social insurance benefits, including Social Security, Medicare, and unemployment insurance, as a result of paying payroll taxes. In this analysis, average payroll tax rates capture the taxes paid in a given year and do not capture the benefits that households may receive in the future.
• Corporate income taxes. Corporate income taxes are levied on the profits of U.S.–based corporations organized as C corporations. In this analysis, CBO allocated 75 percent of corporate income taxes in proportion to each household’s share of total capital income (including capital gains) and 25 percent to households in proportion to their share of labor income.
• Excise taxes. Sales of a wide variety of goods and services are subject to federal excise taxes. Most revenues from excise taxes are attributable to the sale of motor fuels (gasoline and diesel fuel), tobacco products, alcoholic beverages, and aviation-related goods and services (such as aviation fuel and airline tickets).
Average federal tax rates are calculated as federal taxes (totaled within an income group) divided by income before transfers and taxes (totaled within an income group).
Income after transfers and taxes is income before transfers and taxes plus means-tested transfers minus federal taxes.
Income groups are created by ranking households by their size-adjusted income before transfers and taxes. A household consists of people sharing a housing unit, regardless of their relationship. The income quintiles (or fifths of the distribution) contain approximately the same number of people but slightly different numbers of households…. Similarly, each full percentile (or hundredth of the distribution) contains approximately the same number of people but a different number of households. If a household has negative income (that is, if its business or investment losses exceed its other income), it is excluded from the lowest income group but included in totals.
NOTE: † See Just Facts’ research on the distribution of the federal tax burden for details about how the Congressional Budget Office determines the share of corporate income taxes borne by workers and owners of capital.
[311] Economists typically use a “comprehensive measure of income” to calculate effective tax rates because this provides a complete “measure of ability to pay” taxes.† In keeping with this, Just Facts determines effective tax rates by dividing all measurable taxes by all income. The Congressional Budget Office (CBO) previously did the same,‡ but in 2018, CBO announced that it would exclude means-tested transfers from its measures of income and effective tax rates.§ #
Given this change, Just Facts now uses CBO data to determine comprehensive income and effective tax rates by adding back the means-tested transfers that CBO publishes but takes out of these measures. To do this, Just Facts makes a simplifying assumption that households in various income quintiles do not significantly change when these transfers are added. This is mostly true, but as CBO notes:
Almost one-fifth of the households in the lowest quintile of income before transfers and taxes would have been in higher quintiles if means-tested transfers were included in the ranking measure (see Table 5). Because net movement into a higher income quintile entails a corresponding net movement out of those quintiles, more than one-fifth of the households in the second quintile of income before transfers and taxes would have been bumped down into the bottom before-tax income quintile. Because before-tax income excludes income in the form of means-tested transfers, almost one-fifth of the people in the lowest quintile of income before transfers and taxes were in higher before-tax income quintiles. There is no fundamental economic change represented by those changes in income groups—just a change in the income definition used to rank households. Because means-tested transfers predominantly go to households in the lower income quintiles, there is not much shuffling across income quintile thresholds toward the top of the distribution.§
NOTES:
[312] Calculated with data from:
a) Dataset: “Historical Budget Data, Revenues, by Major Source, Since 1962.” Congressional Budget Office, February 2023. <www.cbo.gov>
b) Report: “Analytical Perspectives: Budget of the U.S. Government, Fiscal Year 2024.” White House, Office of Management and Budget, March 13, 2023. <www.govinfo.gov>
Pages 192–194: “Table 17–3. Receipts by Source (In millions of dollars) … 2022 Actual … Source … Excise taxes … Total, Federal [general] funds [=] 24,064 … Total, Excise taxes [=] 87,728”
NOTE: An Excel file containing the data and calculations is available upon request.
[313] Report: “Monthly Statement of the Public Debt of the United States.” U.S. Treasury, Bureau of the Fiscal Service, December 31, 2022. <www.justfacts.com>
Page 13: “Table III–Detail of Treasury Securities Outstanding, December 31, 2022 … Amounts in Millions of Dollars … Current Month Outstanding … Federal Disability Insurance Trust Fund [=] 114,679 … Federal Old-Age and Survivors Insurance Trust Fund [=] 2,723,601”
NOTE: The sum of these trust funds sometimes differs by about 0.01% from data provided by the Social Security Trustees Report. This may be due to varying accounting conventions or rounding errors.
[314] “2023 Annual Report of the Board of Trustees of the Federal Old-Age and Survivors Insurance and Disability Insurance Trust Funds.” United States Social Security Administration, March 28, 2023. <www.ssa.gov>
Page 7: “Table II.B1.—Summary of 2022 Trust Fund Financial Operations (In billions). … OASDI [Social Security] … Asset reserves at the end of 2022 … 2,829.9”
[315] Calculated with data from:
a) “2023 Annual Report of the Board of Trustees of the Federal Old-Age and Survivors Insurance and Disability Insurance Trust Funds.” United States Social Security Administration, March 28, 2023. <www.ssa.gov>
Page 7: “Table II.B1.—Summary of 2022 Trust Fund Financial Operations (In billions). … OASDI [Social Security] … Asset reserves at the end of 2022 … 2,829.9”
b) Dataset: “Monthly Population Estimates for the United States: April 1, 2020 to December 1, 2023.” U.S. Census Bureau, Population Division, December 2022. <www2.census.gov>
“Resident Population … December 1, 2022 [=] 334,106,462”
c) Dataset: “Average Number of People per Household, by Race and Hispanic Origin1, Marital Status, Age, and Education of Householder: 2022.” U.S. Census Bureau, November 2022. <www2.census.gov>
“Total households (in thousands) [=] 131,202”
CALCULATIONS:
[316] “2023 Annual Report of the Board of Trustees of the Federal Old-Age and Survivors Insurance and Disability Insurance Trust Funds.” United States Social Security Administration, March 28, 2023. <www.ssa.gov>
Page 2: “Under the Trustees’ intermediate assumptions, Social Security’s total cost is projected to be higher than its total income in 2023 and all later years. Total cost began to be higher than total income in 2021. Social Security’s cost has exceeded its non-interest income since 2010.”
Page 3: “Under the Trustees’ intermediate assumptions, OASDI cost is projected to exceed total income in 2023, and the dollar level of the hypothetical combined trust fund reserves declines until reserves become depleted in 2034.”
[317] “2008 Annual Report of the Board of Trustees of the Federal Old-Age and Survivors Insurance and Disability Insurance Trust Funds.” United States Social Security Administration, March 28, 2008. <www.ssa.gov>
Page 8: “Redemption of trust fund assets will allow continuation of full benefit payments on a timely basis until … when the trust funds are projected to become exhausted. This redemption process will require a flow of cash from the General Fund of the Treasury.”
[318] Dataset: “Table VI.G7. Operations of the Combined OASI and DI Trust Funds, in CPI-Indexed 2023 Dollars, Calendar Years 1970–2100.” United States Social Security Administration, Office of the Chief Actuary. Accessed August 15, 2023 at <www.ssa.gov>
“The combined OASI [Old Age and Survivors Insurance] and DI [Disability Insurance] Trust Funds become depleted in 2034 under the intermediate assumptions and in 2031 under the high-cost assumptions, so estimates for later years are not shown.”
NOTE: The “combined OASI and DI Trust Funds” comprise the Social Security Trust Fund.
[319] Report: “United States Federal Debt: Answers To Frequently Asked Questions, An Update.” U.S. Government Accountability Office, August 12, 2004. <www.gao.gov>
Pages 10–12:
Debt held by the public approximates current federal demand on credit markets. It represents a burden on today’s economy, and the interest paid on this debt represents a burden on current taxpayers. Federal borrowing from the public absorbs resources available for private investment and may put upward pressure on interest rates. Further, debt held by the public is the accumulation of what the federal government borrowed in the past and is reported as a liability on the balance sheet of the government’s consolidated financial statements.
In contrast, debt held by government accounts (intragovernmental debt) and the interest on it represent a claim on future resources. This debt performs largely an internal accounting function. Special federal securities credited to government accounts (primarily trust funds) represent the cumulative surpluses of these accounts that have been lent to the general fund. These transactions net out on the government’s consolidated financial statements. Debt issued to government accounts does not affect today’s economy and does not currently compete with the private sector for available funds in the credit market.
However, debt held by government accounts reflects a future burden on taxpayers and the economy. The special federal securities held in the accounts represent legal obligations of the Treasury and are guaranteed for principal and interest by the full faith and credit of the U.S. government. When a government account needs to pay expenditures exceeding its receipts from the public, the Treasury must provide cash to redeem debt held by the government account. For example, according to 2004 Trustees projections, the Social Security trust funds will have insufficient tax income to pay scheduled benefits by 2018. The trust funds will begin drawing on the Treasury to cover the cash deficit, first relying on interest income and eventually drawing down accumulated trust fund assets. The government must obtain cash to finance this spending in excess of earmarked tax receipts either through increased taxes, spending cuts, increased borrowing from the public, retiring less debt (if the unified budget is in surplus), or some combination thereof.
Because debt held by the trust funds is not equal to the future benefit costs implied by the current design of the programs, it cannot be seen as a measure of the government’s total future commitment to programs financed by trust funds. The projected accumulated balances held by trust funds can provide one signal about the underlying fiscal imbalances in these programs. Trust fund balances do not provide meaningful information about program sustainability. The critical question is whether the government as a whole can afford the benefits in the future and at what cost in terms of other claims on scarce resources.
[320] Report: “Analytical Perspectives: Budget of the United States Government, Fiscal Year 2000.” Executive Office of the President of the United States, 1999. <www.gpo.gov>
Page 337:
These balances are available to finance future benefit payments and other trust fund expenditures—but only in a bookkeeping sense. These funds are not set up to be pension funds, like the funds of private pension plans. They do not consist of real economic assets that can be drawn down in the future to fund benefits. Instead, they are claims on the Treasury that, when redeemed, will have to be financed by raising taxes, borrowing from the public, or reducing benefits or other expenditures. The existence of large trust fund balances, therefore, does not, by itself, have any impact on the Government’s ability to pay benefits.
[321] Report: “Federal Debt and Interest Costs.” Congressional Budget Office, December 2010. <www.cbo.gov>
Page IX:
At the end of [Fiscal Year] 2010, gross federal debt totaled $13.5 trillion—the $9.0 trillion in debt held by the public plus $4.5 trillion in debt held by government accounts. More than half of the latter amount is held by the Social Security trust funds. Because those trust funds and other government accounts are part of the federal government, transactions between them and the Treasury are intragovernmental; that is, the government securities in those funds are an asset to the individual programs but a liability to the rest of the government. The resources needed to redeem the government securities in the trust funds and other accounts in some future year must be generated from taxes, income from other government sources, or borrowing by the government in that year.
[322] A detailed accounting of these debts, liabilities, and obligations is published in Just Facts’ research on the national debt.
[323] Calculated with data from:
a) Dataset: “Monthly Interest Rates, 1937–99 [Nominal Interest Rates on Special Issues].” U.S. Social Security Administration, Office of the Chief Actuary. Accessed August 31, 2023 at <www.ssa.gov>
b) Dataset: “Estimated Effective Interest Rates Earned by the Old-Age, Survivors, and Disability Insurance Trust Funds, 1940–1979.” U.S. Social Security Administration, Office of the Chief Actuary. Accessed August 31, 2023 at <www.ssa.gov>
c) Dataset: “Effective Interest Rates Earned by the Invested Assets of the OASI [Old-Age and Survivors] and DI [Disability Insurance] Trust Funds.” U.S. Social Security Administration, Office of the Chief Actuary. Accessed August 31, 2023 at <www.ssa.gov>
d) Dataset: “CPI—All Urban Consumers (Current Series).” U.S. Department of Labor, Bureau of Labor Statistics. Accessed January 27, 2023 at <www.bls.gov>
“Series Id: CUUR0000SA0; Series Title: All Items in U.S. City Average, All Urban Consumers, Not Seasonally Adjusted; Area: U.S. City Average; Item: All Items; Base Period: 1982–84=100”
NOTES:
[324] “2023 Annual Report of the Board of Trustees of the Federal Old-Age and Survivors Insurance and Disability Insurance Trust Funds.” United States Social Security Administration, March 28, 2023. <www.ssa.gov>
Page 8: “In 2022, the combined trust fund reserves (the excess of all past income over all past cost) earned interest at an effective annual rate of 2.4 percent.”
Pages 32–33:
Section 201(d) of the Social Security Act provides that the obligations issued for purchase by the OASI [Old-Age & Survivors Insurance] and DI [Disability Insurance] Trust Funds shall have maturities fixed with due regard for the needs of the funds. Each year, bond purchases for each trust fund are made on June 30, taking into account the projected reserve depletion date in the most recently issued Trustees Report. The usual practice has been to reinvest the maturing special issue securities, as of each June 30, so that the values of the total portfolio of special issue securities maturing in each of the next 15 years are approximately equal. However, as of June 2022, the most recent projections in the 2022 Trustees Report indicated that the reserves in the OASI Trust Fund would become depleted within 15 years. Therefore, the Department of the Treasury, in consultation with the Chief Actuary of the Social Security Administration, selected the amounts and maturity dates of the OASI special-issue bonds purchased on June 30, 2022, so that the maturity dates of the total portfolio of special issue securities would be spread evenly to the extent possible over the 12-year period 2023 through 2034. The bonds purchased on that date have an interest rate of 3.000 percent, reflecting the average market yield, as of the last business day of the prior month, on all of the outstanding marketable U.S. obligations that are due or callable more than 4 years in the future.
[325] United States Code Title 42, Chapter 7, Subchapter II, Section 401: “Social Security, Trust Funds, Investments.” Accessed August 30, 2023 at <www.law.cornell.edu>
Such obligations issued for purchase by the Trust Funds shall have maturities fixed with due regard for the needs of the Trust Funds and shall bear interest at a rate equal to the average market yield (computed by the Managing Trustee on the basis of market quotations as of the end of the calendar month next preceding the date of such issue) on all marketable interest-bearing obligations of the United States then forming a part of the public debt which are not due or callable until after the expiration of four years from the end of such calendar month; except that where such average market yield is not a multiple of one-eighth of 1 per centum, the rate of interest of such obligations shall be the multiple of one-eighth of 1 per centum nearest such market yield.
[326] For comprehensive facts about these drivers, visit Just Facts’ research on the national debt.
[327] United States Code Title 42, Chapter 7, Subchapter II, Section 401: “Social Security, Trust Funds, Investments.” Accessed August 30, 2023 at <www.law.cornell.edu>
Such obligations issued for purchase by the Trust Funds shall have maturities fixed with due regard for the needs of the Trust Funds and shall bear interest at a rate equal to the average market yield (computed by the Managing Trustee on the basis of market quotations as of the end of the calendar month next preceding the date of such issue) on all marketable interest-bearing obligations of the United States then forming a part of the public debt which are not due or callable until after the expiration of four years from the end of such calendar month; except that where such average market yield is not a multiple of one-eighth of 1 per centum, the rate of interest of such obligations shall be the multiple of one-eighth of 1 per centum nearest such market yield.
[328] Report: “How Treasury Issues Debt.” By Grant A. Driessen. Congressional Research Service, August 18, 2016. <fas.org>
Page 16: “[Debts issued] to finance the operations of the federal government, are offered at a mix of maturities…. Longer-term securities generally command higher interest rates compared to shorter-term securities because investors demand greater compensation for incurring risk over a longer period of time.”
[329] Article: “Interest Rates.” By Burton G. Malkiel. The Concise Encyclopedia of Economics, 2008. <www.econlib.org>
In general, lenders demand a higher rate of interest for loans of longer maturity. …
The longer the period to maturity of the bond, the greater is the potential fluctuation in price when interest rates change.
If you hold a bond to maturity, you need not worry if the price bounces around in the interim. But if you have to sell prior to maturity, you may receive less than you paid for the bond. The longer the maturity of the bond, the greater is the risk of loss because long-term bond prices are more volatile than shorter-term issues. To compensate for that risk of price fluctuation, longer-term bonds usually have higher interest rates than shorter-term issues.
[330] Article: “Interest Rate Risk—When Interest Rates Go Up, Prices of Fixed-Rate Bonds Fall.” SEC [Securities & Exchange Commission] Office of Investor Education and Advocacy, June 1, 2013. <www.sec.gov>
The Effect of Maturity on Interest Rate Risk and Coupon Rates
A bond’s maturity is the specific date in the future at which the face value of the bond will be repaid to the investor. A bond may mature in a few months or in a few years. Maturity can also affect interest rate risk. The longer the bond’s maturity, the greater the risk that the bond’s value could be impacted by changing interest rates prior to maturity, which may have a negative effect on the price of the bond. Therefore, bonds with longer maturities generally have higher interest rate risk than similar bonds with shorter maturities. …
To compensate investors for this interest rate risk, long-term bonds generally offer higher coupon rates than short-term bonds of the same credit quality.
[331] Report: “The 2014 Long-Term Budget Outlook.” Congressional Budget Office, July 2014. <www.cbo.gov>
Page 110: “The Social Security and Medicare trust funds hold special-issue bonds that generally earn interest rates that are higher than the average real interest rate on federal debt.”
[332] Report: “Social Security Trust Fund Investment Policies and Practices.” By Jeffrey L. Kunkel. United States Social Security Administration, January 1999. <www.ssa.gov>
The administrative policy followed since 1959 (with rare exceptions) has been to spread the maturity dates of each trust fund’s portfolio of special obligations as evenly as possible over the next 1 to 15 years, with the month and day of maturity always being June 30. (At the time the policy was set, June 30 was the end of the government’s fiscal year.) The policy calls for immediately investing income received by the trust funds in short-term special obligations, called certificates of indebtedness, that mature on the next June 30. On June 30, the certificates of indebtedness and any other special issues that mature on that date are reinvested (“rolled over”) as special issue notes or bonds with maturity dates designed to achieve an even 1-to-15 year spread.
[333] “2023 Annual Report of the Board of Trustees of the Federal Old-Age and Survivors Insurance and Disability Insurance Trust Funds.” United States Social Security Administration, March 28, 2023. <www.ssa.gov>
Pages 32–33:
Daily trust fund tax income is invested in the short-term certificates of indebtedness which mature on the next June 30 following the date of issue. The trust fund normally acquires long-term special-issue bonds when special issue securities of either type mature on June 30 and must be reinvested. …
Section 201(d) of the Social Security Act provides that the obligations issued for purchase by the OASI [Old-Age & Survivors Insurance] and DI [Disability Insurance] Trust Funds shall have maturities fixed with due regard for the needs of the funds. Each year, bond purchases for each trust fund are made on June 30, taking into account the projected reserve depletion date in the most recently issued Trustees Report. The usual practice has been to reinvest the maturing special issue securities, as of each June 30, so that the values of the total portfolio of special issue securities maturing in each of the next 15 years are approximately equal. However, as of June 2022, the most recent projections in the 2022 Trustees Report indicated that the reserves in the OASI Trust Fund would become depleted within 15 years. Therefore, the Department of the Treasury, in consultation with the Chief Actuary of the Social Security Administration, selected the amounts and maturity dates of the OASI special-issue bonds purchased on June 30, 2022, so that the maturity dates of the total portfolio of special issue securities would be spread evenly to the extent possible over the 12-year period 2023 through 2034. The bonds purchased on that date have an interest rate of 3.000 percent, reflecting the average market yield, as of the last business day of the prior month, on all of the outstanding marketable U.S. obligations that are due or callable more than 4 years in the future.
[334] Report: “How Treasury Issues Debt.” By Grant A. Driessen. Congressional Research Service, August 18, 2016. <fas.org>
Page 6: “When revenues in the trust funds exceed benefit payments, the unspent monies must remain in the trust fund for future use. However, this excess cash is transferred to the Treasury’s General Fund and is used to finance other activities which fall outside the specific purpose of the trust fund. In exchange, the trust fund is issued a Treasury ‘special issue’ security to be redeemed at face value at any time in the future when the funds are needed.”
[335] Report: “Federal Debt and Interest Costs.” Congressional Budget Office, December 2010. <www.cbo.gov>
Page 20: “When a trust fund’s expenses exceed its cash income, the agency administering the trust fund redeems its Treasury securities for cash as needed; the Treasury must obtain that cash from tax revenues or other sources of income or by borrowing from the public.”
[336] Webpage: “Social Security Trust Funds: Frequently Asked Questions.” United States Social Security Administration, Office of the Chief Actuary. Accessed August 31, 2023 at <www.ssa.gov>
How are the trust funds invested?
By law, income to the trust funds must be invested, on a daily basis, in securities guaranteed as to both principal and interest by the Federal government. All securities held by the trust funds are “special issues” of the United States Treasury. Such securities are available only to the trust funds.
In the past, the trust funds have held marketable Treasury securities, which are available to the general public. Unlike marketable securities, special issues can be redeemed at any time at face value. Marketable securities are subject to the forces of the open market and may suffer a loss, or enjoy a gain, if sold before maturity. Investment in special issues gives the trust funds the same flexibility as holding cash.
[337] Webpage: “Social Security Trust Funds: Frequently Asked Questions.” United States Social Security Administration, Office of the Chief Actuary. Accessed August 31, 2023 at <www.ssa.gov>
How are the trust funds invested?
By law, income to the trust funds must be invested, on a daily basis, in securities guaranteed as to both principal and interest by the Federal government. All securities held by the trust funds are “special issues” of the United States Treasury. Such securities are available only to the trust funds.
In the past, the trust funds have held marketable Treasury securities, which are available to the general public. Unlike marketable securities, special issues can be redeemed at any time at face value. Marketable securities are subject to the forces of the open market and may suffer a loss, or enjoy a gain, if sold before maturity. Investment in special issues gives the trust funds the same flexibility as holding cash.
[338] Webpage: “Social Security Online History: Presidential Statements. George W. Bush—2nd Quarter 2005. President Tours Bureau of Public Debt.” United States Social Security Administration, April 5, 2005. <www.ssa.gov>
The President: See, what’s interesting is a lot of people believe that the Social Security trust is—the government takes a person’s money, invests it, and then pays it back to them upon retirement. It doesn’t work that way.
Ms. Chapman: That’s right, that’s exactly right.
The President: This is what exists. And it’s very important, then, to make sure that in the future that there’s real assets for retirees.
[339] Article: “ ‘Trust Fund’ is Locked in Filing Cabinet.” By Dennis Cauchon. USA Today, April 5, 2005. <bit.ly>
The papers in the cabinet are computer-generated replicas of $1.7 trillion in Treasury bonds—the amount the government has promised to repay Social Security for spending payroll taxes that finance the retirement system on other programs such as defense and education.
The imitation bonds are signed by Chapman, division director of the Office of Public Accounting in the Trust Fund Management Branch of the Bureau of the Public Debt. The bureau is part of the Treasury Department.
[340] “Debt to the Penny.” United States Department of the Treasury, Bureau of the Fiscal Service. Accessed November 2, 2021 at <fiscaldata.treasury.gov>
NOTE: As shown in this source, the Bureau of the Fiscal Service breaks down the “Total Public Debt Outstanding” into “Debt Held by the Public” and “Intragovernmental Holdings.” Forthcoming facts define these terms.
[341] Report: “The Debt Limit: History and Recent Increases.” By D. Andrew Austin and Mindy R. Levit. Congressional Research Service, November 4, 2010. <www.everycrsreport.com>
Page 2 (of PDF):
Total debt of the federal government can increase in two ways. First, debt increases when the government sells debt to the public to finance budget deficits and acquire the financial resources needed to meet its obligations. This increases debt held by the public. Second, debt increases when the federal government issues debt to certain government accounts, such as the Social Security, Medicare, and Transportation trust funds, in exchange for their reported surpluses. This increases debt held by government accounts. The sum of debt held by the public and debt held by government accounts is the total federal debt.
[342] Webpage: “Frequently Asked Questions About the Public Debt.” United States Department of the Treasury, Bureau of the Fiscal Service. Last updated May 5, 2020. <www.treasurydirect.gov>
What is the Debt Held by the Public?
The Debt Held by the Public is all federal debt held by individuals, corporations, state or local governments, Federal Reserve Banks, foreign governments, and other entities outside the United States Government less Federal Financing Bank securities. Types of securities held by the public include, but are not limited to, Treasury Bills, Notes, Bonds, TIPS [Treasury Inflation-Protected Securities], United States Savings Bonds, and State and Local Government Series securities.
[343] Paper: “Government Debt.” By Douglas W. Elmendorf (Federal Reserve Board) and N. Gregory Mankiw (Harvard University and the National Bureau of Economic Research), January 1998. <www.federalreserve.gov>
Page 2: “The figure shows federal debt ‘held by the public,’ which includes debt held by the Federal Reserve System but excludes debt held by other parts of the federal government, such as the Social Security trust fund.”
[344] Report: “Federal Debt and Interest Costs.” Congressional Budget Office, December 2010. <www.cbo.gov>
Pages 13–14:
Ownership of Federal Debt Held by the Public …
A significant amount of federal debt is held by the Federal Reserve—the nation’s central bank and an independent entity within the government that is responsible for conducting monetary policy, among other activities.
[345] United States Code Title 31, Subtitle II, Chapter 11, Section 1102: “Fiscal Year.” Accessed September 1, 2023 at <www.law.cornell.edu>
“The fiscal year of the Treasury begins on October 1 of each year and ends on September 30 of the following year.”
[346] Report: “Monthly Statement of the Public Debt of the United States.” U.S. Bureau of the Fiscal Service, September 30, 2022. <www.justfacts.com>september.pdf
Page 1: “Table I—Summary of Treasury Securities Outstanding, September 30, 2022 (Millions of dollars) … Total Public Debt Outstanding … Totals [=] $30,928,912 … Intragovernmental Holdings … [=] $6,629,719 … Debt Held By the Public [=] $24,299,193”
[347] United States Code Title 31, Subtitle III, Chapter 31, Subchapter II, Section 3123: “Payment of Obligations and Interest on the Public Debt.” Accessed August 31, 2023 at <www.law.cornell.edu>
Section (a): “The faith of the United States Government is pledged to pay, in legal tender, principal and interest on the obligations of the Government issued under this chapter.”
[348] Article: “The Impact of Social Security on the National Debt.” By James D. Agresti. Just Facts, September 1, 2001. <www.justfacts.com>
“I will put Social Security into a lockbox.” This is one of the most common campaign promises. What does it mean? It means that Social Security loans its surplus money to the federal government, and the federal government uses the money to pay off someone else it owes money to.
Examine this scenario from Social Security’s standpoint. Social Security loans money to the federal government and will collect on the money and interest in the future. … Now look at this from the federal government’s standpoint. The federal government borrows money from Social Security and uses it to pay off debt that it owes to someone else. This leaves the national debt exactly as it was.
[349] Transcript: “Presidential Debate in Boston.” October 3, 2000. <www.presidency.ucsb.edu>
“Gore: … Here is my plan. I will keep Social Security in a lockbox and that pays down the national debt. And the interest savings I would put right back into Social Security. That extends the life of Social Security for 55 years.”
[350] Article: “The Impact of Social Security on the National Debt.” By James D. Agresti. Just Facts, September 1, 2001. <www.justfacts.com>
When Social Security loans money to the federal government, the government can either spend the money or use it to pay off someone else that the federal government owes money to. If the federal government spends the money, this action is what some people refer to as, “raiding the Social Security Trust Fund.”
This is an inaccurate description of what is taking place because not one dime is taken out of the Social Security Trust Fund. Examine this scenario from Social Security’s standpoint. Social Security loans money to the federal government and will collect on the money and interest in the future. Now examine it from the federal government’s standpoint. The federal government borrows money from Social Security and spends it. This increases the national debt.
[351] “Statement of U.S. Representative Mike Pence (R-IN).” Congressional Record, June 22, 2005. <www.congress.gov>
Page H4902: “It has simply been wrong these last 4 decades for the Congress of the United States to take the Social Security surplus and apply it to spending on big government. … We need to stop raiding the Social Security trust fund.”
[352] “2009 Annual Report of the Board of Trustees of the Federal Old-Age and Survivors Insurance and Disability Insurance Trust Funds.” Board of Trustees of the Federal OASDI Trust Funds, May 12, 2009. <www.ssa.gov>
Page 24: “All securities held by the trust funds are backed by the full faith and credit of the United States Government, as required by law.”
Page 140: “The Social Security Act does not permit expenditures from the OASI [Old-Age & Survivors Insurance] and DI [Disability Insurance] Trust Funds for any purpose not related to the payment of benefits or administrative costs for the OASDI [Social Security] program.”
Pages 218–219: “Funds not withdrawn for current monthly or service benefits, the financial interchange, and administrative expenses are invested in interest-bearing Federal securities, as required by law; the interest earned is also deposited in the trust funds.”
[353] Webpage: “Social Security Trust Funds: Frequently Asked Questions.” United States Social Security Administration, Office of the Chief Actuary. Accessed August 31, 2023 at <www.ssa.gov>
Why do some people describe the “special issue” securities held by the trust funds as worthless IOUs? What is SSA’s [Social Security Administration’s] reaction to this criticism? …
… [T]he investments held by the trust funds are backed by the full faith and credit of the U. S. Government. The government has always repaid Social Security, with interest.
[354] Article: “The Impact of Social Security on the National Debt.” By James D. Agresti. Just Facts, September 1, 2001. <www.justfacts.com>
When Social Security loans money to the federal government, the government can either spend the money or use it to pay off someone else that the federal government owes money to. If the federal government spends the money, this action is what some people refer to as, “raiding the Social Security Trust Fund.”
This is an inaccurate description of what is taking place because not one dime is taken out of the Social Security Trust Fund. Examine this scenario from Social Security’s standpoint. Social Security loans money to the federal government and will collect on the money and interest in the future. Now examine it from the federal government’s standpoint. The federal government borrows money from Social Security and spends it. This increases the national debt. …
“I will put Social Security into a lockbox.” …
Examine this scenario from Social Security’s standpoint. Social Security loans money to the federal government and will collect on the money and interest in the future. … Now look at this from the federal government’s standpoint. The federal government borrows money from Social Security and uses it to pay off debt that it owes to someone else. This leaves the national debt exactly as it was.
[355] Webpage: “Debt Versus Deficit: What’s the Difference?” United States Department of the Treasury, Bureau of the Fiscal Service, August 5, 2004. <treasurydirect.gov>
“Additionally, the Government Trust Funds are required by law to invest accumulated surpluses in Treasury securities. The Treasury securities issued to the public and to the Government Trust Funds (intragovernmental holdings) then become part of the total debt.”
[356] Report: “Monthly Statement of the Public Debt of the United States.” U.S. Bureau of the Fiscal Service, December 31, 2022. <www.justfacts.com>
NOTE: The money that the federal government owes to the Social Security program is itemized in the line items for the “Federal Disability Insurance Trust Fund” and the “Federal Old-Age and Survivors Insurance Trust Fund.” Both of these appear on page 13 in “Table III – Detail of Treasury Securities Outstanding.”
[357] “2010 Annual Report of the Board of Trustees of the Federal Old-Age and Survivors Insurance and Disability Insurance Trust Funds.” Board of Trustees of the Federal OASDI Trust Funds, August 9, 2010. <www.ssa.gov>
Page 142: “The Social Security Act does not permit expenditures from the OASI [Old-Age & Survivors Insurance] and DI [Disability Insurance] Trust Funds for any purpose not related to the payment of benefits or administrative costs for the OASDI [Social Security] program.”
[358] Report: “Analytical Perspectives: Budget of the United States Government, Fiscal Year 2005.” White House Office of Management and Budget, February 2004. <fraser.stlouisfed.org>
Page 339: “The main financing component of the Federal funds group is the general fund, which is used to carry out the general purposes of Government rather than being restricted by law to a specific program. It consists of all collections not earmarked by law to finance other funds, including virtually all income taxes and many excise taxes….”
[359] United States Code Title 42, Chapter 7, Subchapter II, Section 401: “Social Security, Federal Old-Age, Survivors, and Disability Insurance Benefits, Trust Funds.” Accessed August 30, 2023 at <www.law.cornell.edu>
(a) Federal Old-Age and Survivors Insurance Trust Fund
There is hereby created on the books of the Treasury of the United States a trust fund to be known as the “Federal Old-Age and Survivors Insurance Trust Fund”. … There is hereby appropriated to the Federal Old-Age and Survivors Insurance Trust Fund for the fiscal year ending June 30, 1941, and for each fiscal year thereafter, out of any moneys in the Treasury not otherwise appropriated, amounts equivalent to 100 per centum of—
(1) the taxes (including interest, penalties, and additions to the taxes) received under subchapter A of chapter 9 of the Internal Revenue Code of 1939 …
(b) Federal Disability Insurance Trust Fund
There is hereby created on the books of the Treasury of the United States a trust fund to be known as the “Federal Disability Insurance Trust Fund”. … There is hereby appropriated to the Federal Disability Insurance Trust Fund for the fiscal year ending June 30, 1957, and for each fiscal year thereafter, out of any moneys in the Treasury not otherwise appropriated, amounts equivalent to 100 per centum of….
[360] Webpage: “House Resolution 1259: Social Security and Medicare Safe Deposit Box Act of 1999.” 106th Congress, United States House of Representatives, March 24, 1999. <www.congress.gov>
Sec. 2 (b): “Purpose: It is the purpose of this Act to prohibit the use of Social Security surpluses for any purpose other than reforming Social Security and Medicare.”
[361] Webpage: “Actions Overview House Resolution 1259: Social Security and Medicare Safe Deposit Box Act of 1999.” 106th Congress, United States House of Representatives, March 24, 1999. <www.congress.gov>
05/26/1999 — Passed/agreed to in House: On passage Passed by the Yeas and Nays: 416–12 (Roll no. 164).
[362] Vote 170: “On the Motion to Invoke Cloture on H.R.1259.” 106th Congress, United States Senate, June 16, 1999. <www.senate.gov>
|
Party |
Voted YES |
Voted NO |
Not Voting |
|
Republican |
55 |
0 |
0 |
|
Democratic |
0 |
44 |
1 |
NOTE: As detailed in the next two footnotes, a total of 60 yes votes were necessary to invoke cloture (stop the filibuster) and allow a vote on the bill.
[363] Report: “Filibusters and Cloture in the Senate.” By Valerie Heitshusen and Richard S. Beth. U.S. Congressional Research Service. Updated April 7, 2017. <sgp.fas.org>
Page 2 (of PDF):
The filibuster is widely viewed as one of the Senate’s most characteristic procedural features. Filibustering includes any use of dilatory or obstructive tactics to block a measure by preventing it from coming to a vote. The possibility of filibusters exists because Senate rules place few limits on Senators’ rights and opportunities in the legislative process. …
Senate Rule XXII, however, known as the cloture rule, enables Senators to end a filibuster on any debatable matter the Senate is considering. Sixteen Senators initiate this process by presenting a motion to end the debate. In most circumstances, the Senate does not vote on this cloture motion until the second day of session after the motion is made. Then, it requires the votes of at least three-fifths of all Senators (normally 60 votes) to invoke cloture. (Invoking cloture on a proposal to amend the Senate’s standing rules requires the support of two-thirds of the Senators present and voting, whereas cloture on nominations requires a numerical majority.)
Page 9:
Invoking cloture usually requires a three-fifths vote of the entire Senate—“three-fifths of the Senators duly chosen and sworn.” Thus, if there is no more than one vacancy, 60 Senators must vote to invoke cloture. In contrast, most other votes require only a simple majority (that is, 51%) of the Senators present and voting, assuming those Senators constitute a quorum. In the case of a cloture vote, the key is the number of Senators voting for cloture, not the number voting against. Failing to vote on a cloture motion has the same effect as voting against the motion: it deprives the motion of one of the 60 votes needed to agree to it.
There are two important exceptions to the three-fifths requirement to invoke cloture. First, under Rule XXII, an affirmative vote of two-thirds of the Senators present and voting is required to invoke cloture on a measure or motion to amend the Senate rules. This provision has its origin in the history of the cloture rule. Before 1975, two-thirds of the Senators present and voting (a quorum being present) was required for cloture on all matters. In early 1975, at the beginning of the 94th Congress, Senators sought to amend the rule to make it somewhat easier to invoke cloture. However, some Senators feared that if this effort succeeded, that would only make it easier to amend the rule again, making cloture still easier to invoke. As a compromise, the Senate agreed to move from two-thirds of the Senators present and voting (a maximum of 67 votes) to three-fifths of the Senators duly chosen and sworn (normally, and at a maximum, 60 votes) on all matters except future rules changes, including changes in the cloture rule itself.17
[364] Standing Rules of the Senate, Rule XXII: “Precedence Of Motions.” Accessed July 3, 2018 at <www.rules.senate.gov>
2. Notwithstanding the provisions of rule II or rule IV or any other rule of the Senate, at any time a motion signed by sixteen Senators, to bring to a close the debate upon any measure, motion, other matter pending before the Senate, or the unfinished business, is presented to the Senate, the Presiding Officer, or clerk at the direction of the Presiding Officer, shall at once state the motion to the Senate, and one hour after the Senate meets on the following calendar day but one, he shall lay the motion before the Senate and direct that the clerk call the roll, and upon the ascertainment that a quorum is present, the Presiding Officer shall, without debate, submit to the Senate by a yea-and-nay vote the question:
“Is it the sense of the Senate that the debate shall be brought to a close?” And if that question shall be decided in the affirmative by three-fifths of the Senators duly chosen and sworn—except on a measure or motion to amend the Senate rules, in which case the necessary affirmative vote shall be two-thirds of the Senators present and voting—then said measure, motion, or other matter pending before the Senate, or the unfinished business, shall be the unfinished business to the exclusion of all other business until disposed of.
Thereafter no Senator shall be entitled to speak in all more than one hour on the measure, motion, or other matter pending before the Senate, or the unfinished business, the amendments thereto, and motions affecting the same, and it shall be the duty of the Presiding Officer to keep the time of each Senator who speaks. Except by unanimous consent, no amendment shall be proposed after the vote to bring the debate to a close, unless it had been submitted in writing to the Journal Clerk by 1 o’clock p.m. on the day following the filing of the cloture motion if an amendment in the first degree, and unless it had been so submitted at least one hour prior to the beginning of the cloture vote if an amendment in the second degree. No dilatory motion, or dilatory amendment, or amendment not germane shall be in order. Points of order, including questions of relevancy, and appeals from the decision of the Presiding Officer, shall be decided without debate.
After no more than thirty hours of consideration of the measure, motion, or other matter on which cloture has been invoked, the Senate shall proceed, without any further debate on any question, to vote on the final disposition thereof to the exclusion of all amendments not then actually pending before the Senate at that time and to the exclusion of all motions, except a motion to table, or to reconsider and one quorum call on demand to establish the presence of a quorum (and motions required to establish a quorum) immediately before the final vote begins. The thirty hours may be increased by the adoption of a motion, decided without debate, by a three-fifths affirmative vote of the Senators duly chosen and sworn, and any such time thus agreed upon shall be equally divided between and controlled by the Majority and Minority Leaders or their designees. However, only one motion to extend time, specified above, may be made in any one calendar day.
[365] Transcript: “Presidential Debate in Boston.” American Presidency Project, October 3, 2000. <www.presidency.ucsb.edu>
“Gore: … Here is my plan. I will keep Social Security in a lockbox and that pays down the national debt. And the interest savings I would put right back into Social Security. That extends the life of Social Security for 55 years.”
[366] Report: “The Debt Limit: History and Recent Increases.” By D. Andrew Austin and Mindy R. Levit. Congressional Research Service, January 6, 2011. <www.everycrsreport.com>
Page 2 (of PDF): “[D]ebt increases when the federal government issues debt to certain government accounts, such as the Social Security, Medicare, and Transportation trust funds, in exchange for their reported surpluses. This increases debt held by government accounts.”
[367] Webpage: “Frequently Asked Questions About the Social Security Trust Funds.” Social Security Office of the Chief Actuary. Accessed December 21, 2020 at <www.ssa.gov>
Money flowing into the trust funds is invested in U.S. Government securities. Because the government spends this borrowed cash, some people see the trust fund asset reserves as an accumulation of securities that the government will be unable to make good on in the future. Without legislation to restore long-range solvency of the trust funds, redemption of long-term securities prior to maturity would be necessary.
[T]he investments held by the trust funds are backed by the full faith and credit of the U. S. Government. The government has always repaid Social Security, with interest. The special-issue securities are, therefore, just as safe as U.S. Savings Bonds or other financial instruments of the Federal government.
[368] Report: “Analytical Perspectives: Budget of the United States Government, Fiscal Year 2000.” Executive Office of the President of the United States, 1999. <www.gpo.gov>
Page 337:
These balances are available to finance future benefit payments and other trust fund expenditures—but only in a bookkeeping sense. These funds are not set up to be pension funds, like the funds of private pension plans. They do not consist of real economic assets that can be drawn down in the future to fund benefits. Instead, they are claims on the Treasury that, when redeemed, will have to be financed by raising taxes, borrowing from the public, or reducing benefits or other expenditures. The existence of large trust fund balances, therefore, does not, by itself, have any impact on the Government’s ability to pay benefits.
[369] “Statement of the Hon. David M. Walker, Comptroller General of the United States, U.S. General Accounting Office.” U.S. House of Representatives, Committee on Ways and Means, November 9, 1999. <www.govinfo.gov>
Pages 66–67:
[T]he President proposes to use the entire Social Security surplus and a portion of the projected on-budget surplus to reduce debt held by the public. The President projects that his proposal would reduce debt held by the public by $3.6 trillion over the next 15 years, eliminating publicly held debt by 2015. Beginning in 2011, the President proposes to transfer additional Treasury securities to the [Social Security] trust funds in an amount equal to the “fiscal dividend”—i.e., interest savings that result from lower publicly held debt. In effect, the President proposes to reduce publicly held debt by increasing government-held debt.
Page 70: “The trust funds already earn interest on their surpluses. Under the President’s current proposal the trust funds will receive, in effect, a second interest payment equal to interest savings that result from paying down publicly held debt. This is simply a grant of future general revenues to Social Security….”
[370] For comprehensive facts about these rates, visit Just Facts’ research on the national debt and the section of this research on interest rates.
[371] Report: “The 2014 Long-Term Budget Outlook.” Congressional Budget Office, July 2014. <www.cbo.gov>
Page 110: “The Social Security and Medicare trust funds hold special-issue bonds that generally earn interest rates that are higher than the average real interest rate on federal debt.”
[372] Webpage: “Frequently Asked Questions About the Social Security Trust Funds.” Social Security Office of the Chief Actuary. Accessed December 21, 2020 at <www.ssa.gov>
The numeric average of the 12 monthly interest rates for 2019 was 2.219 percent. The annual effective interest rate (the average rate of return on all investments over a one-year period) for the OASI and DI [Old Age Survivors Insurance and Disability Insurance, which together comprise Social Security] Trust Funds, combined, was 2.812 percent in 2019. This higher effective rate resulted because the funds hold special-issue bonds acquired in past years when interest rates were higher.
[373] Calculated with data from: “Long Range OASDI Financial Effects of the President’s Proposal for Strengthening Social Security – Information.” Letter from Social Security Administration Deputy Chief Actuary Stephen C. Goss to Chief Actuary Harry C. Ballantyne, June 26, 2000. <www.justfacts.com>
Page 1: “This proposal would require that transfers be made from the General Fund of the Treasury of the United States to the [Social Security Trust Funds] for each fiscal year 2011 through 2050.”
Page 2: “Base transfer amounts are intended to be equal to the amount by which interest on publicly-held Federal debt would be lower as a result of the [Social Security Trust Fund] ‘surplus’ during fiscal years 2001 through 2015 than if there had been no such surplus, assuming that all transfers had been invested solely in special issues of the Treasury.”
Page 4: “Estimated Transfer Amounts and Limits Under the Proposal … Estimated Transfer Amount (billions of current dollars) … Fiscal Year 2011 [=] $122.2 … 2012 [=] $145.0 … 2013 [=] $169.8 … 2014 [=] $196.7 … 2015 [=] $225.7 … 2016 & later [=] $257.0”
CALCULATION: $122.4 + $145.0 + $169.8 + $196.7 + 225.7 + ($257.0 x 35 years) = $9,854.6
NOTE: These figures are based on current dollars and do not include inflation.
[374] “Prosperity for America’s Families: The Gore–Lieberman Economic Plan.” Gore/Lieberman, Inc., September 2000. <www.cnn.com>
Page 41:
Al Gore and Joe Lieberman’s plan would begin today, when the government starts saving Social Security surpluses. After locking in a decade of debt reduction, the interest savings would be computed and transferred to the Social Security trust fund. Based on current projections, that would result in a transfer of over $100 billion in 2011. The interest savings and the transfers would grow to a projected $250 billion in 2016. From 2016 to 2050 transfers would stay at this level. In total, Al Gore’s plan would add—in Net Present Value terms—an additional $1.4 trillion to the Social Security trust fund.
[375] “Statement of the Hon. David M. Walker, Comptroller General of the United States, U.S. General Accounting Office.” U.S. House of Representatives, Committee on Ways and Means, November 9, 1999. <www.govinfo.gov>
Page 70:
As in the earlier proposals, the President’s current proposal in effect trades debt held by the public for debt held by the trust funds. It thereby commits future general revenues to the Social Security program. This is true because the transfers would be in addition to any buildup of payroll tax surpluses. Securities held by the [Social Security] trust funds have always represented annual cash flows in excess of benefits and expenses, plus interest.5 Under the President’s proposal, this would no longer continue to be true. The value of the securities held by the trust funds would be greater than the amount by which annual revenues plus interest exceed annual benefits and expenditures.
This means that for the first time there would be an explicit general fund subsidy.
[376] Speech: “Address of the President to Joint Sessions of Congress.” President George W. Bush, February 27, 2001. <georgewbush-whitehouse.archives.gov>
My budget has funded a responsible increase in our ongoing operations. It has funded our nation’s important priorities. It has protected Social Security and Medicare. And our surpluses are big enough that there is still money left over.
Many of you have talked about the need to pay down our national debt. I listened, and I agree. (Applause.) We owe it to our children and grandchildren to act now, and I hope you will join me to pay down $2 trillion in debt during the next 10 years. (Applause.) At the end of those 10 years, we will have paid down all the debt that is available to retire. (Applause.) That is more debt, repaid more quickly than has ever been repaid by any nation at any time in history. (Applause.)
We should also prepare for the unexpected, for the uncertainties of the future. We should approach our nation’s budget as any prudent family would, with a contingency fund for emergencies or additional spending needs. For example, after a strategic review, we may need to increase defense spending. We may need to increase spending for our farmers or additional money to reform Medicare. And so, my budget sets aside almost a trillion dollars over 10 years for additional needs. That is one trillion additional reasons you can feel comfortable supporting this budget. (Applause.)
[377] Report: “A Blueprint for New Beginnings: A Responsible Budget for America’s Priorities.” Executive Office of the President of the United States, February 28, 2001. <www.govinfo.gov>
Page 11: “At the end of 2001, there will be $3.2 trillion in publicly held debt. About $2.0 trillion can actually be retired over the next 10 years.”
[378] Report: “A Blueprint for New Beginnings: A Responsible Budget for America’s Priorities.” Executive Office of the President of the United States, February 28, 2001. <www.govinfo.gov>
NOTE: Page 201 contains a chart with a section labeled, “Held By.” Compare the following two line items:
(a) “Debt securities held as assets by Government accounts.” This is the debt owed to federal entities. Between 2000 and 2011, it rises by 3,782 billion dollars (goes from $2,219 billion to 6,001 billion).
(b) “Debt held by the public (gross).” This is the debt owed to non-federal entities. Between 2000 and 2011, it falls by 2,252 billion dollars (goes from $3,410 billion to $1,158 billion).
The net effect is an increase in the national debt:
$3,782 billion increase in debt owed to federal entities – $2,252 billion decrease in debt owed to non-federal entities = $1,530 billion increase to the national debt.
[379] Report: “A Blueprint for New Beginnings: A Responsible Budget for America’s Priorities.” Executive Office of the President of the United States, February 28, 2001. <www.govinfo.gov>
NOTE: Page 201 contains a chart with a section labeled, “Debt Outstanding, End of Year.” Examine the line item, “Total, gross federal debt.” This is the national debt. Between 2000 and 2011, it increases by 1,530 billion dollars. Observe that this figure matches the result of the calculation in the previous footnote.
[380] Pamphlet: “Understanding the Benefits.” United States Social Security Administration, January 2023. <www.ssa.gov>
Page 2:
The current Social Security system works like this: when you work, you pay taxes into Social Security. We use the tax money to pay benefits to:
• People who have already retired.
• People with qualifying disabilities.
• Survivors of workers who have died.
• Dependents of beneficiaries.
The money you pay in taxes isn’t held in a personal account for you to use when you get benefits. We use your taxes to pay people who are getting benefits right now. Any unused money goes to the Social Security trust funds, not a personal account with your name on it.
[381] “The 1936 Government Pamphlet on Social Security.” United States Social Security Administration. Accessed July 25, 2022 at <www.ssa.gov>
“The checks will come to you as a right. You will get them regardless of the amount of property or income you may have. They are what the law calls ‘Old-Age Benefits’ under the Social Security Act.”
[382] Report: “Summary of Major Changes in the Social Security Cash Benefits Program: 1935–1996.” By Geoffrey Kollmann. Library of Congress, Congressional Research Service. Updated December 20, 1996. <www.ssa.gov>
Pages 2–3: “1939 Amendments … The provision for lump-sum payments of 3.5% of accumulated wages for workers who died before age 65, or attained age 65 but were ineligible for benefits, was repealed….”
[383] “Social Security Act of 1935.” United States Social Security Administration. Accessed September 19, 2019 at <www.ssa.gov>
“Sec. 1104. The right to alter, amend, or repeal any provision of this Act is hereby reserved to the Congress.”
[384] Webpage: “Supreme Court Case: Flemming vs. Nestor.” United States Social Security Administration. Accessed September 1, 2023 at <www.ssa.gov>
But like all federal entitlement programs, Congress can change the rules regarding eligibility—and it has done so many times over the years. The rules can be made more generous, or they can be made more restrictive. Benefits which are granted at one time can be withdrawn, as for example with student benefits, which were substantially scaled-back in the 1983 Amendments.
There has been a temptation throughout the program’s history for some people to suppose that their FICA [Federal Insurance Contributions Act] payroll taxes entitle them to a benefit in a legal, contractual sense. That is to say, if a person makes FICA contributions over a number of years, Congress cannot, according to this reasoning, change the rules in such a way that deprives a contributor of a promised future benefit. Under this reasoning, benefits under Social Security could probably only be increased, never decreased, if the Act could be amended at all. Congress clearly had no such limitation in mind when crafting the law. Section 1104 of the 1935 Act, entitled “Reservation of Power,” specifically said: “The right to alter, amend, or repeal any provision of this Act is hereby reserved to the Congress.” Even so, some have thought that this reservation was in some way unconstitutional. This is the issue finally settled by Flemming v. Nestor.
[385] Pamphlet: “A ‘Snapshot.’ ” U.S. Social Security Administration, August 2021. <www.ssa.gov>
Page 3: “We do not put the Social Security and Medicare taxes you pay in a special account for you. They are used to pay benefits for other workers today, just as your future benefits will be paid for by future workers.”
[386] Dataset: “Table VI.G7. Operations of the Combined OASI and DI Trust Funds, in CPI-Indexed 2023 Dollars, Calendar Years 1970–2100.” United States Social Security Administration, Office of the Chief Actuary. Accessed August 15, 2023 at <www.ssa.gov>
“The combined OASI [Old Age and Survivors Insurance] and DI [Disability Insurance] Trust Funds become depleted in 2034 under the intermediate assumptions and in 2031 under the high-cost assumptions, so estimates for later years are not shown.”
NOTE: The “combined OASI and DI Trust Funds” comprise the Social Security Trust Fund.
[387] Calculated with the dataset: “Trust Fund Operations in Current Dollars, Intermediate Assumptions, 2023 Trustees Report.” United States Social Security Administration, Office of the Chief Actuary. Transmitted to Just Facts on August 25, 2023.
NOTE: An Excel file containing the data and calculations is available upon request.
[388] Report: “Strengthening Social Security and Creating Personal Wealth for All Americans.” The President’s Commission to Strengthen Social Security, December 21, 2001. <govinfo.library.unt.edu>
Page 72: “Under a personal account program, workers would be given the option to invest a portion of their payroll taxes in accounts that they would own.”
Page 74:
All of the plans presented by the Commission provide individuals the option to invest in personal accounts. In all cases, these accounts are at least partially financed by a redirection of payroll tax revenue from the existing system. In return for the opportunity to pursue higher expected returns through personal accounts, individuals who choose the account agree to forgo the benefit that would have been financed by these payroll taxes (plus interest).
[389] Memorandum: “Estimated Financial Effects of the ‘Social Security Personal Savings Guarantee and Prosperity Act of 2008.’ ” By Stephen C. Goss. United States Social Security Administration, Office of the Chief Actuary. May 21, 2008. <www.ssa.gov>
Page 2:
Under the plan specifications described below the Social Security program would be expected to be solvent and to meet its benefit obligations throughout the long-range period 2008 through 2082. The long-range OASDI [Social Security] actuarial deficit of 1.70 percent of payroll and the OASDI long-range unfunded obligation of $4.3 trillion in present value would be eliminated. In addition, trust fund assets expressed as a percentage of annual program cost are projected to be rising at the end of the 75-year period. Thus, the proposal meets the long-range criteria for sustainable solvency and would be expected to remain solvent for the foreseeable future. General Fund transfers are, however, expected to be needed under the plan in years 2032 through 2063, totaling $4.1 trillion in present discounted value. All estimates are based on the intermediate assumptions of the 2008 Trustees Report plus additional assumptions described below.
NOTE: The financial details of several other personal ownership proposals are available at <www.ssa.gov>
[390] Report: “Strengthening Social Security and Creating Personal Wealth for All Americans.” President’s Commission to Strengthen Social Security, December 2001. <govinfo.library.unt.edu>
Page 11:
Personal accounts can also contribute towards the fiscal sustainability of the Social Security system. While there are multiple paths to fiscal sustainability that are consistent with the President’s principles for Social Security reform, we have chosen to include three reform models in the report that improve the fiscal sustainability of the current system, are costed honestly, and are preferable to the current Social Security system.
[391] Article: “Scientific Survey Shows Voters Widely Accept Misinformation Spread by the Media.” By James D. Agresti. Just Facts, January 2, 2020. <www.justfacts.com>
[A] scientific survey commissioned by Just Facts shows that many people are indeed misinformed….
The survey was conducted by Triton Polling & Research, an academic research firm that serves scholars, corporations, and political campaigns. The responses were obtained through live telephone surveys of 700 likely voters across the United States during December 2–11, 2019. This sample size is large enough to accurately represent the U.S. population. Likely voters are people who say they vote “every time there is an opportunity” or in “most” elections.
The margin of sampling error for the total pool of respondents is ±4% with at least 95% confidence. The margins of error for the subsets are 6% for Democrat voters, 6% for Republican voters, 5% for males, 5% for females, 12% for 18 to 34 year olds, 5% for 35 to 64 year olds, and 6% for 65+ year olds.
The survey results presented in this article are slightly weighted to match the ages and genders of likely voters. The political parties and geographic locations of the survey respondents almost precisely match the population of likely voters. Thus, there is no need for weighting based upon these variables.
NOTE: For facts about what constitutes a scientific survey and the factors that impact their accuracy, visit Just Facts’ research on Deconstructing Polls & Surveys.
[392] Report: “Just Facts 2019 U.S. Nationwide Survey.” Just Facts, December 2019. <www.justfacts.com>
Page 5:
Q21: Some policymakers are proposing that individuals be allowed to save and invest some of their Social Security taxes in personal accounts instead of paying these taxes to the Social Security program. In your view, do you think such proposals generally improve or harm the finances of the Social Security program?
Improve [=] 22%
Harm [=] 70%
Unsure [=] 7.8%
NOTE: For facts about what constitutes a scientific survey and the factors that impact their accuracy, visit Just Facts’ research on Deconstructing Polls & Surveys.
[393] Senate Bill 1302: “Stop the Raid on Social Security Act of 2005.” Introduced by Senator Jim DeMint and cosponsored by Senators Santorum, Graham, Crapo, Coburn, Sununu, Isakson, Enzi, Cornyn, Lott, Brownback, and Craig. U.S. Senate, 109th U.S. Congress, June 23, 2005. <www.gpo.gov>
Section 255:
(a) Designation of Certified Account Managers—Under the Program, a certified account manager shall be designated by or on behalf of each participating individual to hold for investment under this section such individual’s social security personal retirement account assets.
(b) Procedure for Designation—Any designation made under subsection (a) shall be made in such form and manner as shall be prescribed in regulations prescribed by the Board. Such regulations shall provide for annual selection periods during which participating individuals may make designations pursuant to subsection (a). Designations made pursuant to subsection (a) during any such period shall be irrevocable for the one-year period following such period, except that such regulations shall provide for such interim designations as may be necessitated by the decertification of a certified account manager. Such regulations shall provide for such designations made by the Board on behalf of a participating individual in any case in which a timely designation is not made by the participating individual.
(c) Investment—Any balance held in a participating individual’s social security personal retirement account under this part which is not necessary for immediate withdrawal shall be invested on behalf of such participating individual by the certified account manager as follows:
(1) Investment in Marketable Government Securities—In a representative mix of fixed marketable interest-bearing obligations of the United States then forming a part of the public debt which are not due or callable earlier than 4 years after the date of investment.
(2) Additional and Alternative Investments—Beginning with 2008, in such additional and alternative investment options in broad-based index funds that are similar to the index fund investment options available within the Thrift Savings Fund established under section 8437 of title 5, United States Code, as the Board determines would be prudent sources of retirement income that could yield greater amounts of income than the investment described in paragraph (1) and a participating individual may elect.
[394] “Biographical Directory of the United States Congress 1774–Present.” United States Congress. Accessed September 30, 2014 at <bioguide.congress.gov>
NOTE: This dictionary was used to determine party affiliation.
[395] Article: “Social Insecurity? Personal Accounts and the Stock Market Collapse.” By Andrew G. Biggs. American Enterprise Institute, November 21, 2008. <papers.ssrn.com>
The portfolio would be managed on a “life-cycle” basis, meaning that the proportion of stocks and bonds would automatically be adjusted as the individual aged. Following Shiller, accounts would hold 85 percent stocks through age twenty-nine, then gradually decline to 15 percent stocks by age sixty, with annual rebalancing of assets to maintain these proportions. In Bush’s 2005 personal account proposal, individuals would automatically be switched to a life-cycle account as of age forty-seven. It is likely that future personal account proposals would make a life-cycle portfolio the default option at all ages, and it is assumed that accounts would be managed in that way throughout the individual’s working career.
[396] Report: “Thrift Savings Fund, Financial Statements.” Federal Retirement Thrift Investment Board, August 8, 2023. <www.frtib.gov>
Page 6:
Federal employees, who are covered under FERS [Federal Employees’ Retirement System], the Civil Service Retirement System (CSRS), or equivalent retirement systems (as provided by statute) and members of the uniformed services, who are covered under the Blended Retirement System (BRS), or the legacy uniformed services retirement system, are eligible to join the Plan immediately upon hire. Generally, FERS employees are those employees hired on or after January 1, 1984, while CSRS employees are employees hired before January 1, 1984, who have not elected to convert to FERS. BRS participants are members of the uniformed services who first entered the uniformed services on or after January 1, 2018. Members covered under the legacy uniformed services retirement system were hired before January 1, 2018, with an opportunity for certain members, based on years of service, to elect coverage under BRS. Each group has different rules that govern contributions.
Pages 9–10:
The Plan offers its participants various investment funds that are exposed to different types and amounts of risk, including interest rate, credit, and market risk. Except for the G Fund, which is invested in a way to avoid losses, depending upon each fund’s individual risk profile, the funds can be expected to experience volatility over time, thus affecting the fund balances from one period to the next.
[397] Report: “Thrift Savings Fund, Financial Statements.” Federal Retirement Thrift Investment Board, August 8, 2023. <www.frtib.gov>
Page 6: “As of December 31, 2022, there were approximately 6.8 million participants in the Plan, with approximately 4.0 million contributing through payroll deductions.”
[398] Report: “Thrift Savings Fund, Financial Statements.” Federal Retirement Thrift Investment Board, August 8, 2023. <www.frtib.gov>
Page 4: “Thrift Savings Fund Statements of Net Assets Available for Benefits As of December 31, 2022 and 2021 (In thousands) … 2022 … Net Assets Available for Benefits [=] $736,762,642
[399] “Summary of the Thrift Savings Plan.” Federal Retirement Thrift Investment Board, August 21, 2023. <www.tsp.gov>
Pages 4–6:
As a FERS [Federal Employees Retirement System] or BRS [Blended Retirement System] participant, you receive Agency/Service Automatic (1%) Contributions. You also receive Agency/Service Matching Contributions on your own TSP [Thrift Savings Plan] contributions. These contributions don’t increase the dollar amount of your pay for income tax or Social Security purposes, nor do they come out of your pay. Your agency or service deposits them into your TSP account. They’re an essential benefit of your retirement system, so it’s important to understand how these contributions work and to maximize them to achieve your financial goals for retirement.
Agency/Service Automatic (1%) Contributions—equal to 1% of your basic pay—are deposited into your TSP account every pay period, beginning the first time you’re paid. (Exception: BRS members do not receive these contributions until they have served 60 days.) Agency/Service Automatic (1%) Contributions are not taken out of your pay; your agency/service gives them to you. You don’t have to contribute any money to your TSP account to receive these contributions, but they are subject to “vesting.” …
Agency/Service Matching Contributions—If you’re a FERS or eligible BRS participant,5 you receive Agency/Service Matching Contributions on the first 5% of pay you contribute every pay period. The first 3% is matched dollar-for-dollar by your agency or service; the next 2% is matched at 50 cents on the dollar. This means that when you contribute 5% of your basic pay, your agency or service contributes an amount equal to 4% of your basic pay to your TSP account. Together with the Agency/Service Automatic (1%) Contribution you get, your agency/service puts in a total of 5%. Keep in mind, though, that if you stop your employee contributions, your Agency/Service Matching Contributions will also stop, but Agency/Service Automatic (1%) Contributions continue to go into your account. You can contribute more than 5%, but your agency/service only matches the first 5% you contribute.
5 BRS participants who began service on or after January 1, 2018, begin receiving matching contributions after two years of service.
[400] Report: “Thrift Savings Fund, Financial Statements.” Federal Retirement Thrift Investment Board, August 8, 2023. <www.frtib.gov>
Page 12:
On June 22, 2009, the Thrift Savings Plan Enhancement Act (the Act or P.L. 111-31) was signed into law. The Act provides for immediate Agency Automatic (1%) and Matching contributions for FERS [Federal Employees Retirement System] employees (implemented in August 2009). The Act also requires civilian Federal Agencies to automatically enroll newly hired (and rehired) eligible employees unless the employee makes an affirmative election not to participate in the Fund or elect a deferral rate other than the deferral rate of 3 percent (implemented in August 2010). The default deferral rate was changed to 5 percent in October 2020. The Act also allows the Agency to establish accounts for the surviving spouses of TSP [Thrift Savings Plan] participants (implemented December 2010). In addition, the Act also gives the Federal Retirement Thrift Investment Board the authority to establish a qualified Roth contribution program (implemented in May 2012) and the authority to establish a mutual fund window. The mutual fund window was implemented on June 1, 2022.
[401] Report: “Thrift Savings Fund, Financial Statements.” Federal Retirement Thrift Investment Board, August 8, 2023. <www.frtib.gov>
Page 8:
An individual account is maintained for each Plan participant. As applicable, each participant’s account is credited with the participant’s contributions, agency automatic and matching contributions, and loan repayments and charged with loans and withdrawals. The value of the participant’s account reflects the number of shares and the daily share prices of the funds in which the participant is invested. Administrative expenses are a component of the share price calculation. The benefit to which a participant is entitled is the amount of the participant’s vested account balance.
[402] “Summary of the Thrift Savings Plan.” Federal Retirement Thrift Investment Board, August 21, 2023. <www.tsp.gov>
Page 24:
Designating a beneficiary. You should designate a person or persons, your estate, or a trust to receive your TSP [Thrift Savings Plan] account after your death. To designate a beneficiary or beneficiaries, log in to My Account on tsp.gov or use one of the ThriftLine options listed at the beginning of this booklet. For us to honor it, your beneficiary designation must be on file with us at the time of your death. We cannot honor a will or any other document.
Reviewing your beneficiaries. By law, we must pay your properly designated beneficiary(ies) under all circumstances.
[403] “Summary of the Thrift Savings Plan.” Federal Retirement Thrift Investment Board, August 21, 2023. <www.tsp.gov>
Page 11:
We offer you three approaches to investing your money:
• Individual Funds—You make your own decisions about your investment mix by choosing from any or all of the individual TSP [Thrift Savings Plan] investment funds (G, F, C, S, and I Funds).
• The L Funds—Each of the ten Lifecycle Funds (L Funds) is a diversified mix of the five individual funds. They were designed by investment professionals to let you invest your entire portfolio in a single L Fund and get the best expected return for the amount of expected risk that is appropriate for you.
• Mutual Fund Window—If you meet certain conditions and pay the necessary fees, you can invest in mutual funds available in our mutual fund window. Once you’ve made the election to move money into the mutual fund window, you independently select which mutual funds you want to invest in with that money. You cannot take loans, distributions, or withdrawals directly from money invested in the mutual fund window. You must first transfer it to a TSP fund. No more than 25% of your total account balance may be invested in the mutual fund window, and your initial investment in it must be at least $10,000.
These investment options are designed so you can choose either the L Fund that is appropriate for you, or a combination of the TSP funds and/or mutual funds that will support your personal investment strategy. You may invest in any fund or combination of funds. Because the L Funds are already made up of the five individual funds, you will duplicate your investments if you invest simultaneously in an L Fund and the individual TSP funds.
[404] Calculated with data from: “2023 SBBI Yearbook.” By Roger G. Ibbotson. Kroll 2023.
Appendix A–1: “Large-Capitalization Stocks: Total Return”
NOTES:
“In determining whether the use made of a work in any particular case is a fair use the factors to be considered shall include … (3) the amount and substantiality of the portion used in relation to the copyrighted work as a whole; and (4) the effect of the use upon the potential market for or value of the copyrighted work.”
[405] Ibbotson 2010 Valuation Yearbook: Market Results for Stocks, Bonds, Bills, and Inflation, 1926–2009. Morningstar, 2010.
Pages 53–54:
The stock market benchmark chosen should be a broad index that reflects the behavior of the stock market as a whole. … The S&P 500 was selected as the appropriate market benchmark because it is representative of a large sample of companies across a large number of industries. … In short, the S&P 500 is a good measure of the equity market as a whole.
Page 23: “Total return is equal to the sum of three component returns; income return, capital appreciation return, and reinvestment return.”
Page 203 (Glossary): “Real Return The inflation-adjusted return on an investment. It measures the growth of purchasing power. The real return of an investment is calculated by geometrically subtracting inflation from the investment’s nominal return.”
Page 201 (Glossary): “Geometric Mean Return The compound rate of return. The geometric mean of a return series is a measure of the actual average performance of a portfolio over a given time period.”
Page 202 (Glossary): “The Consumer Price Index for All Urban Consumers (CPI-U), not seasonally adjusted, is used to measure inflation.”
[406] Calculated with data from: “2023 SBBI Yearbook.” By Roger G. Ibbotson. Kroll 2023.
Appendix A–1: “Large-Capitalization Stocks: Total Return”
NOTES:
“In determining whether the use made of a work in any particular case is a fair use the factors to be considered shall include … (3) the amount and substantiality of the portion used in relation to the copyrighted work as a whole; and (4) the effect of the use upon the potential market for or value of the copyrighted work.”
[407] Ibbotson 2014 Classic Yearbook: Market Results for Stocks, Bonds, Bills, and Inflation, 1926–2013. Morningstar, 2014.
Page 304 (Glossary): “Intermediate–Term Government Bonds A one-bond portfolio with a maturity near five years. … Long-Term Corporate Bonds Citigroup long-term, high-grade corporate bond index. … Long-Term Government Bonds A one-bond portfolio with a maturity near 20 years.”
[408] Calculated with data from: “2023 SBBI Yearbook.” By Roger G. Ibbotson. Kroll 2023.
Appendix A–4: “Small-Capitalization Stocks: Total Returns From 1926–2022”
Appendix A–5: “Long-Term Corporate Bonds: Total Returns From 1926–2022”
Appendix A–6: “Long-Term Government Bonds: Total Returns From 1926–2022”
Appendix A–10: “Intermediate-Term Government Bonds: Total Returns From 1926–2022”
Appendix A–14: “U.S. Treasury Bills: Total Returns From 1926–2022”
Appendix A–15: “Inflation: From 1926–2022”
NOTES:
“In determining whether the use made of a work in any particular case is a fair use the factors to be considered shall include … (3) the amount and substantiality of the portion used in relation to the copyrighted work as a whole; and (4) the effect of the use upon the potential market for or value of the copyrighted work.”
[409] Report: “Social Security: A Primer.” Congressional Budget Office, September 2001. <www.cbo.gov>
Page 62: “Any pension system costs something to administer. Staff must perform such tasks as collecting funds, keeping records, managing assets, calculating and paying benefits, overseeing and enforcing rules, and (in some cases) marketing and selling the plans.”
[410] Study: “Administrative Costs of Private Accounts in Social Security.” By Ben Page under the direction of Douglas Hamilton and Robert Dennis. Congressional Budget Office, Macroeconomic Analysis Division, March 2004. <www.cbo.gov>
Page 1:
A key consideration in evaluating proposals for establishing a system of private accounts is the cost of administering the system. The operation of any system of accounts involves basic administrative tasks such as collecting and processing contributions, managing assets, and paying benefits—all of which require recordkeeping. Each of those tasks carries costs, which will ultimately affect a retiree’s account balance.
[411] Study: “Administrative Costs of Private Accounts in Social Security.” By Ben Page under the direction of Douglas Hamilton and Robert Dennis. Congressional Budget Office, Macroeconomic Analysis Division, March 2004. <www.cbo.gov>
Page 1:
The costs of administering the systems vary, in large part because of differences in the level of services and range of asset choices the systems provide. The current Social Security system, for example, restricts participants to one “asset”—promised benefits—and provides, on an annual basis, limited information about expected benefits. By contrast, most mutual funds offer a wide variety of services, including a broad range of asset choices and daily updates on account balances.
Another important factor that can affect administrative costs is the degree to which a system is centralized. For example, a centralized system such as the federal government’s Thrift Savings Plan may generate few or no costs for marketing and sales. In a decentralized system that operates at the retail level, such as mutual funds, the cost of those tasks may be substantial. Decentralized systems, however, also allow for competition, which can lead to better services and more efficient operation over time.
[412] Report: “Social Security: A Primer.” Congressional Budget Office, September 2001. <www.cbo.gov>
Pages 62–63:
Some lessons can be learned by looking at the administrative costs of a range of institutions that offer retirement savings accounts or that manage programs to provide income in retirement. Those institutions include mutual funds, defined-contribution pension plans, Social Security, and private-account plans in other countries. The experience of those institutions suggests that the administrative costs of a system of private accounts would depend greatly on the structure of the program. Under some proposals, administrative costs would be modest; but those costs could be high if an account system provided many services to investors and gave them a wide choice of investments.15
Of course, administrative costs may pay for services that people value. Some people may want to choose whether to participate in the program, how much to contribute, the mix of assets in their portfolio, and the frequency with which they adjust their portfolio. When they are at or near retirement, they may want choices about whether and when to convert their assets into an annuity and the kinds of annuities to buy. Restricting the freedom to make financial choices reduces administrative costs, but it may also reduce the value that people place on their accounts.
Another issue for policymakers to consider is how administrative costs would be allocated among participants. Two concerns arise. First, if people do not face the marginal costs of their transactions, they may take actions—such as churning (short-term buying and selling) of assets in their portfolios—that raise administrative costs. Second, if some of the fixed administrative costs are not spread among accounts, they could absorb much of the income of people who have small accounts (because of low incomes or intermittent work histories).
[413] Book: Costs and Benefits of Collective Pension Systems. Edited by Onno W. Steenbeek and S. G. van der Lecq. Springer–Verlag, 2007.
Page 55: “The table shows that administrative costs expressed as percentage of total assets are negatively related to the size of pension funds.”
[414] “Summary of the Thrift Savings Plan.” Federal Retirement Thrift Investment Board, May 2022. <www.justfacts.com>
Page 17: “The effect of administrative expenses (after forfeitures) on the earnings of the G, F, C, S, and I Funds is expressed as a net expense ratio for each fund. The expense ratio for each fund is calculated by dividing the total administrative expenses charged to that fund over a period of time by the fund’s average balance during the same period.”
[415] This figure could also be expressed as “50 basis points,” a basis point being one one-hundredth of a percentage point.
[416] Study: “Administrative Costs of Private Accounts in Social Security.” By Ben Page under the direction of Douglas Hamilton and Robert Dennis. Congressional Budget Office, Macroeconomic Analysis Division, March 2004. <www.cbo.gov>
Page 2:
The size of the account is crucial in determining the percentage impact of administrative costs on account balances. Because large accounts are unlikely to cost much more to administer than small accounts, administrative costs would affect their balances proportionately less. For example, balances in accounts receiving 4 percent of taxable earnings would probably be affected by administrative costs only half as much, in percentage terms, as accounts receiving 2 percent of taxable earnings.
[417] Report: “Social Security Privatization and the Annuities Market.” Congressional Budget Office, February 1998. <www.cbo.gov>
Page 5: “In addition, the smaller the market, the larger the administrative costs per customer tend to be….”
[418] Book: Costs and Benefits of Collective Pension Systems. Edited by Onno W. Steenbeek and S. G. van der Lecq. Springer–Verlag, 2007.
Page 55:
Economies of scale result from high fixed costs and other operating costs that increase less than proportionally with pension fund size. Examples include the costs arising from policy development, data management systems, reporting requirements and the hiring of experts such as actuaries, accountants, lawyers, and consultants.
The lower part of Table 1 presents the (weighted) average administrative costs for different size categories in terms of total assets. The table shows that administrative costs expressed as percentage of total assets are negatively related to the size of pension funds. While the smallest funds have operating costs of 1.23% of total assets, this percentage is only 0.10% for the largest funds. … In summary, Table 1 shows that the operating costs of pension funds are characterized by strong economies of scale, irrespective of whether the size of the institution is expressed in terms of participant numbers or total assets.
[419] Memo: “Estimated Financial Effects of ‘The Progressive Personal Account Plan.’ ” By Stephen C. Goss. United States Social Security Administration, Office of the Chief Actuary, December 1, 2003. <www.ssa.gov>
Starting in 2005, all workers who will reach their 55th birthday on January 1, 2005 or later will have the option to enroll in the personal account plan. Enrollees with earnings in OASDI (Social Security) covered employment will have a portion of their payroll tax contribution (12.4 percent of taxable earnings in total) redirected from the OASDI Trust Funds to an individual account. The percentage of taxable earnings to be redirected in 2005 will be 10 percent of the first $10,000 of covered earnings for the year, plus 5 percent of earnings in excess of $10,000 up to the OASDI taxable maximum amount (which is $87,000 for 2003). The $10,000 threshold would be indexed by increases in the SSA [Social Security Administration] national Average Wage Index (AWI) for years after 2005. The progressive scale for IA contributions redirected from the OASDI Trust Funds is estimated to amount to about 6.4 percentage points of the 12.4 percent payroll tax rate on average. The total amount redirected from the OASDI contribution rate indicated in Table 1 is less than 6.4 percent of payroll for years through 2029, because workers age 55 and older at the beginning of 2005 have no IA contributions.
Under the plan, individual account (IA) assets, once credited, would be automatically invested by workers through a central administrative authority that would maintain all records of individual transactions and balances. Participants would be offered a range of investment options provided by qualified private investment companies. … Unless otherwise specified, IA balances would be maintained in a default portfolio with 65 percent in a specified broad index fund consisting of private equities for corporations based in the United States (such as the Wilshire 5000) and 35 percent in a broad index of corporate bonds issued by companies based in the United States. Due to the nature of the accounts, an ultimate administrative cost of 0.25 percent of assets is assumed to be reasonable.
[420] Calculated with data from the cost estimate: “H.R. 3821, Bipartisan Retirement Security Act of 2004.” Congressional Budget Office, February 24, 2004. <www.cbo.gov>
Page 1:
H.R. 3821, the Bipartisan Retirement Security Act of 2004, introduced by Representatives [Jim] Kolbe [Republican, Arizona] and [Charles] Stenholm [Democrat, Texas], would make numerous changes to the Social Security system.1 … [It] would redirect approximately 2.3 percentage points of the current 12.4 percent payroll tax for Old-Age, Survivors and Disability Insurance (OASDI) to individual accounts, which would belong to covered workers.
Page 7: “H.R. 3821 would establish a new system of individual accounts (labeled individual security accounts), which would be funded primarily through receipts from the existing payroll tax and earnings on the accounts’ investments.”
Page 18: “In general, H.R. 3821 copies many features of the proposed IAs [individual accounts] from the federal employees’ Thrift Savings Plan (TSP), the government’s 401(k)-type program, a giant venture that now manages more than $100 billion in assets on behalf of 3 million current and former federal employees.”
CALCULATION: 2.3 / 12.4 = 19%
[421] “Biographical Directory of the United States Congress 1774–Present.” United States Congress. Accessed September 30, 2014 at <bioguide.congress.gov>
NOTE: Just Facts used this dictionary to determine party affiliations.
[422] Study: “Administrative Costs of Private Accounts in Social Security.” By Ben Page under the direction of Douglas Hamilton and Robert Dennis. Congressional Budget Office, Macroeconomic Analysis Division, March 2004. <www.cbo.gov>
Page 12:
The administrative costs of the TSP [Thrift Savings Plan] are held in check by several factors: investment choices are restricted; the system is quite large, and investments are bundled and made centrally; and all covered workers operate under the same payroll system, which simplifies recordkeeping. In addition, all records provided by the employing agencies are in electronic form. An annual cost of $25 would reduce the assets in an account receiving 2 percent of earnings by about 5 percent at retirement. However, the administrative costs of a universal system that offered the same services as the TSP could be higher because a different set of employers and employees would be covered. For example, many employers provide Social Security with paper earnings records, which are more costly to process than electronic records.
NOTE: The following factors could cause Social Security personal ownership systems to meet or better the Thrift Savings Plan administrative costs:
[423] “Summary of the Thrift Savings Plan.” Federal Retirement Thrift Investment Board, May 2022. <www.justfacts.com>
Page 17: “The effect of administrative expenses (after forfeitures) on the earnings of the G, F, C, S, and I Funds is expressed as a net expense ratio for each fund. The expense ratio for each fund is calculated by dividing the total administrative expenses charged to that fund over a period of time by the fund’s average balance during the same period.”
[424] Webpage: “Administrative and Investment Expenses.” Thrift Savings Plan. Last updated April 21, 2023.
This first table shows, for each of the TSP [Thrift Savings Plan] individual funds, the 2022 gross administrative expense ratio, the net administrative expense ratio, and the investment expense ratio. It then adds the net administrative expense ratio to the investment expense ratio to show you the total expense ratio. This is how much the fund’s earnings were reduced to cover expenses.
|
G Fund |
F Fund |
C Fund |
S Fund |
I Fund |
|
Gross Administrative Expense Ratio |
||||
|
0.067% |
0.068% |
0.068% |
0.068% |
0.068% |
|
Net Administrative Expense Ratio |
||||
|
0.057% |
0.058% |
0.058% |
0.058% |
0.058% |
|
Investment Expense Ratio |
||||
|
0.000% |
0.020% |
0.001% |
0.032% |
0.006% |
|
Total Expense Ratio (Net Admin + Investment) |
||||
|
0.057% |
0.078% |
0.059% |
0.090% |
0.064% |
[425] CALCULATION: ($50,000/year) × (45 years) × 12.4% = $279,000
[426] Pamphlet: “A ‘Snapshot.’ ” United States Social Security Administration, August 2021. <www.ssa.gov>
Page 3: “We do not put the Social Security and Medicare taxes you pay in a special account for you. They are used to pay benefits for other workers today, just as your future benefits will be paid for by future workers.”
[427] Dataset: “Table VI.G7. Operations of the Combined OASI and DI Trust Funds, in CPI-Indexed 2023 Dollars, Calendar Years 1970–2100.” United States Social Security Administration, Office of the Chief Actuary. Accessed August 15, 2023 at <www.ssa.gov>
“The combined OASI [Old Age and Survivors Insurance] and DI [Disability Insurance] Trust Funds become depleted in 2034 under the intermediate assumptions and in 2031 under the high-cost assumptions, so estimates for later years are not shown.”
NOTE: The “combined OASI and DI Trust Funds” comprise the Social Security Trust Fund.
[428] An Excel file containing the data and calculations is available upon request.
For projecting future returns, there is considerable question over whether the geometric or arithmetic return of the past is more instructive.† Thus, to provide information that portrays the strengths and weaknesses of both measures, Just Facts cites the worst- and best-case geometric return scenarios for all 45-year periods since 1926. This allows readers to see the full range of historical variation for the investment period.
With regard to the “average” scenario, Just Facts cites the geometric return (which is by mathematical law always lower than the arithmetic return‡) because our Standards of Credibility require that we give “preferentiality to figures that are contrary to our viewpoints” and use “the most cautious plausible interpretations of such data.”
NOTES:
[429] An Excel file containing the data and calculations is available upon request.
For projecting future returns, there is considerable question over whether the geometric or arithmetic return of the past is more instructive.† Thus, to provide information that portrays the strengths and weaknesses of both measures, Just Facts cites the worst- and best-case geometric return scenarios for all 45-year periods since 1926. This allows readers to see the full range of historical variation for the investment period.
With regard to the “average” scenario, Just Facts cites the geometric return (which is by mathematical law always lower than the arithmetic return‡) because our Standards of Credibility require that we give “preferentiality to figures that are contrary to our viewpoints” and use “the most cautious plausible interpretations of such data.”
NOTES:
[430] An Excel file containing the data and calculations is available upon request.
For projecting future returns, there is considerable question over whether the geometric or arithmetic return of the past is more instructive.† Thus, to provide information that portrays the strengths and weaknesses of both measures, Just Facts cites the worst- and best-case geometric return scenarios for all 45-year periods since 1926. This allows readers to see the full range of historical variation for the investment period.
With regard to the “average” scenario, Just Facts cites the geometric return (which is by mathematical law always lower than the arithmetic return‡) because our Standards of Credibility require that we give “preferentiality to figures that are contrary to our viewpoints” and use “the most cautious plausible interpretations of such data.”
NOTES:
[431] Report: “Shorter Life Expectancy Reduces Projected Lifetime Benefits for Lower Earners.” Government Accountability Office, March 2016. <www.gao.gov>
Page 7: “When workers die before reaching age 62, they may not receive any of the Social Security retirement benefits that they would have been entitled to receive had they lived longer.17 … 17 The CDC [Centers for Disease Control and Prevention] reported that nearly 25 percent of the U.S. deaths in 2011 were among people age 25 to 65.”
[432] “2008 Republican Platform.” Republican National Committee, September 2008. <www.presidency.ucsb.edu>
“We believe the solution [to Social Security’s financial problems] should give workers control over, and a fair return on, their contributions. No changes in the system should adversely affect any current or near-retiree.”
[433] Pamphlet: “Understanding the Benefits.” United States Social Security Administration, January 2023. <www.ssa.gov>
Pages 12–13:
Survivors Benefits
When you die, your family may be eligible for benefits based on your work.
Family members who can collect benefits include a surviving spouse who is:
• 60 or older.
• 50 or older and has a qualifying disability.
• Any age if they care for your child who is younger than 16 or has a qualifying disability and is entitled to Social Security benefits on your record.
Your children can receive benefits, too, if they’re unmarried and:
• Younger than 18 years old.
• Between 18 and 19 years old, but in an elementary or secondary school as full-time students.
• Age 18 or older and has a qualifying disability (the disability must have started before age 22).
Additionally, your parents can receive benefits on your earnings if they were dependent on you for at least half of their support.
One-Time Payment After Death
If you have enough credits, a one-time payment of $255 also may be made after your death. This benefit may be paid to your spouse or minor children if they meet certain requirements.
If You’re Divorced and Have a Surviving Ex-Spouse
If you’re divorced, your ex-spouse may be eligible for survivor’s benefits based on your earnings when you die. They must:
• Be at least age 60 years old (or 50 if they have a qualifying disability) and have been married to you for at least 10 years.
• Be at any age if they care for a child who is eligible for benefits based on your earnings.
• Not be entitled to a benefit based on their own work that is equal or higher than the full insurance amount on your record.
• Not be currently married, unless the remarriage occurred after age 60 or after age 50 if they have a qualifying disability.
Benefits paid to an ex-spouse won’t affect the benefit rates for other survivors receiving benefits on your earnings record.
NOTE: If you’re deceased and your ex-spouse remarries after age 60, they may be eligible for Social Security benefits based on either your work or the new spouse’s work, whichever is higher.
[434] Report: “Strengthening Social Security and Creating Personal Wealth for All Americans.” The President’s Commission to Strengthen Social Security, December 21, 2001. <govinfo.library.unt.edu>
Page 7:
One egregious failing of the present system is its effect on minorities with shorter life spans than the white majority. For black men age 20, only some 65 percent can be expected to survive to age 65. Thus, one of every three black youths will pay for retirement benefits they will never collect. No one intends this; and with time the gap may close. But it is not closed now. And because Social Security provides no property rights to its contributors—the Supreme Court has twice so ruled—a worker could easily work forty years then die and own not a penny of the contributions he has made for retirement benefits he will never collect. There are, to be sure, survivors and dependents benefits, but many workers die before eligibility for these is established. Disability insurance was added during the Eisenhower Administration so that workers are covered during their working years. But far too many never receive any retirement benefits and leave no estate.
Page 32:
Almost one in five 20-year-olds will not live to age 65. Among African American males, this percentage is even higher. While Social Security offers survivors benefits to spouses who have reached retirement age and to children under the age of 16, Social Security—which constitutes the total saving for many lower-income workers—offers no opportunity for workers to build and pass on any substantial wealth to their heirs, even if the worker died prior to receiving any benefits at all. The only lump sum wealth Social Security provides to pass on is a one-time payment of a $255 death benefit.
[435] Pamphlet: “Understanding the Benefits.” United States Social Security Administration, January 2023. <www.ssa.gov>
Page 7:
Full Retirement Age
If you were born from 1943 to 1960, the age at which full retirement benefits are payable increases gradually to age 67. In 2023, if your birth year is 1955 or earlier, you’re already eligible for your full Social Security benefit. Use the following chart to find out your full retirement age.
|
Year of Birth |
Full Retirement Age |
|
1943–1954 |
66 |
|
1955 |
66 and 2 months |
|
1956 |
66 and 4 months |
|
1957 |
66 and 6 months |
|
1958 |
66 and 8 months |
|
1959 |
66 and 10 months |
|
1960 or later |
67 |
[436] Calculated with the data from the report: “Provisional Life Expectancy Estimates for 2021.” By Elizabeth Arias and others. U.S. Department of Health and Human Services, Centers for Disease Control and Prevention, August 2022. <www.cdc.gov>
Page 2:
Table. Provisional Expectation of Life, by Age, Hispanic Origin, Race for the Non-Hispanic Population, and Sex: United States, 2021 … Age [=] 40 … Hispanic … Male [=] 37.3 … Female [=] 42.5 … Non-Hispanic white … Male [=] 36.5 … Female [=] 40.8 … Non-Hispanic black … Male [=] 32.0 … Female [=] 37.7 …
Life tables by race and Hispanic origin have been adjusted for race and ethnicity misclassification on death certificates; see Technical Notes in this report. Estimates are based on provisional data for 2021. Provisional data are subject to change as additional data are received.
NOTES:
[437] Report: “Strengthening Social Security and Creating Personal Wealth for All Americans.” The President’s Commission to Strengthen Social Security, December 21, 2001. <govinfo.library.unt.edu>
Page 11: “Personal accounts improve retirement security by facilitating wealth creation and providing participants with assets that they own and that can be inherited, rather than providing only claims to benefits that remain subject to political negotiation.”
[438] Report: “Social Security Reform: Current Issues and Legislation.” By Dawn Nuschler. Congressional Research Service, January 15, 2014. <digital.library.unt.edu>
Page 30:
Legislation Introduced in the 110th Congress … H.R. 2002 (which is similar to H.R. 530 in the 109th Congress), H.R. 4181, S. 2765 (which is similar to S. 540 in the 109th Congress) and H.R. 6110 would have established individual accounts funded with a redirection of current payroll taxes, among other changes. … There was no congressional action on these measures during the 110th Congress.
Page 31:
H.R. 2002. Representative Sam Johnson introduced H.R. 2002 (Individual Social Security Investment Program Act of 2007) on April 23, 2007. The measure would have established individual accounts funded with 6.2 percentage points of the current Social Security payroll tax. Participation in the individual account system would have been voluntary for workers aged 22 to 54 (in 2007) and mandatory for younger individuals. …
S. 2765. Senator Chuck Hagel introduced S. 2765 (Saving Social Security Act of 2008) on March 13, 2008. The measure would have allowed workers born in 1963 or later (workers aged 45 or younger in 2008) to redirect 4 percentage points of the current Social Security payroll tax to an individual account (a SAFE account). Eligible workers would have been enrolled automatically in the individual account system and allowed to waive their eligibility for a SAFE account.
Page 32:
H.R. 107. Representative Jeff Flake introduced H.R. 107 (Securing Medicare and Retirement for Tomorrow Act of 2009) on January 6, 2009.60 Among other provisions, the measure would have established individual accounts funded with 6.2 percentage points of the current Social Security payroll tax. Participation in the individual account system would have been mandatory for workers below the Social Security full retirement age.†
Pages 33–34:
H.R. 4529. Representative Paul Ryan introduced H.R. 4529 (Roadmap for America’s Future Act of 2010) on January 27, 2010, to provide for the reform of health care, the Social Security system, the tax code for individuals and business, job training, and the budget process.65 Title IV of the bill … would have allowed workers aged 55 or younger in 2012 to redirect a portion of their payroll tax contributions to voluntary individual accounts.
NOTE: † In 2009, the year this bill was sponsored, people who were born in 1943 turned 66 years old, which is the full retirement age for people born in 1943. [Pamphlet: “Understanding the Benefits.” United States Social Security Administration, January 2023. <www.ssa.gov>]
[439] “Biographical Directory of the United States Congress 1774–Present.” United States Congress. Accessed September 30, 2014 at <bioguide.congress.gov>
NOTE: Just Facts used this dictionary to determine party affiliations.
[440] “2008 Republican Platform.” Republican National Committee, September 2008. <www.presidency.ucsb.edu>
“We believe the solution [to Social Security’s financial problems] should give workers control over, and a fair return on, their contributions. No changes in the system should adversely affect any current or near-retiree.”
[441] “2012 Republican Party Platform.” Republican National Committee, August 2012. <www.presidency.ucsb.edu>
While no changes should adversely affect any current or near-retiree, comprehensive reform should address our society’s remarkable medical advances in longevity and allow younger workers the option of creating their own personal investment accounts as supplements to the system. Younger Americans have lost all faith in the Social Security system, which is understandable when they read the nonpartisan actuary’s reports about its future funding status. Born in an old industrial era beyond the memory of most Americans, it is long overdue for major change, not just another legislative stopgap that postpones a day of reckoning. To restore public trust in the system, Republicans are committed to setting it on a sound fiscal basis that will give workers control over, and a sound return on, their investments. The sooner we act, the sooner those close to retirement can be reassured of their benefits and younger workers can take responsibility for planning their own retirement decades from now.
[442] “2016 Republican Party Platform.” Republican National Committee, July, 2016. <www.presidency.ucsb.edu>
Current retirees and those close to retirement can be assured of their benefits. Of the many reforms being proposed, all options should be considered to preserve Social Security. As Republicans, we oppose tax increases and believe in the power of markets to create wealth and to help secure the future of our Social Security system. Saving Social Security is more than a challenge. It is our moral obligation to those who trusted in the government’s word.
[443] “Resolution Regarding the Republican Party Platform.” Republican National Committee, August 22, 2020. <www.presidency.ucsb.edu>
WHEREAS, The Republican National Committee (RNC) has significantly scaled back the size and scope of the 2020 Republican National Convention in Charlotte due to strict restrictions on gatherings and meetings, and out of concern for the safety of convention attendees and our hosts. …
RESOLVED, That the 2020 Republican National Convention will adjourn without adopting a new platform until the 2024 Republican National Convention.
[444] “2008 Democratic Party Platform.” Democratic National Committee, August 25, 2008. <www.presidency.ucsb.edu>
“We will fulfill our obligation to strengthen Social Security and to make sure that it provides guaranteed benefits Americans can count on, now and in future generations. We will not privatize it.”
[445] “2012 Democratic Party Platform.” Democratic National Committee, September 2012. <www.presidency.ucsb.edu>
“We will block Republican efforts to subject Americans’ guaranteed retirement income to the whims of the stock market through privatization.”
[446] “2016 Democratic Party Platform.” Democratic National Committee, September 2012. <www.presidency.ucsb.edu>
“We will fight every effort to cut, privatize, or weaken Social Security, including attempts to raise the retirement age, diminish benefits by cutting cost-of-living adjustments, or reducing earned benefits.”
[447] “2020 Democratic Party Platform.” 2020 Platform Committee, July 27, 2020. <democrats.org>
Page 26:
Social Security is the most enduring thread in our nation’s social safety net. We will enact policies to make Social Security more progressive, including increasing benefits for all beneficiaries, meaningfully increasing minimum benefit payments, increasing benefits for long-duration beneficiaries, and protecting surviving spouses from benefit cuts. We will eliminate provisions that unfairly reduce public sector workers’ earned Social Security benefits. In light of weakened retirement security for unpaid caregivers and caregivers for family members, who sacrifice not only wages but Social Security benefits when they swap paid labor for unpaid care work, Democrats support Social Security reform which better accounts for the challenges facing unpaid caregivers—including incremental reforms to the benefit formula to mitigate the penalty for unpaid care.
Democrats will reject every effort to cut, privatize, or weaken Social Security, including attempts to raise the retirement age, diminish benefits by cutting cost-of-living adjustments, or reduce earned benefits. We will ensure Social Security will be there forever.
[448] Webpage: “Reform Group.” José Piñera. Accessed September 2, 2023 at <www.josepinera.org>
Chile [1980] - Peru [1993] - Australia, Colombia [1994] - Uruguay [1996] - Mexico [1997] - Bolivia, El Salvador, Hungary, Kazhakstan [1998] - Hungary [1998] - Poland, Sweden [1999] - Hong Kong [2000] - Costa Rica, Latvia [2001] - Bulgaria, Croatia, Estonia, Russia [2002] - Dominican Rep., Kosovo [2003] - Korea, Lithuania [2004] - Nigeria, Slovakia [2005] - Macedonia [2006] - Romania [2008]
[449] Webpage: “Pension Systems Reform.” International Federation of Pension Fund Administrator. Accessed September 2, 2023 at <www.fiapinternacional.org>
Countries that have introduced a mandatory or quasi-mandatory individually-funded pension programs—sorted by starting year of operations.
The Multiple Pillar terminology used to describe the structure of the Pension Systems of each one of the countries described in this section, follows the internationally accepted taxonomic guidelines which are commonly used. This classification is as follows:
First Pillar: Non-contributory or social pensions pillar, financed with the public budget (general or specific taxes). There are countries that have universal non-contributory pensions, without means testing; other countries focus this type of pension on lower income people, through means testing.
Second Pillar: The mandatory contributory pillar of the pensions system, comprising mainly two types of components: (i) a state-managed PAYGO [pay as you go] program, and/or (ii) an individually funded program, managed by private agencies.
Third Pillar: Voluntary contributory pillar of the pension system, with tax incentives to stimulate complementary pension savings (in addition to the mandatory Second Pillar savings). Depending on the country, this Pillar is managed by private entities, banks and other institutions.
[450] “The President’s News Conference.” George W. Bush, March 16, 2005. <www.presidency.ucsb.edu>
David [David Gregory, NBC News].
Social Security Reform
Q. Mr. President, you say you’re making progress in the Social Security debate. Yet private accounts, as the centerpiece of that plan, something you first campaigned on 5 years ago and laid before the American people, remains, according to every measure we have, poll after poll, unpopular with a majority of Americans. So the question is, do you feel that this is a point in the debate where it’s incumbent upon you, and nobody else, to lay out a plan to the American people for how you actually keep Social Security solvent for the long term?
NOTE: Credit for bringing this fact to the attention of Just Facts belongs to the Media Research Center [Article: “Gregory Insists Personal Accounts ‘Unpopular,’ Poll Differs.” March 17, 2005. <archive.mrc.org>]
[451] “Washington Post–ABC News Poll: Social Security/Iraq.” Washington Post, Tuesday, March 15, 2005. <www.washingtonpost.com>
This Washington Post–ABC News poll was conducted by telephone March 10–13, 2005 among 1,001 randomly selected adults nationwide. Margin of sampling error for overall results is plus or minus three percentage points. …
9g. Would you support or oppose a plan in which people who chose to could invest some of their Social Security contributions in the stock market?
NOTE: Credit for bringing this fact to the attention of Just Facts belongs to the Media Research Center [Article: “Gregory Insists Personal Accounts ‘Unpopular,’ Poll Differs.” March 17, 2005. <archive.mrc.org>]
[452] “Washington Post–ABC News Poll: Social Security/Iraq.” Washington Post, Tuesday, March 15, 2005. <www.washingtonpost.com>
This Washington Post–ABC News poll was conducted by telephone March 10–13, 2005 among 1,001 randomly selected adults nationwide. Margin of sampling error for overall results is plus or minus three percentage points. …
9g. Would you support or oppose a plan in which people who chose to could invest some of their Social Security contributions in the stock market?
NOTE: Credit for bringing this fact to the attention of Just Facts belongs to the Media Research Center [Article: “Gregory Insists Personal Accounts ‘Unpopular,’ Poll Differs.” March 17, 2005. <archive.mrc.org>]
[453] “Washington Post–ABC News Poll: Social Security/Iraq.” Washington Post, Tuesday, March 15, 2005. <www.washingtonpost.com>
“9g. Would you support or oppose a plan in which people who chose to could invest some of their Social Security contributions in the stock market?”
|
Date |
Support |
Oppose |
No Opinion |
|
March 13, 2005 |
56 |
41 |
3 |
|
December 19, 2004 |
53 |
44 |
3 |
|
July 15, 2002 |
52 |
45 |
3 |
|
April 22, 2001 |
53 |
46 |
2 |
|
March 25, 2001 |
52 |
45 |
3 |
|
October 30, 2000 |
58 |
35 |
8 |
|
September 6, 2000 |
59 |
37 |
4 |
|
May 10, 2000 |
64 |
31 |
5 |
[454] Article: “Skepticism of Bush’s Social Security Plan Is Growing.” By Jonathan Weisman. Washington Post, March 15, 2005. Page A01. <www.washingtonpost.com>
NOTE: Credit for bringing this fact to the attention of Just Facts belongs to the Media Research Center [Article: “Gregory Insists Personal Accounts ‘Unpopular,’ Poll Differs.” March 17, 2005. <archive.mrc.org>]
[455] Article: “Study Says Disabled Would Lose Benefits Under New Social Security Plan.” By Robert Pear. New York Times, February 7, 2001. <www.nytimes.com>
[456] Article: “Study Says Disabled Would Lose Benefits Under New Social Security Plan.” By Robert Pear. New York Times, February 7, 2001. <www.nytimes.com>
“The new study, by the General Accounting Office, an investigative arm of Congress, concludes that ‘even under the best of circumstances, Social Security reform proposals would reduce benefits’ for people with disabilities.”
[457] Calculated with data from the report: “Social Security Reform: Potential Effects on SSA’s [Social Security Administration’s] Disability Program and Beneficiaries,” United States General Accounting Office, January 2001. <www.gao.gov>
Page 43: “This scenario maintains current-law benefits while increasing payroll tax rates to levels that support those benefits.”
Page 44: Data from “Table 9: Payroll Tax Rates.”
|
Years |
Disability Tax Rate |
|
2000–24 |
1.80% |
|
2060–73 |
2.69% |
CALCULATION: (2.69 – 1.80) / 1.80 = .49
[458] Calculated with data from the report: “Social Security Reform: Potential Effects on SSA’s [Social Security Administration’s] Disability Program and Beneficiaries,” United States General Accounting Office, January 2001. <www.gao.gov>
Page 43: “This scenario maintains current-law benefits while increasing payroll tax rates to levels that support those benefits.”
Page 44: Data from “Table 9: Payroll Tax Rates.”
|
Years |
Disability Tax Rate |
|
2000–24 |
1.80% |
|
2060–73 |
2.69% |
CALCULATION: (2.69 – 1.80) / 1.80 = .49
[459] Article: “Study Says Disabled Would Lose Benefits Under New Social Security Plan.” By Robert Pear. New York Times, February 7, 2001. <www.nytimes.com>
[460] Report: “Social Security Reform: Potential Effects on SSA’s [Social Security Administration’s] Disability Programs and Beneficiaries,” United States General Accounting Office, January 2001. <www.gao.gov>
Page 36: “In the cases we studied, our analyses indicate that most disabled beneficiaries would receive higher benefits under Social Security reform proposals than under a solvency scenario that maintained payroll tax rates while reducing benefits.”
[461] Report: “Social Security Reform: Potential Effects on SSA’s [Social Security Administration’s] Disability Programs and Beneficiaries,” United States General Accounting Office, January 2001. <www.gao.gov>
Page 36: “In the cases we studied, our analyses indicate that most disabled beneficiaries would receive higher benefits under Social Security reform proposals than under a solvency scenario that maintained payroll tax rates while reducing benefits.”
[462] Article: “Study Says Disabled Would Lose Benefits Under New Social Security Plan.” By Robert Pear. New York Times, February 7, 2001. <www.nytimes.com>
[463] Article: “Study Says Disabled Would Lose Benefits Under New Social Security Plan.” By Robert Pear. New York Times, February 7, 2001. <www.nytimes.com>
President Bush has said he wants to let workers put some of their Social Security payroll taxes into personal investment accounts, but at the same time he has championed the rights of people with disabilities.
The new study, by the General Accounting Office, an investigative arm of Congress, concludes that “even under the best of circumstances, Social Security reform proposals would reduce benefits” for people with disabilities.
[464] Webpage: “Social Security: Governor Bush’s Approach.” Bush/Cheney 2000. <bit.ly>
[465] Report: “Strengthening Social Security and Creating Personal Wealth for All Americans.” President’s Commission to Strengthen Social Security, December 2001. <govinfo.library.unt.edu>
Page 149:
The primary objective of this Commission has been to reform the Social Security retirement program. Although the Disability Insurance (DI) program faces financial problems similar to the Old-Age and Survivors Insurance (OASI) program, the nature of the issues facing the DI program are far more complex. As a practical matter, determining whether an individual is disabled for DI purposes is often a complicated and subjective process. Moreover, some basic features of the DI program are at odds with current thinking on disability policy, which emphasizes the importance of supporting disabled individuals’ efforts to be self-sufficient when possible. The Commission’s short life span has not allowed time for the careful deliberation necessary to develop sound reform plans for the disability program. Because of the complexity and sensitivity of the issues involved, we recommend that the President address the DI program through a separate policy development process.
[466] Webpage: “History: Frequently Asked Questions.” United States Social Security Administration. Accessed July 5, 2018 at
Q21: When did Social Security cards bear the legend “NOT FOR IDENTIFICATION”?
A: The first Social Security cards were issued starting in 1936, they did not have this legend. Beginning with the sixth design version of the card, issued starting in 1946, SSA [Social Security Administration] added a legend to the bottom of the card reading “FOR SOCIAL SECURITY PURPOSES – NOT FOR IDENTIFICATION.”
[467] Pamphlet: “Your Social Security Account Card: What It Is, What You Do with It, & Why.” U.S. Social Security Administration, July 1961.
Tear Off This Card …
Your Card shows the number of your social security account. It is necessary to identify the account as belonging to you, but it has no other purpose. The social security card should not be used for identification purposes.
[468] Webpage: “Social Security Number Chronology.” United States Social Security Administration. Updated November 9, 2005. <www.ssa.gov>
1961
The Civil Service Commission adopted the SSN [Social Security number] as an official Federal employee identifier.
Internal Revenue Code Amendments (P.L. 87-397) required each taxpayer to furnish identifying number for tax reporting.
1962
The Internal Revenue Service adopted the SSN as its official taxpayer identification number.
1964
Treasury Department, via internal policy, required buyers of Series H savings bonds to provide their SSNs.
1965
Internal Revenue Amendments (P.L. 89-384) enacted Medicare. It became necessary for most individuals age 65 and older to have an SSN.
1966
The Veterans Administration began to use the SSN as the hospital admissions number and for patient record keeping.
1969
The Department of Defense adopted the SSN in lieu of the military service number for identifying Armed Forces personnel.
1970
Bank Records and Foreign Transactions Act (P.L. 91-508) required all banks, savings and loan associations, credit unions and brokers/dealers in securities to obtain the SSNs of all of their customers. Also, financial institutions were required to file a report with the IRS, including the SSN of the customer, for any transaction involving more than $10,000.
[469] Webpage: “History: Frequently Asked Questions.” United States Social Security Administration. Accessed July 5, 2018 <www.ssa.gov>
Q21: When did Social Security cards bear the legend “NOT FOR IDENTIFICATION”?
A: The first Social Security cards were issued starting in 1936, they did not have this legend. Beginning with the sixth design version of the card, issued starting in 1946, SSA added a legend to the bottom of the card reading “FOR SOCIAL SECURITY PURPOSES – NOT FOR IDENTIFICATION.” This legend was removed as part of the design changes for the 18th version of the card, issued beginning in 1972. The legend has not been on any new cards issued since 1972.
[470] Bill Summary and Status for Public Law 103-465: “Uruguay Round Agreements Act.” 103rd Congress. Signed into law by Bill Clinton on December 8, 1994. <www.gpo.gov>
Page 202: “Sec. 742 Taxpayer Identification Numbers Required at Birth.”
[471] Public Law 103-465: “Uruguay Round Agreements Act.” 103rd Congress. Signed into law by Bill Clinton on December 8, 1994. <www.gpo.gov>
Section 742:
Taxpayer Identification Numbers Required at Birth.
(a) Earned Income Credit—Clause (i) of section 32(c)(3)(D) is amended to read as follows:
(i) In General—The requirements of this subparagraph are met if the taxpayer includes the name, age, and TIN of each qualifying child (without regard to this subparagraph) on the return of tax for the taxable year.
(b) Dependency Exemption—Subsection (e) of section 6109 is amended to read as follows:
“(e) Furnishing Number for Dependents—Any taxpayer who claims an exemption under section 151 for any dependent on a return for any taxable year shall include on such return the identifying number (for purposes of this title) of such dependent.”
(c) Effective Date—
(1) In General—Except as provided in paragraph (2), the amendments made by this section shall apply to returns for taxable years beginning after December 31, 1994.
(2) Exception—The amendments made by this section shall not apply to—
(A) returns for taxable years beginning in 1995 with respect to individuals who are born after October 31, 1995, and
(B) returns for taxable years beginning in 1996 with respect to individuals who are born after November 30, 1996.
[472] Webpage: “When Am I Legally Required to Provide My Social Security Number?” United States Social Security Administration. Updated December 14, 2010. <www.ssa.gov>